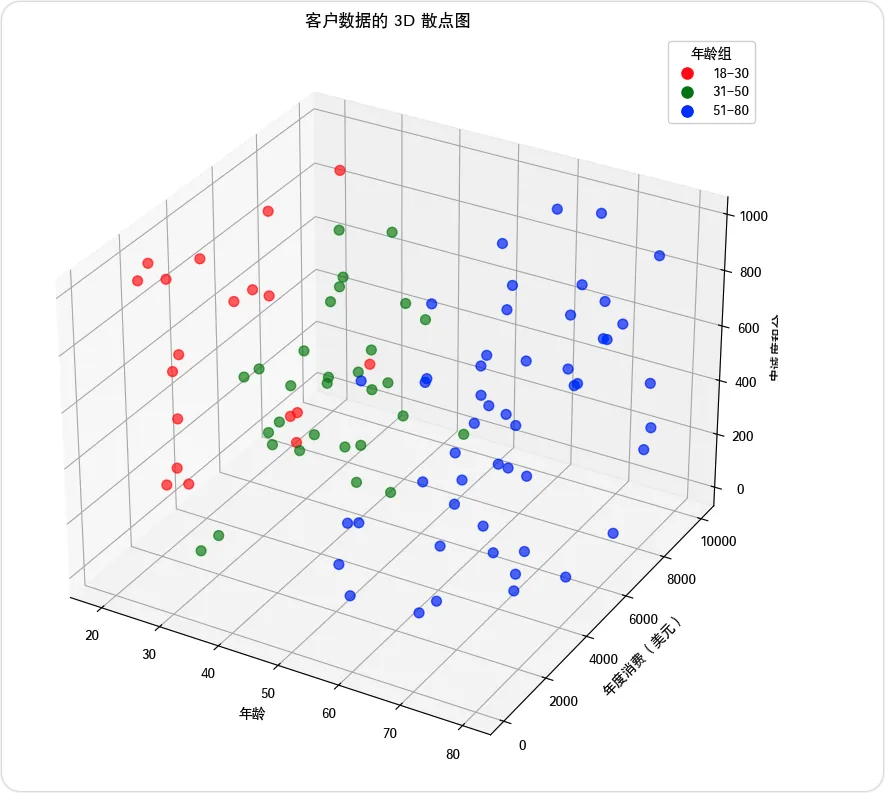
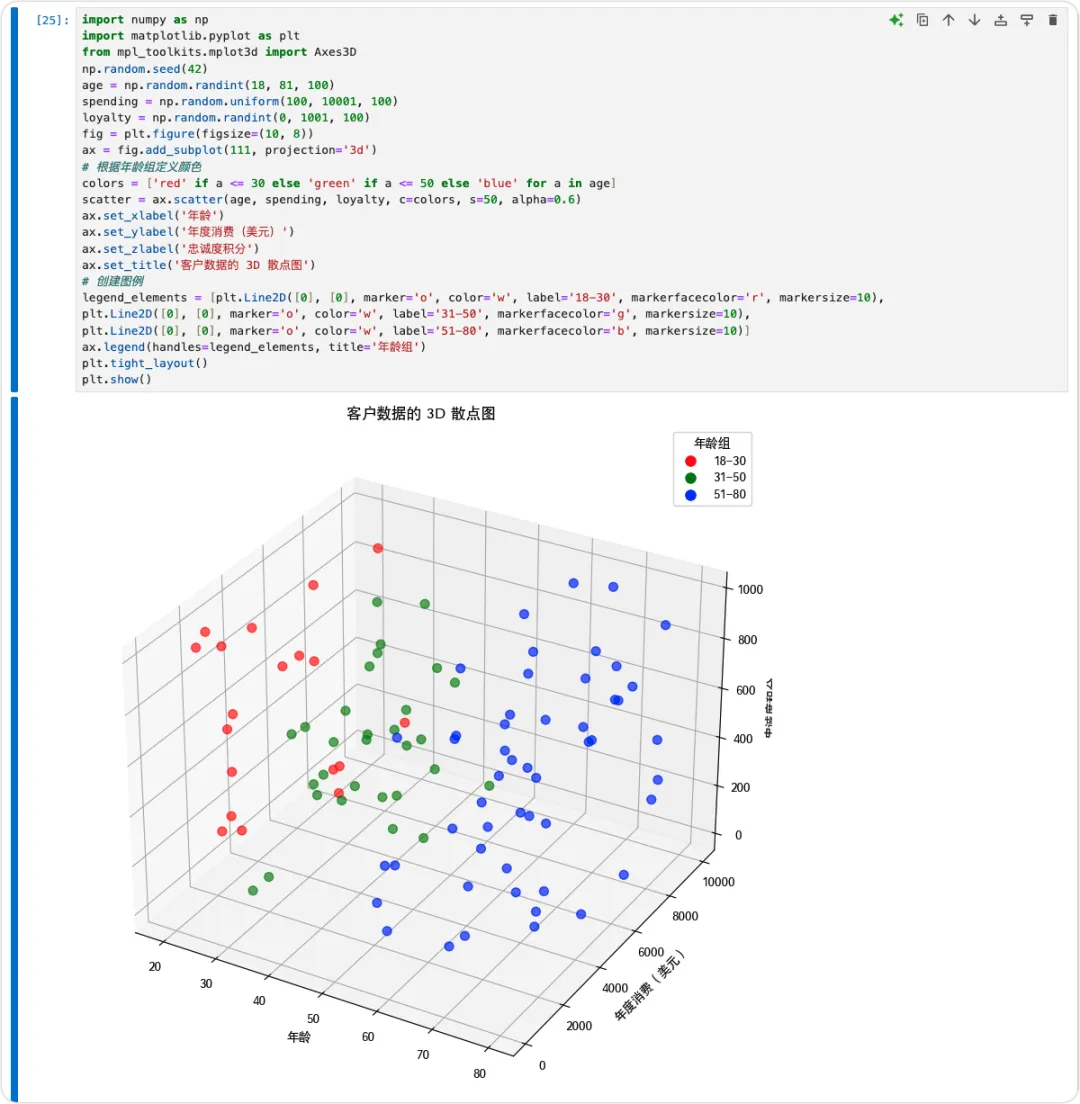
import numpy as np import matplotlib.pyplot as plt from mpl_toolkits.mplot3d import Axes3D np.random.seed(42) age = np.random.randint(18, 81, 100) spending = np.random.uniform(100, 10001, 100) loyalty = np.random.randint(0, 1001, 100) fig = plt.figure(figsize=(10, 8)) ax = fig.add_subplot(111, projection='3d') # 根据年龄组定义颜色colors = ['red' if a <= 30 else 'green' if a <= 50 else 'blue' for a in age] scatter = ax.scatter(age, spending, loyalty, c=colors, s=50, alpha=0.6) ax.set_xlabel('年龄') ax.set_ylabel('年度消费(美元)') ax.set_zlabel('忠诚度积分') ax.set_title('客户数据的 3D 散点图') # 创建图例legend_elements = [plt.Line2D([0], [0], marker='o', color='w', label='18-30', markerfacecolor='r', markersize=10), plt.Line2D([0], [0], marker='o', color='w', label='31-50', markerfacecolor='g', markersize=10), plt.Line2D([0], [0], marker='o', color='w', label='51-80', markerfacecolor='b', markersize=10)] ax.legend(handles=legend_elements, title='年龄组') plt.tight_layout() plt.show()
 10个月宝宝每天需要喝多少奶粉?