Python绘制分组渐变色柱状图
- 2026-10-11 06:14:40
Python绘制分组渐变色柱状图

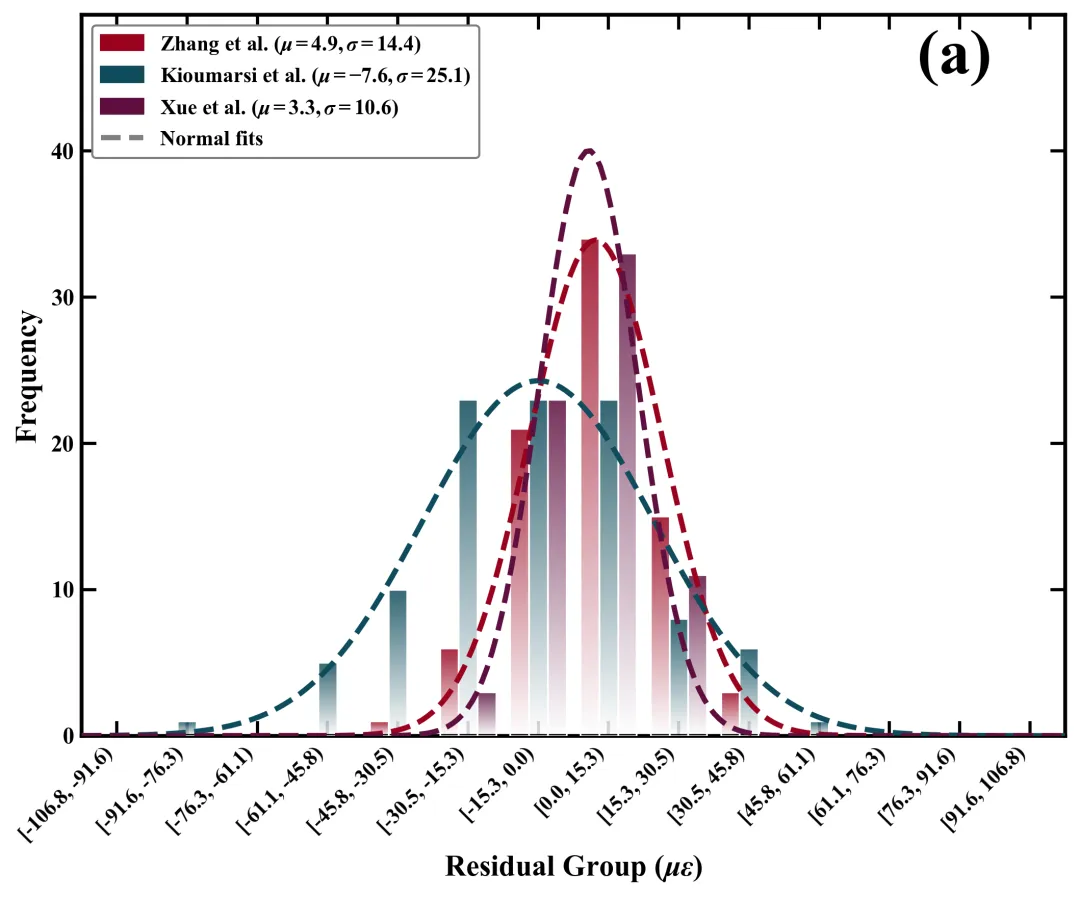
此图用于展示不同分组数据分布情况。横轴代表数据区间分组;纵轴代表频数 ,用于衡量并显示落入对应区间内的具体数据点个数。图上柱子的不同颜色直观展现了三组数据集在不同区间的实际频数分布特征;叠加在直方图上方的三条虚线,则是对应数据集的正态拟合线,左上角的图例标明了不同颜色数据的分组,同时列出了数据的均值和标准差。 结果图 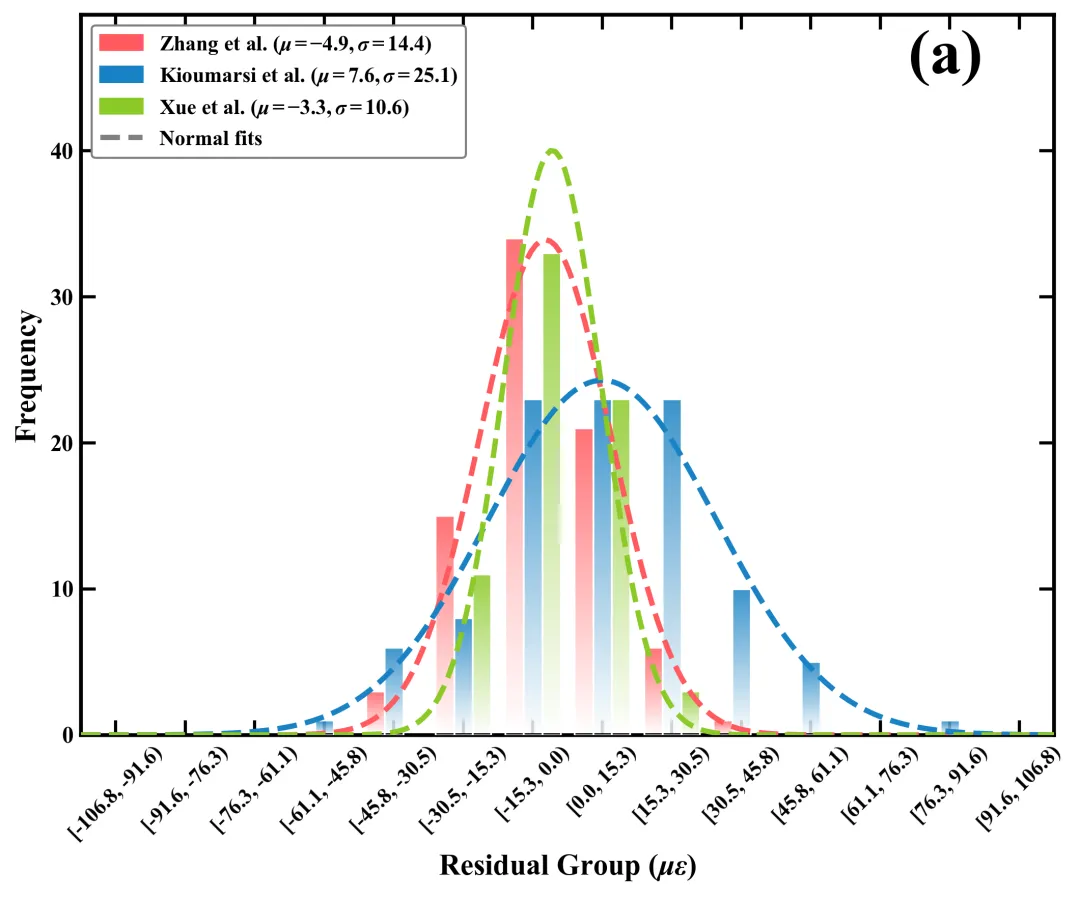
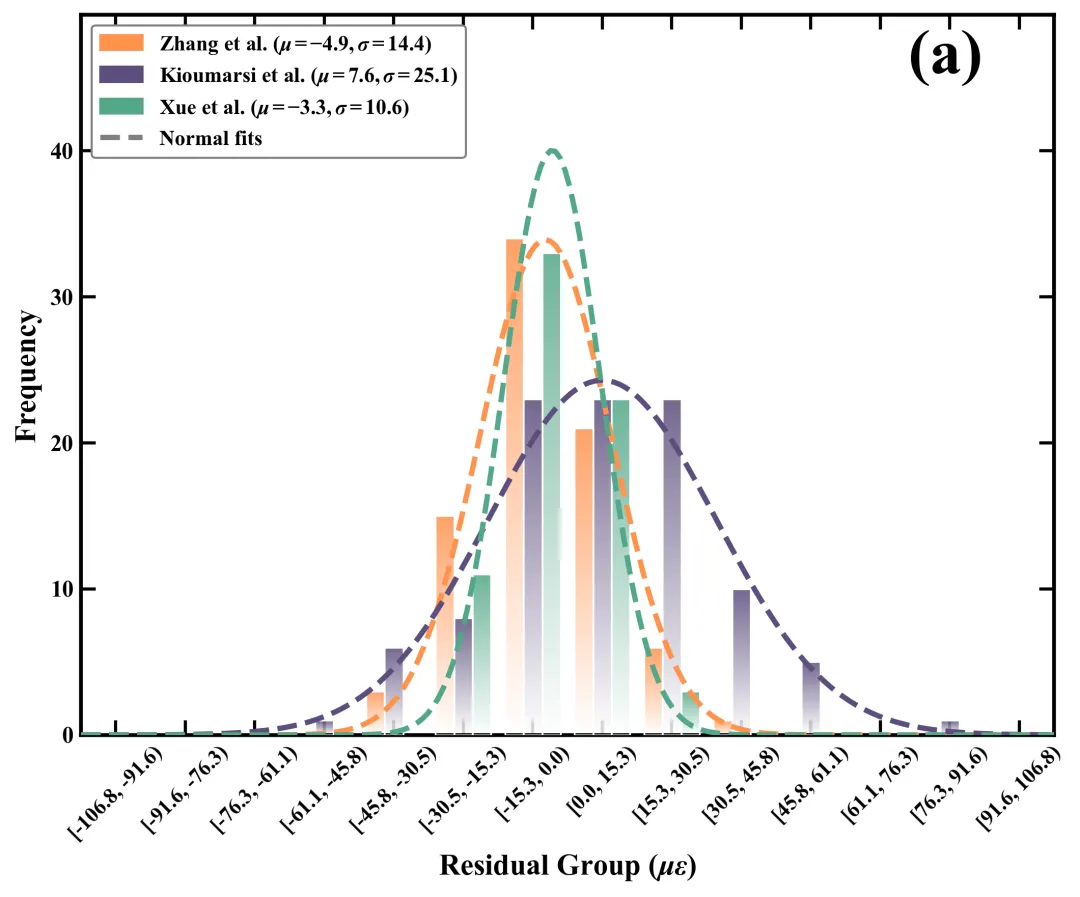
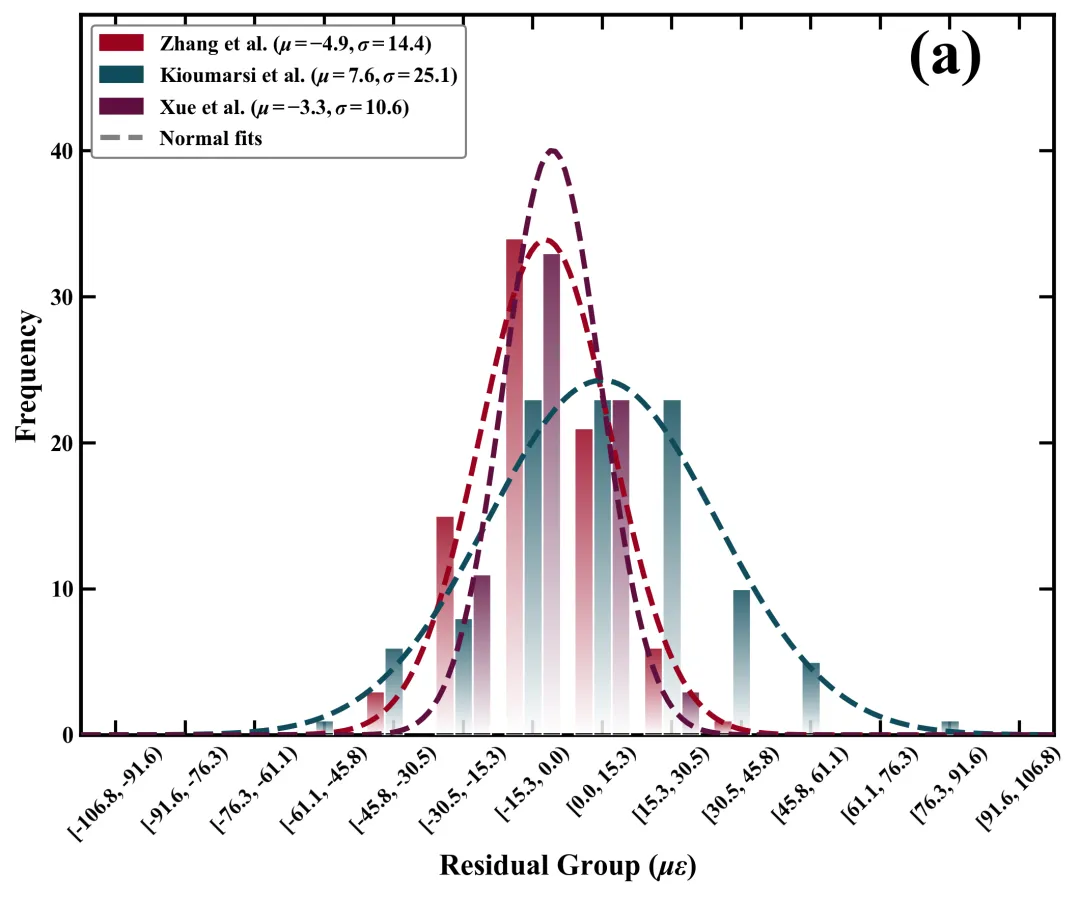
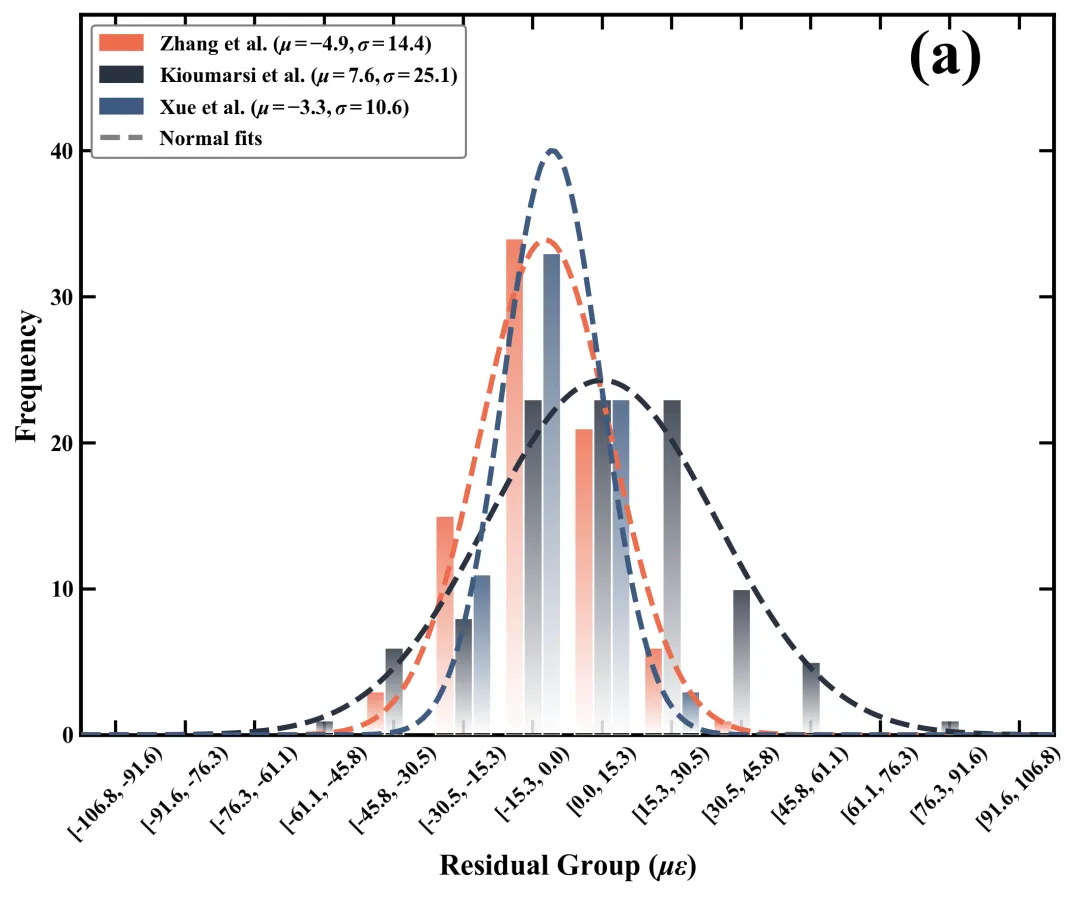
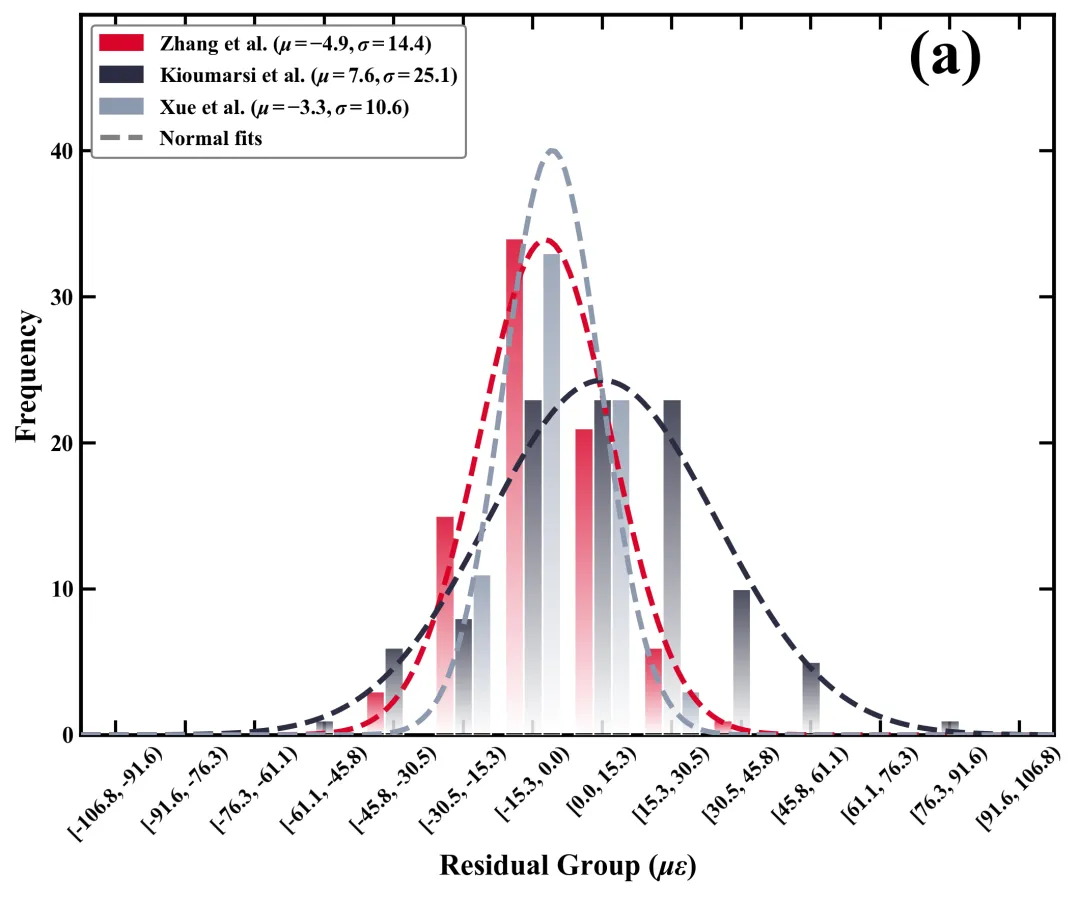
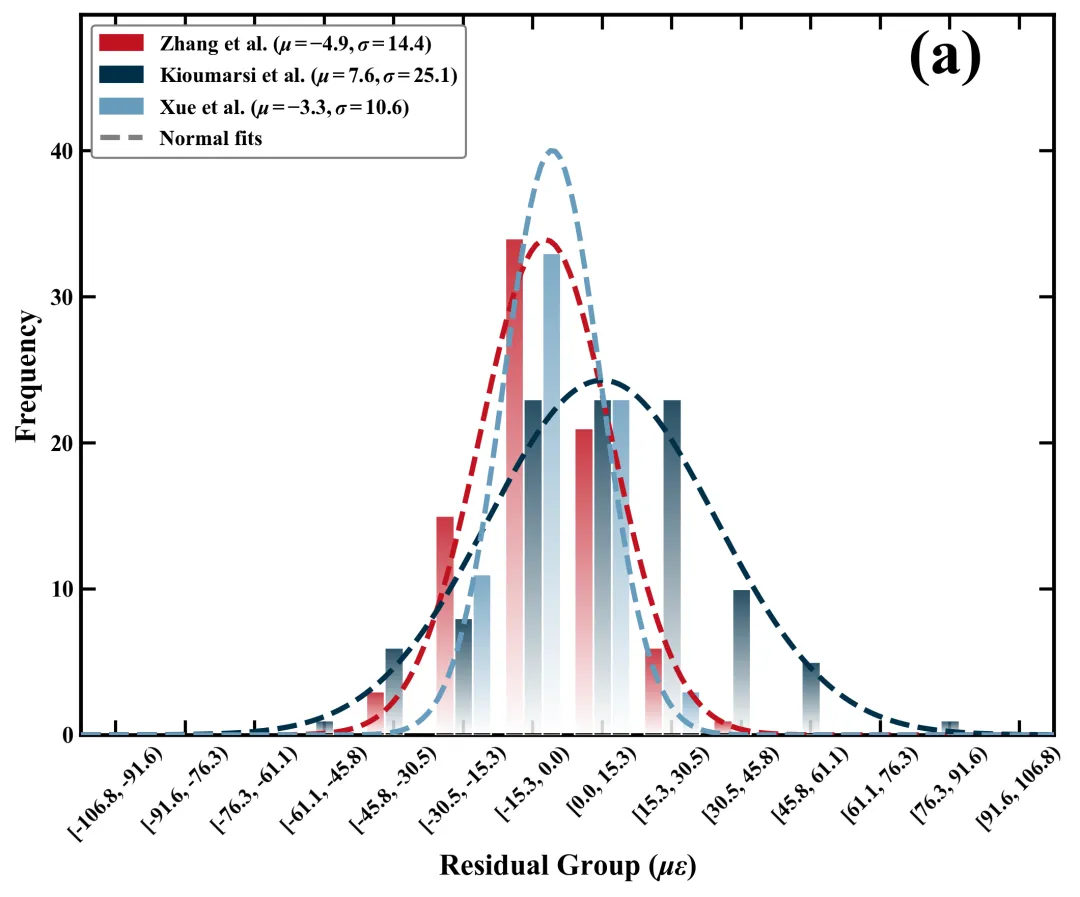
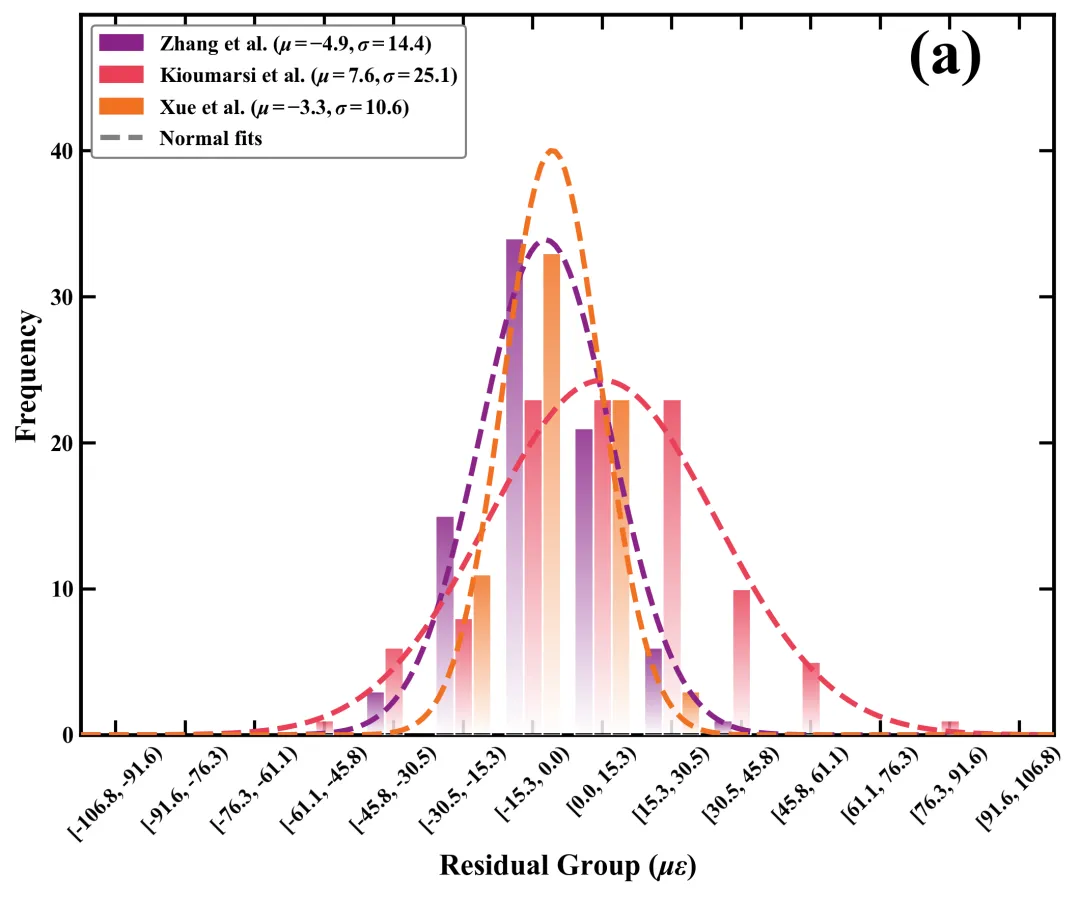
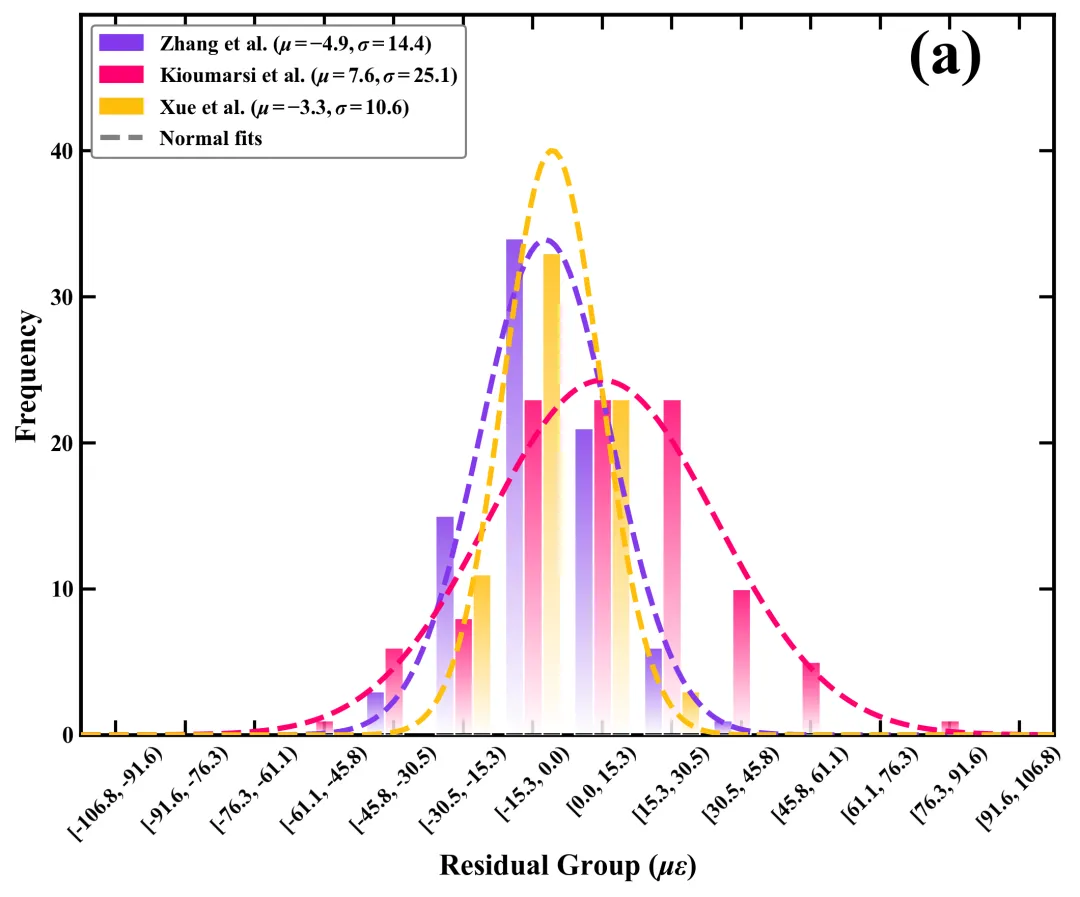
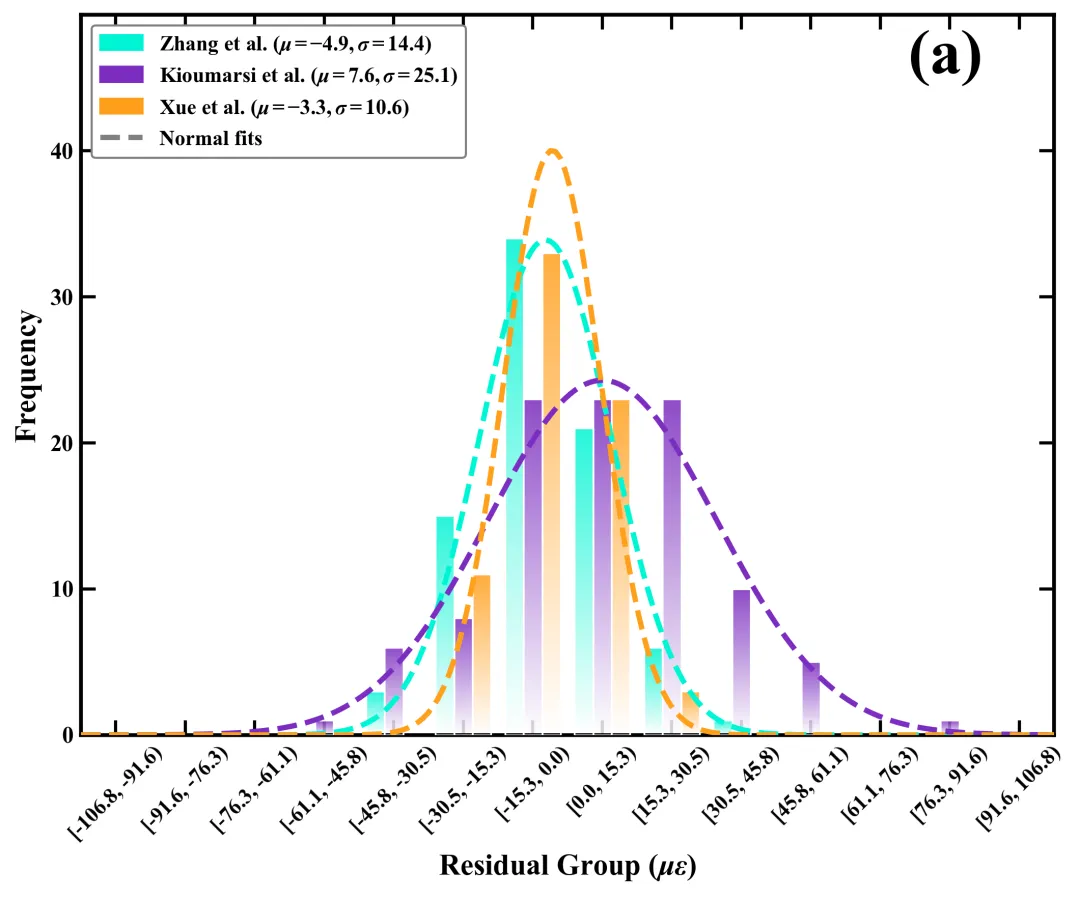
多种配色 



库的导入以及字体设置 

设置颜色库 

绘图函数:数据准备与分组数据提取 

绘图函数:画布创建与基础直方图绘制 

绘图函数:渐变色渲染与正态分布曲线拟合 

绘图函数:坐标轴格式化、图例设置与保存 

执行部分 



期刊图片复现|Python绘制二维偏依赖PDP图 期刊复现|python绘制基于SHAP分析和GAM模型拟合的单特征依赖图 期刊图片复现|python绘制带有渐变颜色shap特征重要性组合图(条形图+蜂巢图) 期刊复现|用Python绘制SHAP特征重要性总览图、依赖图、双特征交互效应SHAP图,解锁XGBoost模型的终极奥秘 期刊图片复现|Python绘制shap重要性蜂巢图+单特征依赖图+交互效应强度气泡图+交互效应依赖图(回归+二分类+分类) 

公众号中的所有所有的免费代码都已经下架了,都并入到付费部分里了,付费合集代码和数据的购买通道已经开通,全部合集150元,无后续收费,目前包含270+篇代码+数据+参考论文,后续将会持续更新,决定购买请后台私信我,注意只会分享练习数据、参考论文和代码文件,仅提供有关代码的答疑,不会提供其他答疑服务,代码文件中已经包含了每行代码的完整注释,购买前请确保真的需要!!!
代码绘制成果展示
代码解释
第一部分
# =========================================================================================# ====================================== 1. 环境设置 =======================================# =========================================================================================import numpy as npimport pandas as pdimport matplotlib.pyplot as pltimport matplotlib.patches as mpatches
第二部分
# =========================================================================================# ======================================2.颜色库=======================================# =========================================================================================COLOR_SCHEMES = {1: ['#E74C3C', '#3B4A6B', '#1C8C85'],}
第三部分
# =========================================================================================# ======================================3.绘图函数=======================================# =========================================================================================def plot_residual_stacked_histogram(df_real, scheme_id):for i, src in enumerate(sources):df_src = df_real[df_real['Source'] == src] #提取数据res_list.append(df_src['Residual'].values) #添加残差colors_list.append(selected_hex_colors[i % len(selected_hex_colors)]) #分配颜色
第四部分
# 创建画布fig, ax = plt.subplots(figsize=(7.2, 6))n, bins_out, patches = ax.hist(res_list, #数据bins=bins, #区间stacked=False, #不堆叠edgecolor='white', #边框颜色linewidth=0.8, #边框线宽rwidth=0.8) #柱状图宽度
第五部分
# 遍历每组柱子for i, container inenumerate(patches):im = ax.imshow(gradient_data, #数据extent=[x0, x0 + w, y0, y0 + h], #设置填充区域aspect='auto', #自动调整纵横比cmap=cmap_gradient, #渐变色origin='lower', #原点alpha=0.85, #透明度zorder=2) #层
第六部分
ax.set_xlim(-res_limit, res_limit) #x轴范围max_height = np.max([np.max(hist_val) for hist_val in n]) #最大高度ax.set_ylim(0, max_height * 1.45) #y轴范围#设置轴刻度标注大小#添加x轴刻度标签ax.set_xticklabels(group_labels, #文本rotation=45, #旋转ha='center', #水平fontsize=10 #大小)
第七部分
# ========================================================================================# ======================================4.执行部分=======================================# =========================================================================================if __name__ == "__main__":excel_input_path = r'data.xlsx'df_real = pd.read_excel(excel_input_path) #读取数据scheme_id = 1print(f'正在绘制并保存方案:{scheme_id}')plot_residual_stacked_histogram(df_real, scheme_id)
如何应用到你自己的数据
1.设置原始数据的保存路径,执行部分:
excel_input_path = r'\data.xlsx'2.设置是否要进行批量绘图,执行部分:
plot_all = True #设置批量绘图3.提取数据,绘图函数部分:
residuals = df_real['Residual'].values4.设置绘图结果的保存地址,绘图函数部分:
plt.savefig(fr'Scheme_{scheme_id}.png', dpi=300,bbox_inches='tight')推荐
获取方式
本文来自网友投稿或网络内容,如有侵犯您的权益请联系我们删除,联系邮箱:596563534@qq.com 。
