基于Python的拉盖尔高斯光束模拟程序
- 2026-06-27 20:58:28
基于Python的拉盖尔高斯光束模拟程序最近准备弃MATLAB转战Python了,先用Qt练练手,写一个拉盖尔高斯光束模型程序1.0练练手。后续准备用Python做光学仿真。在这里做一个记录。 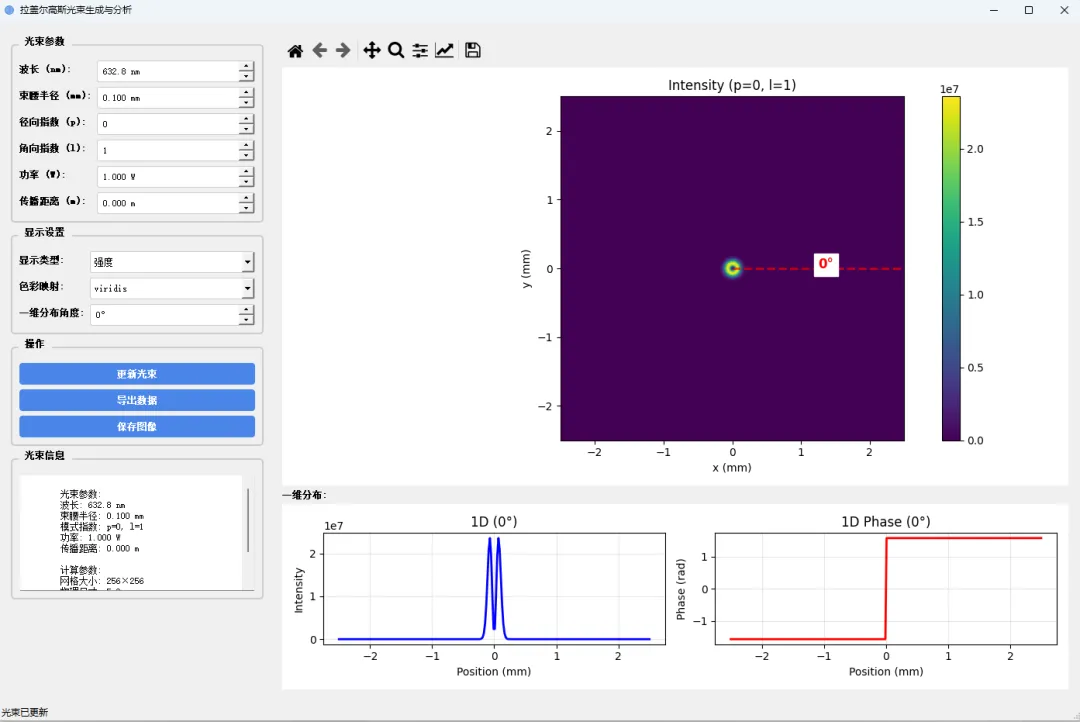
设置拉盖尔高斯光束的波长、束腰半径、径向、角向阶数、功率、距离。 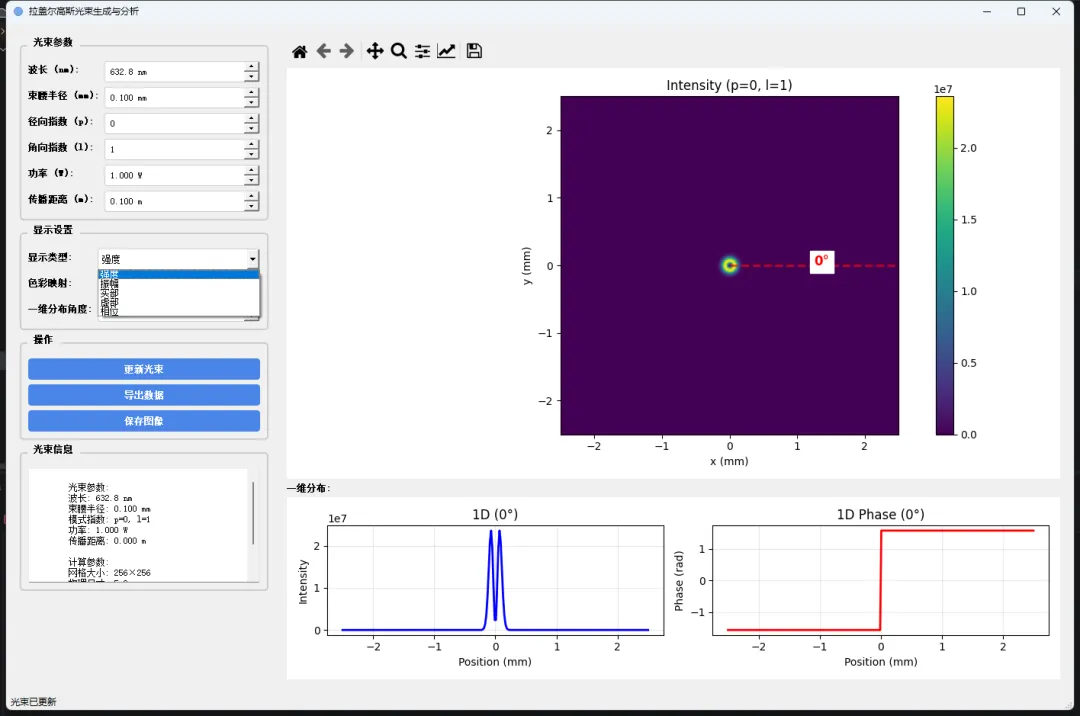
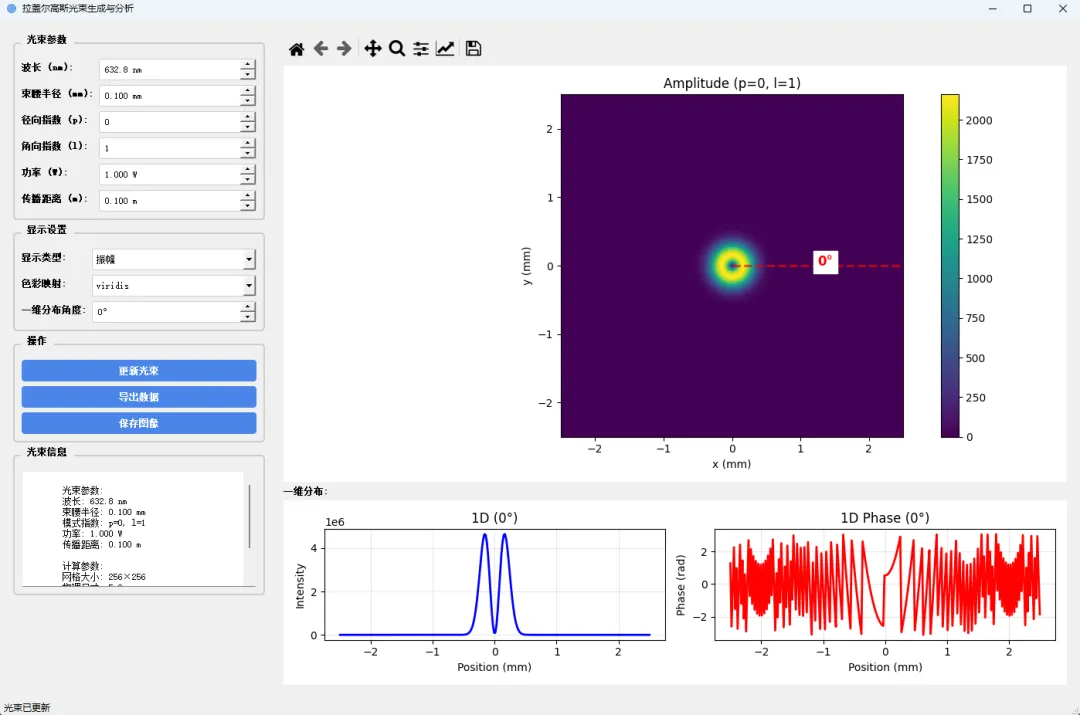
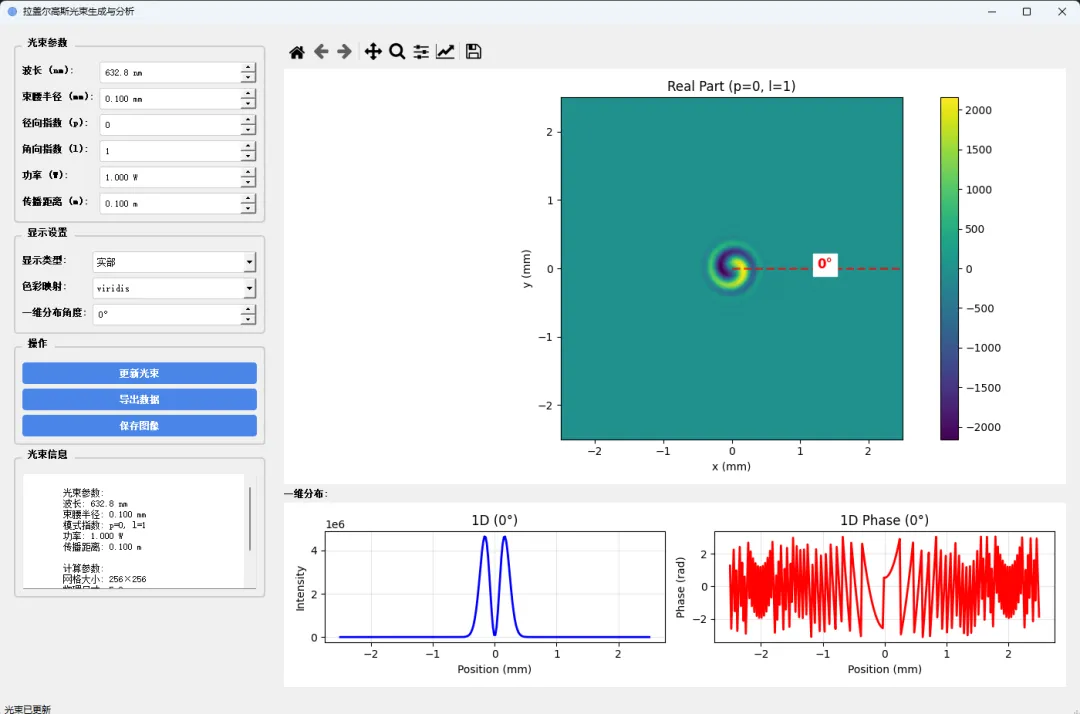
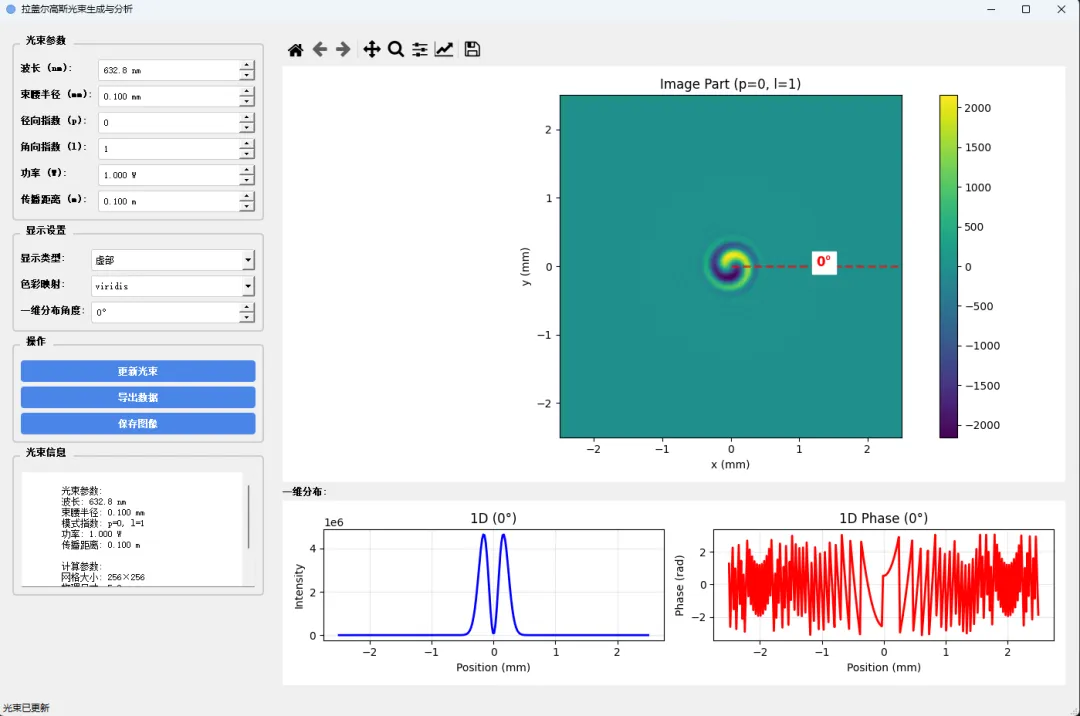
查看实部、虚部、振幅、相位
import sysimport osimport numpy as npfrom scipy.special import eval_genlaguerre, factorialimport matplotlib.pyplot as pltfrom matplotlib.backends.backend_qt5agg import FigureCanvasQTAgg as FigureCanvasfrom matplotlib.backends.backend_qt5agg import NavigationToolbar2QT as NavigationToolbarfrom matplotlib.figure import Figurefrom matplotlib.colors import ListedColormapfrom PyQt5.QtWidgets import *from PyQt5.QtCore import *from PyQt5.QtGui import *import csvimport ctypes# 设置高DPI缩放if hasattr(Qt, 'AA_EnableHighDpiScaling'): QApplication.setAttribute(Qt.AA_EnableHighDpiScaling, True)if hasattr(Qt, 'AA_UseHighDpiPixmaps'): QApplication.setAttribute(Qt.AA_UseHighDpiPixmaps, True)class LaguerreGaussianBeam:"""拉盖尔高斯光束计算类"""def __init__(self, grid_size=256, physical_size=5e-3):self.grid_size = grid_sizeself.physical_size = physical_size# 默认参数self.wavelength = 632.8e-9 # 波长 (m)self.w0 = 1e-3 # 束腰半径 (m)self.p = 0 # 径向模式指数self.l = 1 # 角向模式指数self.power = 1.0 # 功率 (W)self.z = 0.0 # 传播距离 (m) # 计算网格self.x = np.linspace(-physical_size / 2, physical_size / 2, grid_size)self.y = np.linspace(-physical_size / 2, physical_size / 2, grid_size)self.X, self.Y = np.meshgrid(self.x, self.y)# 转换为极坐标self.r = np.sqrt(self.X ** 2 + self.Y ** 2)self.phi = np.arctan2(self.Y, self.X)# 计算光束self.compute_beam()def compute_beam(self):"""计算拉盖尔高斯光束"""# 计算瑞利距离z_r = np.pi * self.w0 ** 2 / self.wavelength# 计算z处的束腰半径w_z = self.w0 * np.sqrt(1 + (self.z / z_r) ** 2)# 计算波前曲率半径R_z = self.z * (1 + (z_r / self.z) ** 2) if self.z != 0 else float('inf')# 计算古依相位gouy_phase = (2 * self.p + abs(self.l) + 1) * np.arctan(self.z / z_r)# 计算拉盖尔高斯模式的振幅# 归一化因子norm_factor = np.sqrt(2 * factorial(self.p) / (np.pi * factorial(self.p + abs(self.l))))# 径向部分rho = np.sqrt(2) * self.r / w_z radial_part = (rho ** abs(self.l)) * eval_genlaguerre(self.p, abs(self.l), rho ** 2)# 角向部分angular_part = np.exp(1j * self.l * self.phi)# 高斯包络gaussian_envelope = np.exp(-self.r ** 2 / w_z ** 2)# 相位项phase_term = np.exp(1j * (2 * np.pi / self.wavelength) * self.r ** 2 / (2 * R_z))# 总相位total_phase = np.exp(-1j * (2 * np.pi / self.wavelength) * self.z) * np.exp(-1j * gouy_phase)# 完整的光场self.field = (norm_factor * (1 / w_z) * radial_part * angular_part * gaussian_envelope * phase_term * total_phase)# 根据功率归一化self.normalize_power()# 计算各种表示self.compute_representations()def normalize_power(self):"""根据设定功率归一化光场"""# 计算当前功率intensity = np.abs(self.field) ** 2current_power = np.sum(intensity) * (self.physical_size / self.grid_size) ** 2if current_power > 0:# 归一化系数norm_factor = np.sqrt(self.power / current_power)self.field *= norm_factordef compute_representations(self):"""计算各种表示(实部、虚部、振幅、强度、相位)"""self.real_part = np.real(self.field)self.imag_part = np.imag(self.field)self.amplitude = np.abs(self.field)self.intensity = self.amplitude ** 2self.phase = np.angle(self.field)# 为了显示,将相位包装在[-π, π]之间self.phase_wrapped = np.angle(np.exp(1j * self.phase))def set_parameters(self, wavelength, w0, p, l, power, z):"""设置光束参数"""self.wavelength = wavelengthself.w0 = w0self.p = pself.l = lself.power = powerself.z = zself.compute_beam()def get_1d_intensity_profile(self, angle=0):"""获取一维强度分布 Args: angle: 角度 (度) Returns: x_vals: x坐标 intensity_vals: 强度值 """# 将角度转换为弧度theta = np.deg2rad(angle)# 计算沿着指定方向的线x_line = np.linspace(-self.physical_size / 2, self.physical_size / 2, self.grid_size) y_line = x_line * np.tan(theta)# 插值获取强度值from scipy.interpolate import RegularGridInterpolator interp_func = RegularGridInterpolator((self.x, self.y), self.intensity)# 创建插值点points = np.column_stack((x_line, y_line))# 确保点在范围内mask = (np.abs(x_line) <= self.physical_size / 2) & (np.abs(y_line) <= self.physical_size / 2) intensity_vals = np.zeros_like(x_line) intensity_vals[mask] = interp_func(points[mask])return x_line, intensity_valsdef get_1d_phase_profile(self, angle=0):"""获取一维相位分布 Args: angle: 角度 (度) Returns: x_vals: x坐标 phase_vals: 相位值 """# 将角度转换为弧度theta = np.deg2rad(angle)# 计算沿着指定方向的线x_line = np.linspace(-self.physical_size / 2, self.physical_size / 2, self.grid_size) y_line = x_line * np.tan(theta)# 插值获取相位值from scipy.interpolate import RegularGridInterpolator interp_func = RegularGridInterpolator((self.x, self.y), self.phase_wrapped)# 创建插值点points = np.column_stack((x_line, y_line))# 确保点在范围内mask = (np.abs(x_line) <= self.physical_size / 2) & (np.abs(y_line) <= self.physical_size / 2) phase_vals = np.zeros_like(x_line) phase_vals[mask] = interp_func(points[mask])return x_line, phase_valsclass LGBeamApp(QMainWindow):"""主应用程序窗口"""def __init__(self):super().__init__()# 初始化光束self.beam = LaguerreGaussianBeam()# 初始化UIself.init_ui()# 更新显示self.update_display()def init_ui(self):"""初始化用户界面"""self.setWindowTitle("拉盖尔高斯光束生成与分析")self.setGeometry(100, 100, 1400, 900)# 设置图标self.setWindowIcon(self.create_icon())# 创建中央部件central_widget = QWidget()self.setCentralWidget(central_widget)# 主布局main_layout = QHBoxLayout() central_widget.setLayout(main_layout)# 左侧控制面板control_panel = self.create_control_panel() main_layout.addWidget(control_panel, 1)# 右侧显示区域display_area = self.create_display_area() main_layout.addWidget(display_area, 3)# 创建状态栏self.statusBar().showMessage("就绪")# 设置样式self.setStyleSheet(""" QMainWindow { background-color: #f0f0f0; } QGroupBox { font-weight: bold; border: 2px solid #cccccc; border-radius: 5px; margin-top: 10px; padding-top: 10px; } QGroupBox::title { subcontrol-origin: margin; left: 10px; padding: 0 5px 0 5px; } QPushButton { background-color: #4a86e8; color: white; border: none; padding: 8px; border-radius: 4px; font-weight: bold; } QPushButton:hover { background-color: #3a76d8; } QPushButton:pressed { background-color: #2a66c8; } QLabel { font-weight: bold; } QSpinBox, QDoubleSpinBox, QComboBox { padding: 5px; border: 1px solid #cccccc; border-radius: 3px; } """)def create_icon(self):"""创建应用程序图标"""# 创建一个简单的光束图标pixmap = QPixmap(64, 64) pixmap.fill(Qt.transparent) painter = QPainter(pixmap) painter.setRenderHint(QPainter.Antialiasing)# 绘制光束图标painter.setPen(QPen(QColor(70, 130, 180), 3)) painter.setBrush(QBrush(QColor(100, 149, 237, 200))) painter.drawEllipse(10, 10, 44, 44)# 绘制光束中心painter.setPen(QPen(QColor(30, 144, 255), 2)) painter.drawLine(32, 16, 32, 48)# 绘制螺旋效果for i in range(3): angle = i * 120x = 32 + 20 * np.cos(np.radians(angle)) y = 32 + 20 * np.sin(np.radians(angle)) painter.drawEllipse(int(x) - 2, int(y) - 2, 4, 4) painter.end()return QIcon(pixmap)def create_control_panel(self):"""创建控制面板"""panel = QWidget() layout = QVBoxLayout() panel.setLayout(layout)# 光束参数组params_group = QGroupBox("光束参数") params_layout = QFormLayout()# 波长self.wavelength_spin = QDoubleSpinBox()self.wavelength_spin.setRange(400, 1000)self.wavelength_spin.setValue(632.8)self.wavelength_spin.setSingleStep(10)self.wavelength_spin.setDecimals(1)self.wavelength_spin.setSuffix(" nm")self.wavelength_spin.setProperty("value_in_meters", 632.8) params_layout.addRow("波长 (nm):", self.wavelength_spin)# 束腰半径self.w0_spin = QDoubleSpinBox()self.w0_spin.setRange(0.1, 5)self.w0_spin.setValue(1e-1)self.w0_spin.setSingleStep(0.1e-1)self.w0_spin.setDecimals(3)self.w0_spin.setSuffix(" mm")self.w0_spin.setProperty("value_in_meters", 1e-1) params_layout.addRow("束腰半径 (mm):", self.w0_spin)# 径向模式指数 pself.p_spin = QSpinBox()self.p_spin.setRange(0, 10)self.p_spin.setValue(0) params_layout.addRow("径向指数 (p):", self.p_spin)# 角向模式指数 lself.l_spin = QSpinBox()self.l_spin.setRange(-10, 10)self.l_spin.setValue(1) params_layout.addRow("角向指数 (l):", self.l_spin)# 功率self.power_spin = QDoubleSpinBox()self.power_spin.setRange(0.001, 10.0)self.power_spin.setValue(1.0)self.power_spin.setSingleStep(0.1)self.power_spin.setDecimals(3)self.power_spin.setSuffix(" W") params_layout.addRow("功率 (W):", self.power_spin)# 传播距离self.z_spin = QDoubleSpinBox()self.z_spin.setRange(0.0, 1.0)self.z_spin.setValue(0.0)self.z_spin.setSingleStep(0.01)self.z_spin.setDecimals(3)self.z_spin.setSuffix(" m") params_layout.addRow("传播距离 (m):", self.z_spin) params_group.setLayout(params_layout) layout.addWidget(params_group)# 显示设置组display_group = QGroupBox("显示设置") display_layout = QFormLayout()# 显示类型self.display_type_combo = QComboBox()self.display_type_combo.addItems(["强度", "振幅", "实部", "虚部", "相位"]) display_layout.addRow("显示类型:", self.display_type_combo)# 色彩映射self.colormap_combo = QComboBox() colormaps = ['viridis', 'plasma', 'inferno', 'magma', 'cividis','spring', 'summer', 'autumn', 'winter', 'cool','hot', 'bone', 'gray', 'jet', 'rainbow']self.colormap_combo.addItems(colormaps)self.colormap_combo.setCurrentText('viridis') display_layout.addRow("色彩映射:", self.colormap_combo)# 一维分布角度self.angle_spin = QSpinBox()self.angle_spin.setRange(0, 360)self.angle_spin.setValue(0)self.angle_spin.setSuffix("°") display_layout.addRow("一维分布角度:", self.angle_spin) display_group.setLayout(display_layout) layout.addWidget(display_group)# 按钮组button_group = QGroupBox("操作") button_layout = QVBoxLayout()# 更新按钮self.update_btn = QPushButton("更新光束")self.update_btn.clicked.connect(self.update_beam) button_layout.addWidget(self.update_btn)# 导出按钮self.export_btn = QPushButton("导出数据")self.export_btn.clicked.connect(self.export_data) button_layout.addWidget(self.export_btn)# 保存图像按钮self.save_image_btn = QPushButton("保存图像")self.save_image_btn.clicked.connect(self.save_image) button_layout.addWidget(self.save_image_btn) button_group.setLayout(button_layout) layout.addWidget(button_group)# 信息面板info_group = QGroupBox("光束信息") info_layout = QVBoxLayout()self.info_text = QTextEdit()self.info_text.setReadOnly(True)self.info_text.setMaximumHeight(150) info_layout.addWidget(self.info_text) info_group.setLayout(info_layout) layout.addWidget(info_group)# 添加弹性空间layout.addStretch()return paneldef create_display_area(self):"""创建显示区域"""area = QWidget() layout = QVBoxLayout() area.setLayout(layout)# 创建Matplotlib图形self.figure = Figure(figsize=(8, 6), dpi=100)self.canvas = FigureCanvas(self.figure)# 添加导航工具栏self.toolbar = NavigationToolbar(self.canvas, self) layout.addWidget(self.toolbar) layout.addWidget(self.canvas)# 一维分布标签layout.addWidget(QLabel("一维分布:"))# 一维分布图形self.figure_1d = Figure(figsize=(8, 3), dpi=100)self.canvas_1d = FigureCanvas(self.figure_1d) layout.addWidget(self.canvas_1d)return areadef update_beam(self):"""更新光束参数并重新计算"""try:# 获取参数值wavelength = self.wavelength_spin.property("value_in_meters")#if wavelength is None:wavelength = self.wavelength_spin.value() * 1e-9w0 = self.w0_spin.property("value_in_meters")#if w0 is None:w0 = self.w0_spin.value() * 1e-3p = self.p_spin.value() l = self.l_spin.value() power = self.power_spin.value() z = self.z_spin.value()# 更新光束self.beam.set_parameters(wavelength, w0, p, l, power, z)# 更新显示self.update_display()# 更新信息self.update_info()self.statusBar().showMessage("光束已更新")except Exception as e: QMessageBox.critical(self, "错误", f"更新光束时出错: {str(e)}")def update_display(self):"""更新显示"""# 清除图形self.figure.clear()self.figure_1d.clear()# 获取显示类型display_type = self.display_type_combo.currentText()# 根据显示类型选择数据if display_type == "强度": data = self.beam.intensity title = "Intensity"cmap = self.colormap_combo.currentText()elif display_type == "振幅": data = self.beam.amplitude title = "Amplitude"cmap = self.colormap_combo.currentText()elif display_type == "实部": data = self.beam.real_part title = "Real Part"cmap = self.colormap_combo.currentText()elif display_type == "虚部": data = self.beam.imag_part title = "Image Part"cmap = self.colormap_combo.currentText()elif display_type == "相位": data = self.beam.phase_wrapped title = "Phase"cmap = self.colormap_combo.currentText()# 创建2D图像ax1 = self.figure.add_subplot(111)# 显示图像im = ax1.imshow(data, extent=[-self.beam.physical_size / 2 * 1000,self.beam.physical_size / 2 * 1000, -self.beam.physical_size / 2 * 1000,self.beam.physical_size / 2 * 1000],cmap=cmap, origin='lower') ax1.set_xlabel('x (mm)') ax1.set_ylabel('y (mm)') ax1.set_title(f"{title} (p={self.beam.p}, l={self.beam.l})")# 添加颜色条cbar = self.figure.colorbar(im, ax=ax1)# 添加角度线angle = self.angle_spin.value()if angle < 360: theta = np.deg2rad(angle) max_r = self.beam.physical_size / 2 * 1000 # 转换为mmx_end = max_r * np.cos(theta) y_end = max_r * np.sin(theta) ax1.plot([0, x_end], [0, y_end], 'r--', linewidth=2, alpha=0.7) ax1.text(x_end / 2, y_end / 2, f'{angle}°', color='red',fontsize=12, fontweight='bold', backgroundcolor='white')self.figure.tight_layout()# 创建一维分布图ax2 = self.figure_1d.add_subplot(121) ax3 = self.figure_1d.add_subplot(122)# 获取一维分布数据x_intensity, intensity_vals = self.beam.get_1d_intensity_profile(angle) x_phase, phase_vals = self.beam.get_1d_phase_profile(angle)# 绘制强度分布ax2.plot(x_intensity * 1000, intensity_vals, 'b-', linewidth=2) ax2.set_xlabel('Position (mm)') ax2.set_ylabel('Intensity') ax2.set_title(f'1D ({angle}°)') ax2.grid(True, alpha=0.3)# 绘制相位分布ax3.plot(x_phase * 1000, phase_vals, 'r-', linewidth=2) ax3.set_xlabel('Position (mm)') ax3.set_ylabel('Phase (rad)') ax3.set_title(f'1D Phase ({angle}°)') ax3.grid(True, alpha=0.3)self.figure_1d.tight_layout()# 刷新画布self.canvas.draw()self.canvas_1d.draw()def update_info(self):"""更新光束信息"""info_text = f"""光束参数:波长: {self.beam.wavelength * 1e9:.1f} nm束腰半径: {self.beam.w0 * 1000:.3f} mm模式指数: p={self.beam.p}, l={self.beam.l}功率: {self.beam.power:.3f} W传播距离: {self.beam.z:.3f} m计算参数:网格大小: {self.beam.grid_size}×{self.beam.grid_size}物理尺寸: {self.beam.physical_size * 1000:.1f} mm瑞利距离: {np.pi * self.beam.w0 ** 2 / self.beam.wavelength:.3f} m """self.info_text.setText(info_text)def export_data(self):"""导出数据"""try:# 选择保存位置options = QFileDialog.Options() file_path, _ = QFileDialog.getSaveFileName(self, "导出数据", "", "CSV文件 (*.csv);;所有文件 (*)", options=options )if file_path:# 获取显示类型display_type = self.display_type_combo.currentText()# 根据显示类型选择数据if display_type == "强度": data = self.beam.intensity data_name = "intensity"elif display_type == "振幅": data = self.beam.amplitude data_name = "amplitude"elif display_type == "实部": data = self.beam.real_part data_name = "real_part"elif display_type == "虚部": data = self.beam.imag_part data_name = "imaginary_part"elif display_type == "相位": data = self.beam.phase_wrapped data_name = "phase"# 保存数据with open(file_path, 'w', newline='') as csvfile: writer = csv.writer(csvfile)# 写入标题行writer.writerow([f"拉盖尔高斯光束数据 - {data_name}"]) writer.writerow([f"波长: {self.beam.wavelength * 1e9:.1f} nm"]) writer.writerow([f"束腰半径: {self.beam.w0 * 1000:.3f} mm"]) writer.writerow([f"模式指数: p={self.beam.p}, l={self.beam.l}"]) writer.writerow([f"功率: {self.beam.power:.3f} W"]) writer.writerow([])# 写入数据writer.writerow(["X坐标(mm)", "Y坐标(mm)", data_name])# 将数据展平并写入x_coords = self.beam.X.flatten() * 1000 # 转换为mmy_coords = self.beam.Y.flatten() * 1000 # 转换为mmdata_flat = data.flatten()for x, y, val in zip(x_coords, y_coords, data_flat): writer.writerow([f"{x:.6f}", f"{y:.6f}", f"{val:.6e}"])self.statusBar().showMessage(f"数据已导出到: {file_path}") QMessageBox.information(self, "成功", f"数据已成功导出到:\n{file_path}")except Exception as e: QMessageBox.critical(self, "错误", f"导出数据时出错: {str(e)}")def save_image(self):"""保存图像"""try:# 选择保存位置options = QFileDialog.Options() file_path, _ = QFileDialog.getSaveFileName(self, "保存图像", "", "PNG文件 (*.png);;PDF文件 (*.pdf);;所有文件 (*)", options=options )if file_path:# 获取文件扩展名ext = os.path.splitext(file_path)[1].lower()if ext in ['.png', '.pdf', '.jpg', '.jpeg', '.tif', '.tiff']:# 保存主图像self.figure.savefig(file_path, dpi=300, bbox_inches='tight')# 保存一维分布图base_name, ext_name = os.path.splitext(file_path) file_1d = f"{base_name}_1d{ext_name}"self.figure_1d.savefig(file_1d, dpi=300, bbox_inches='tight')self.statusBar().showMessage(f"图像已保存到: {file_path}") QMessageBox.information(self, "成功", f"图像已保存到:\n{file_path}\n一维分布图:\n{file_1d}")else: QMessageBox.warning(self, "警告",f"不支持的文件格式: {ext}\n请使用 .png, .pdf, .jpg, .jpeg, .tif 或 .tiff")except Exception as e: QMessageBox.critical(self, "错误", f"保存图像时出错: {str(e)}")def main():"""主函数"""app = QApplication(sys.argv)# 设置应用程序ID(Windows任务栏图标)if sys.platform == "win32": app_id = 'lg.beam.app.1.0'ctypes.windll.shell32.SetCurrentProcessExplicitAppUserModelID(app_id)# 创建并显示主窗口window = LGBeamApp() window.show() sys.exit(app.exec_())if __name__ == "__main__": main()
本文来自网友投稿或网络内容,如有侵犯您的权益请联系我们删除,联系邮箱:wyl860211@qq.com 。

