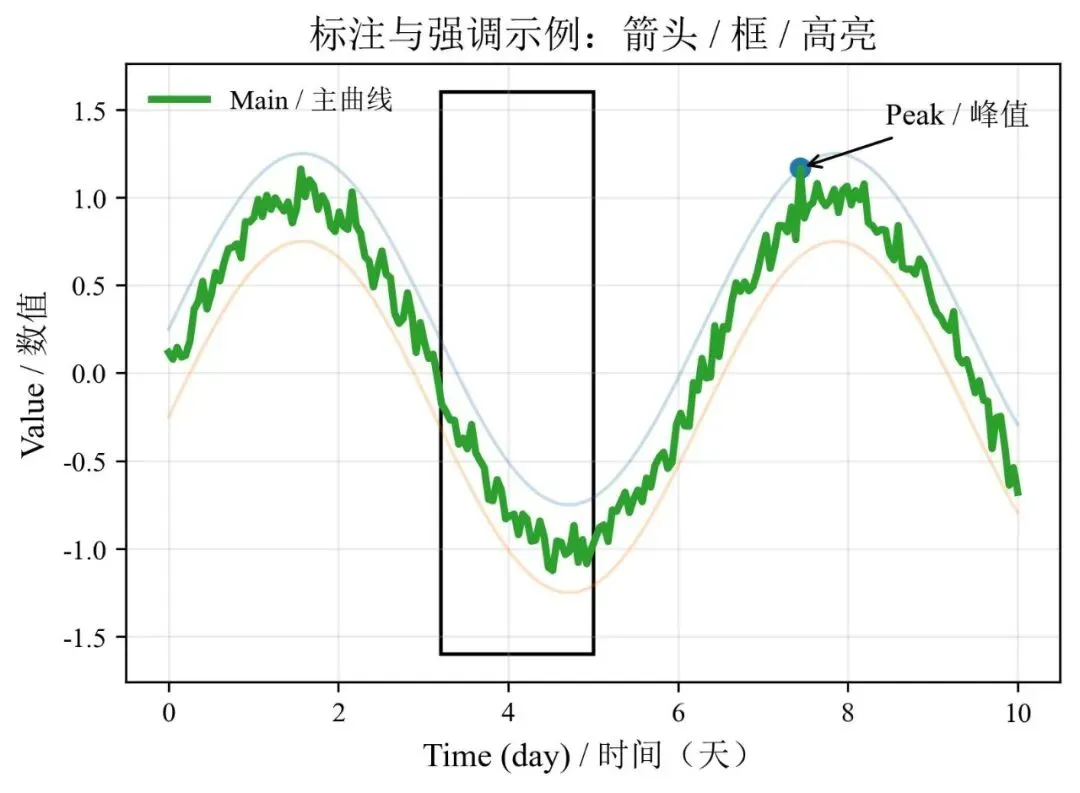
import osimport numpy as npimport matplotlib as mplimport matplotlib.pyplot as pltfrom matplotlib import font_manager as fmfrom matplotlib.patches import Rectangle# == 字体 ==fm.fontManager.addfont(r"C:\Windows\Fonts\times.ttf")fm.fontManager.addfont(r"C:\Windows\Fonts\simsun.ttc")mpl.rcParams["font.family"] = ["Times New Roman", "SimSun"]mpl.rcParams["axes.unicode_minus"] = FalseOUT_DIR = r"D:\py_figs"os.makedirs(OUT_DIR, exist_ok=True)# == 数据 ==x = np.linspace(0, 10, 200)y_main = np.sin(x) + 0.08 * np.random.randn(len(x))y_bg1 = np.sin(x) + 0.25 y_bg2 = np.sin(x) - 0.25fig, ax = plt.subplots(figsize=(6, 4))# == 1) 背景曲线淡化 ==ax.plot(x, y_bg1, linewidth=1.2, alpha=0.25, label="_nolegend_")ax.plot(x, y_bg2, linewidth=1.2, alpha=0.25, label="_nolegend_")# == 2) 主曲线高a高亮 ==ax.plot(x, y_main, linewidth=2.6, label="Main / 主曲线")# == 3) 框:圈出关注区间(空心框更稳)==x1, x2 = 3.2, 5.0ymin, ymax = -1.6, 1.6rect = Rectangle((x1, ymin), x2 - x1, ymax - ymin, fill=False, linewidth=1.3)ax.add_patch(rect)# == 4) 箭头:标注关键点(峰值)==idx = np.argmax(y_main)xp, yp = x[idx], y_main[idx]ax.scatter([xp], [yp], s=45)ax.annotate("Peak/ 峰值", xy=(xp, yp), xytext=(xp + 1.0, yp + 0.25), arrowprops=dict(arrowstyle="->", lw=1.0), fontsize=11,)# == 基础排版 ==ax.set_title("标注与强调示例:箭头 / 框 / 高亮", fontsize=14)ax.set_xlabel("Time (day) / 时间(天)", fontsize=12)ax.set_ylabel("Value / 数值", fontsize=12)ax.grid(alpha=0.25)ax.legend(frameon=False, loc="upper left")fig.savefig(os.path.join(OUT_DIR, "annotate_highlight_demo.jpg"), dpi=300, bbox_inches="tight")plt.close(fig)
 10个月宝宝每天需要喝多少奶粉?
