Python卡通风格套图(3):多模型对比验证与卡通风格混淆矩阵图
- 2026-06-24 12:06:48
Python卡通风格套图(3):多模型对比验证与卡通风格混淆矩阵图

模型绘制结果 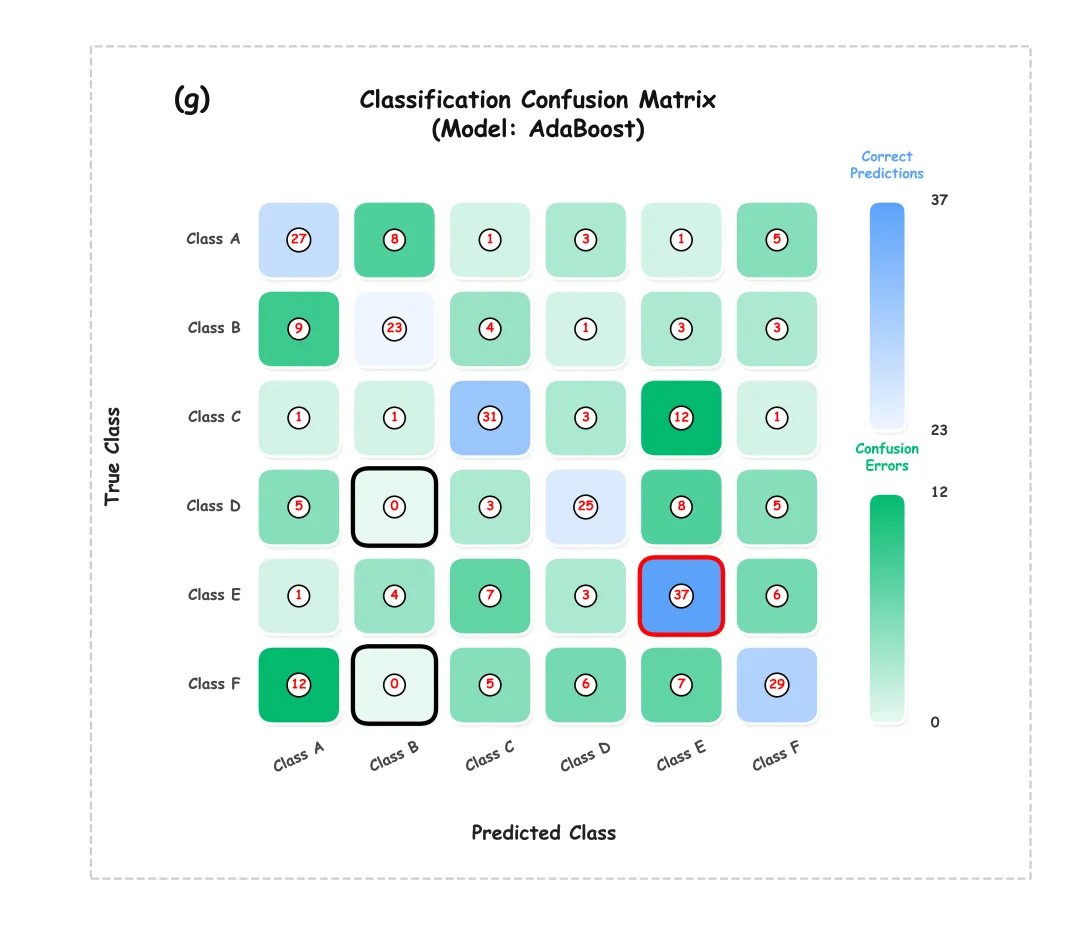
多种配色 

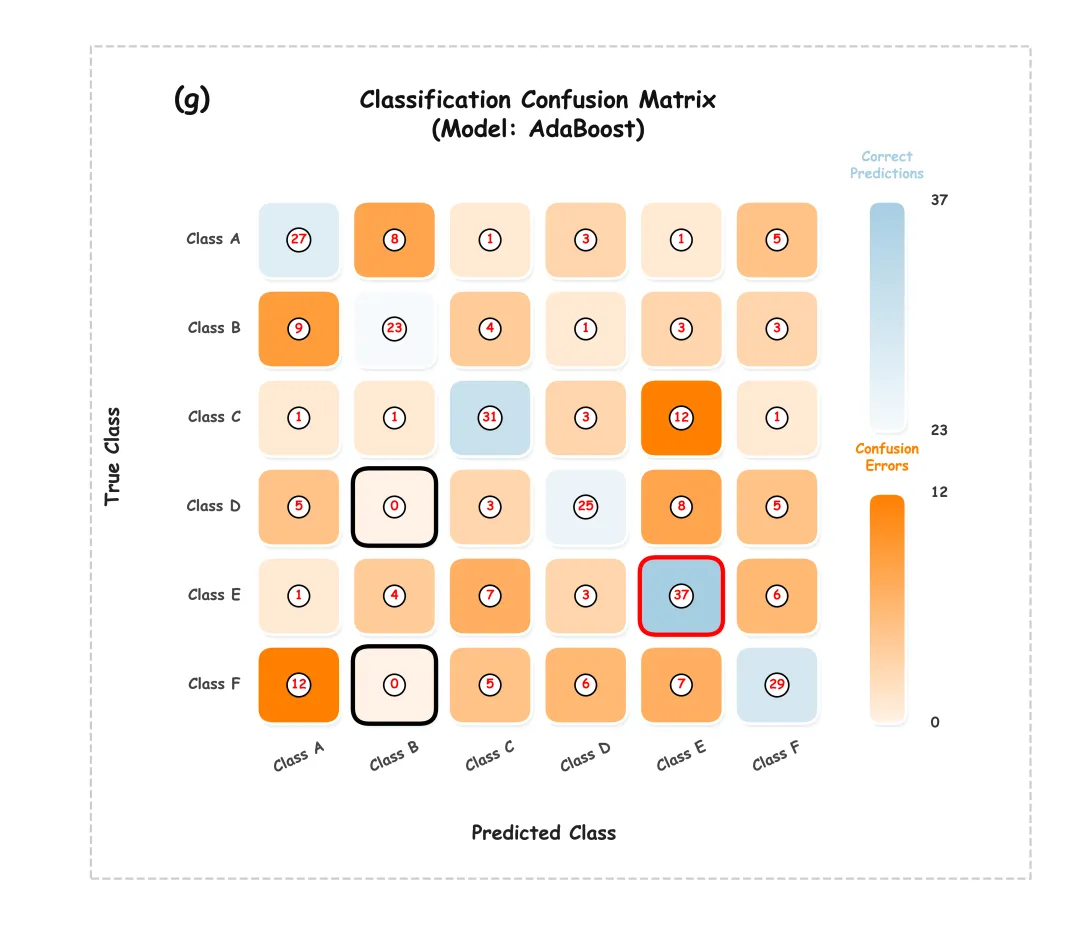
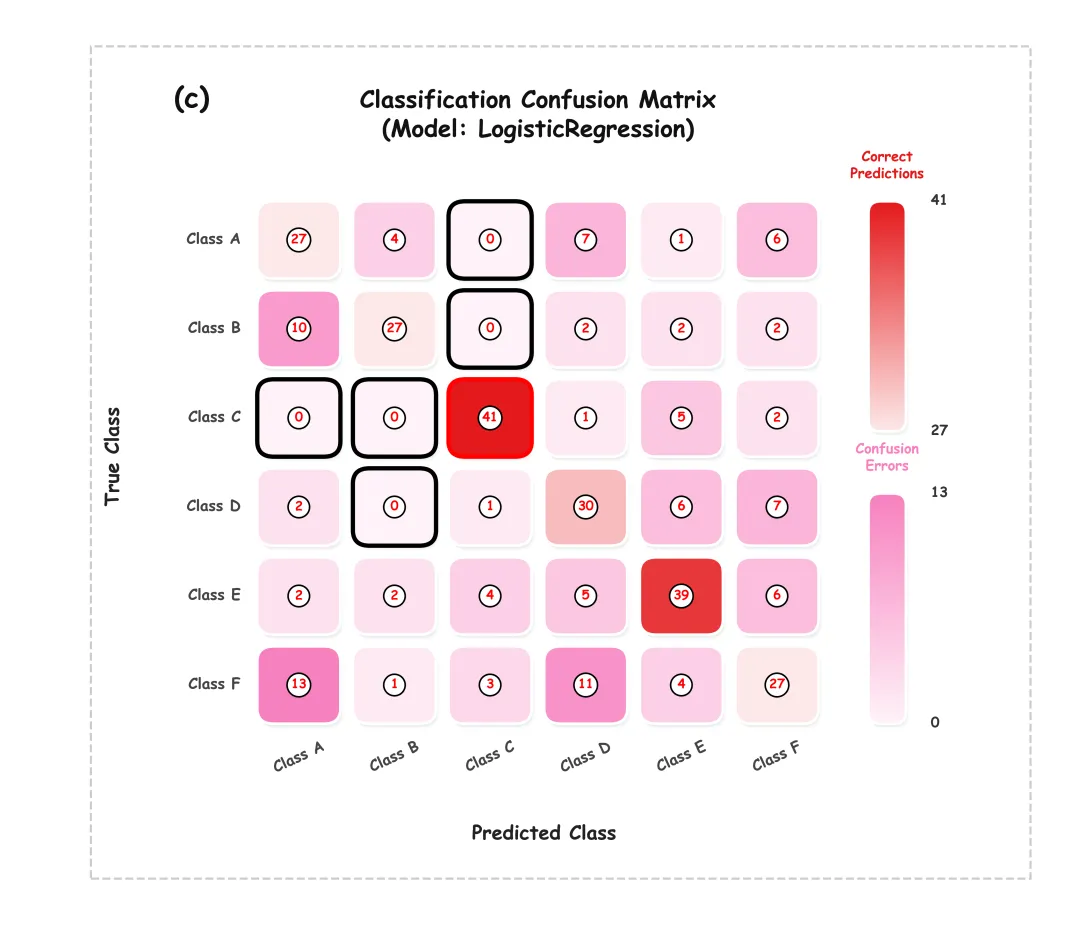
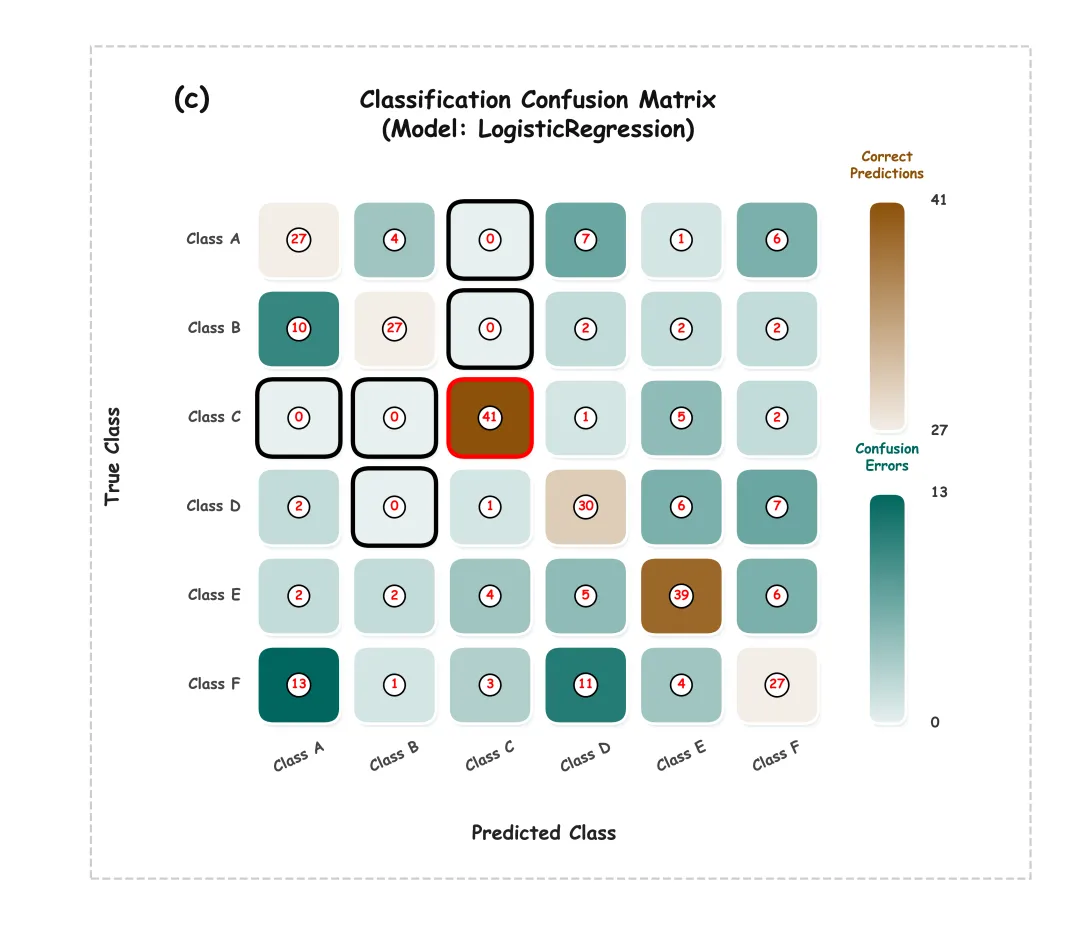
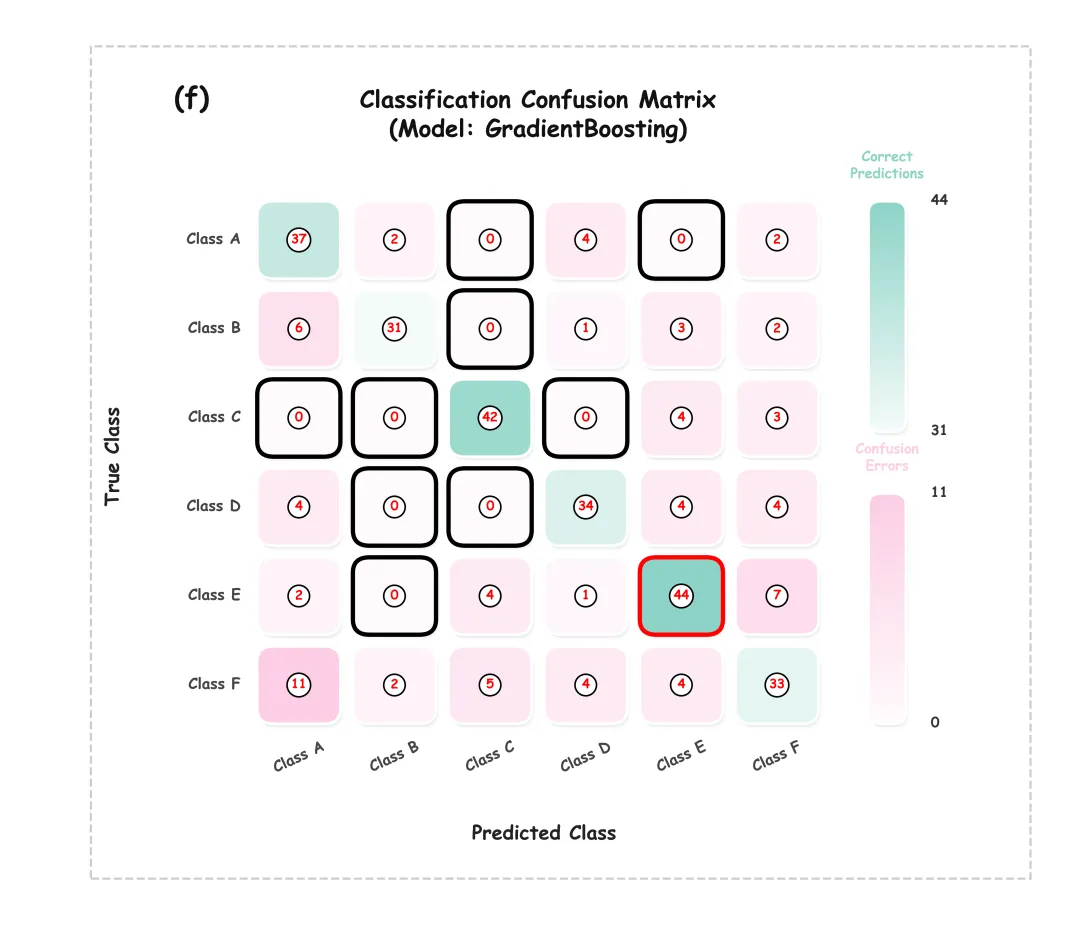
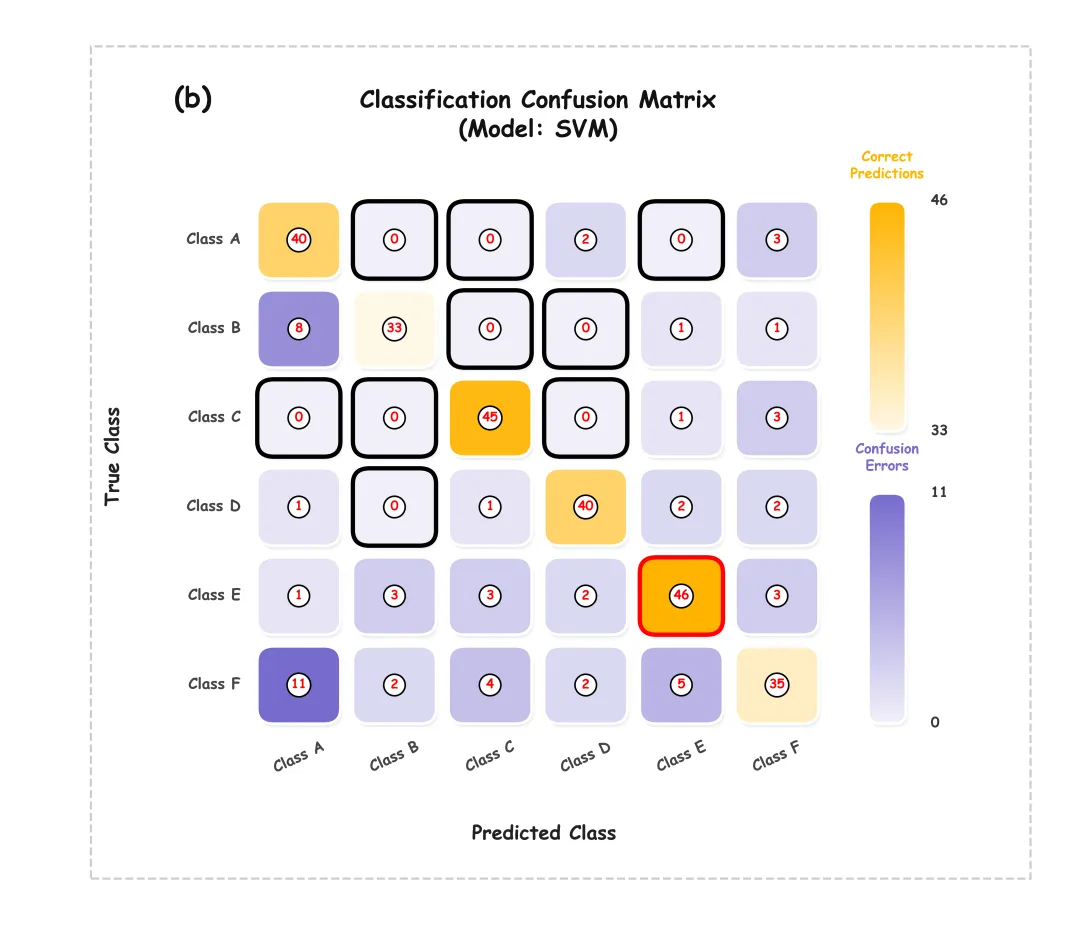
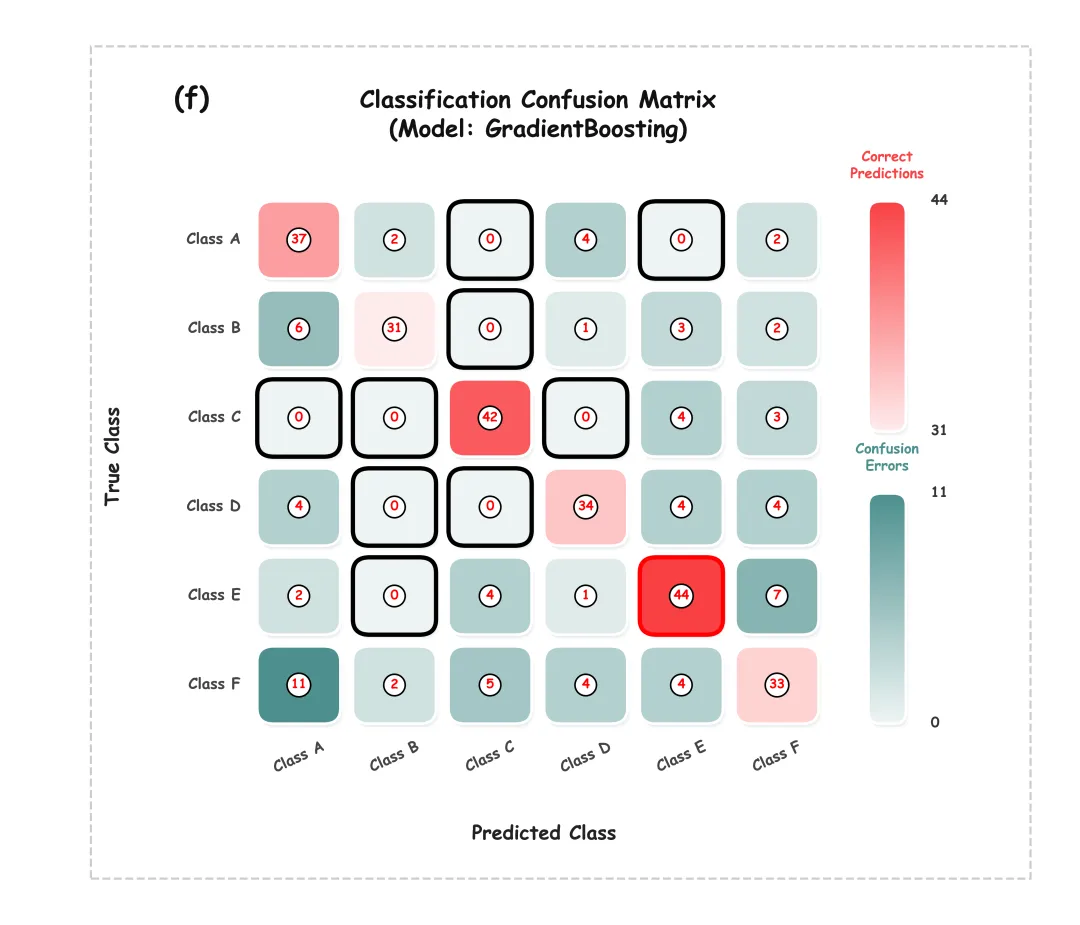
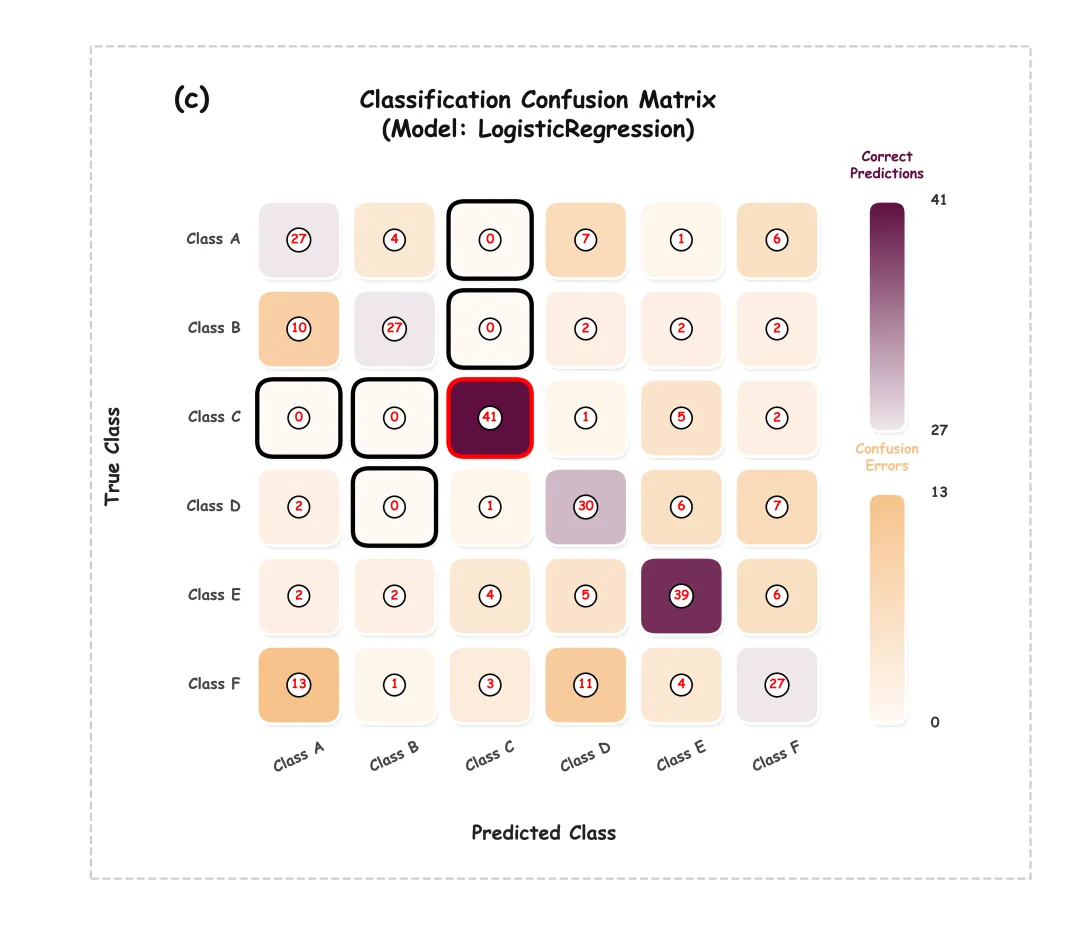
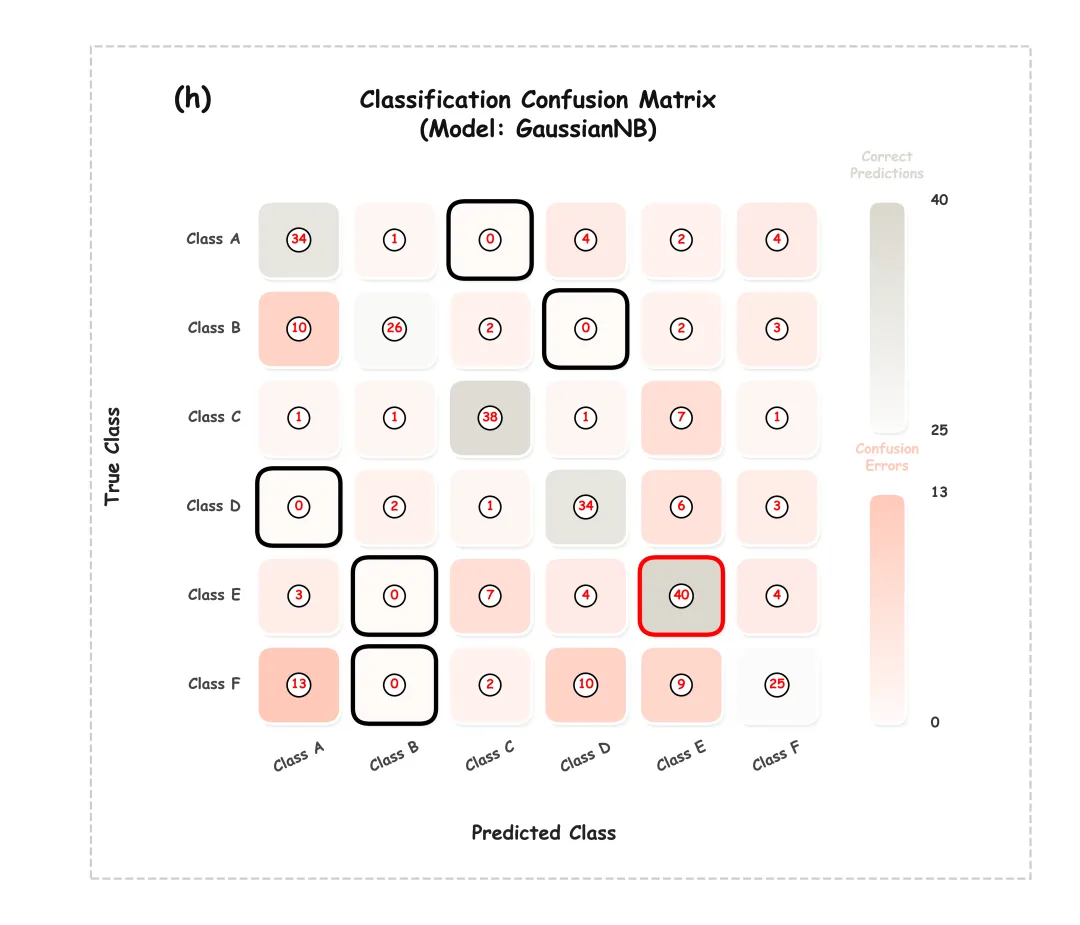
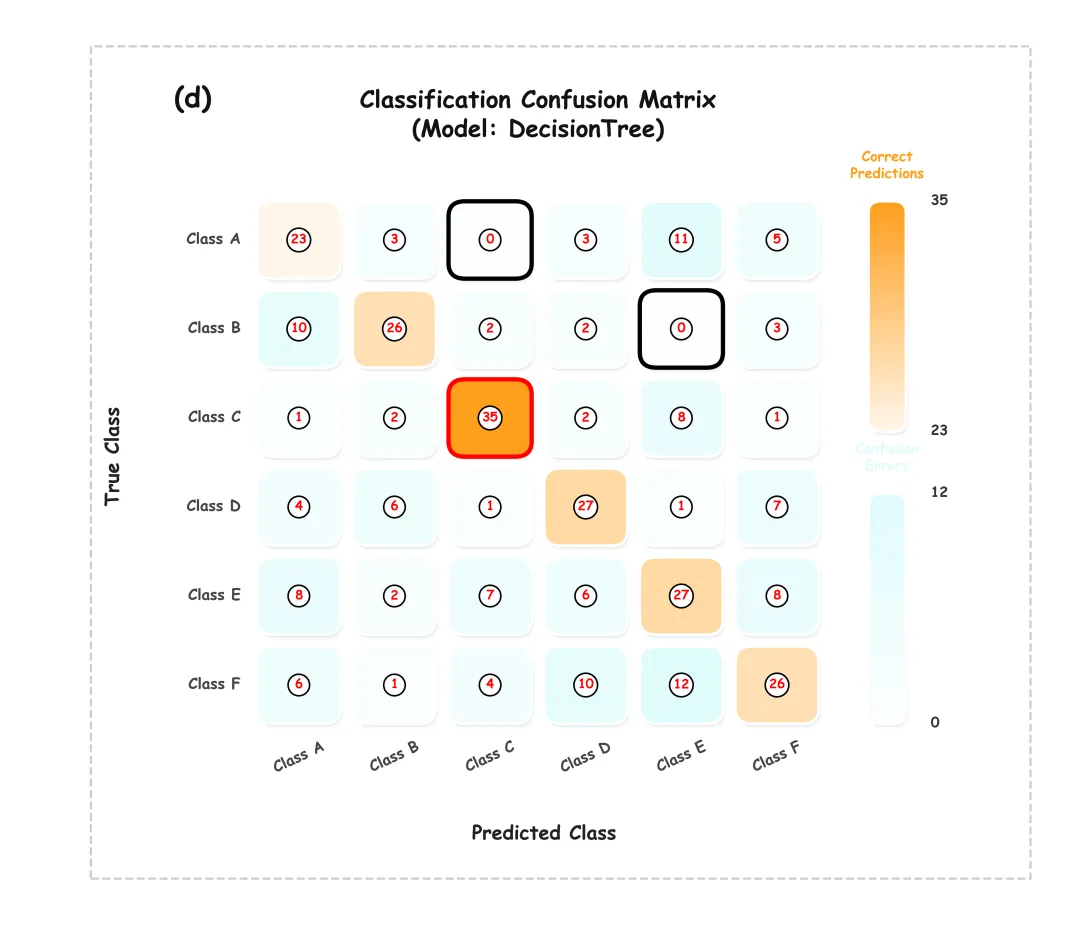
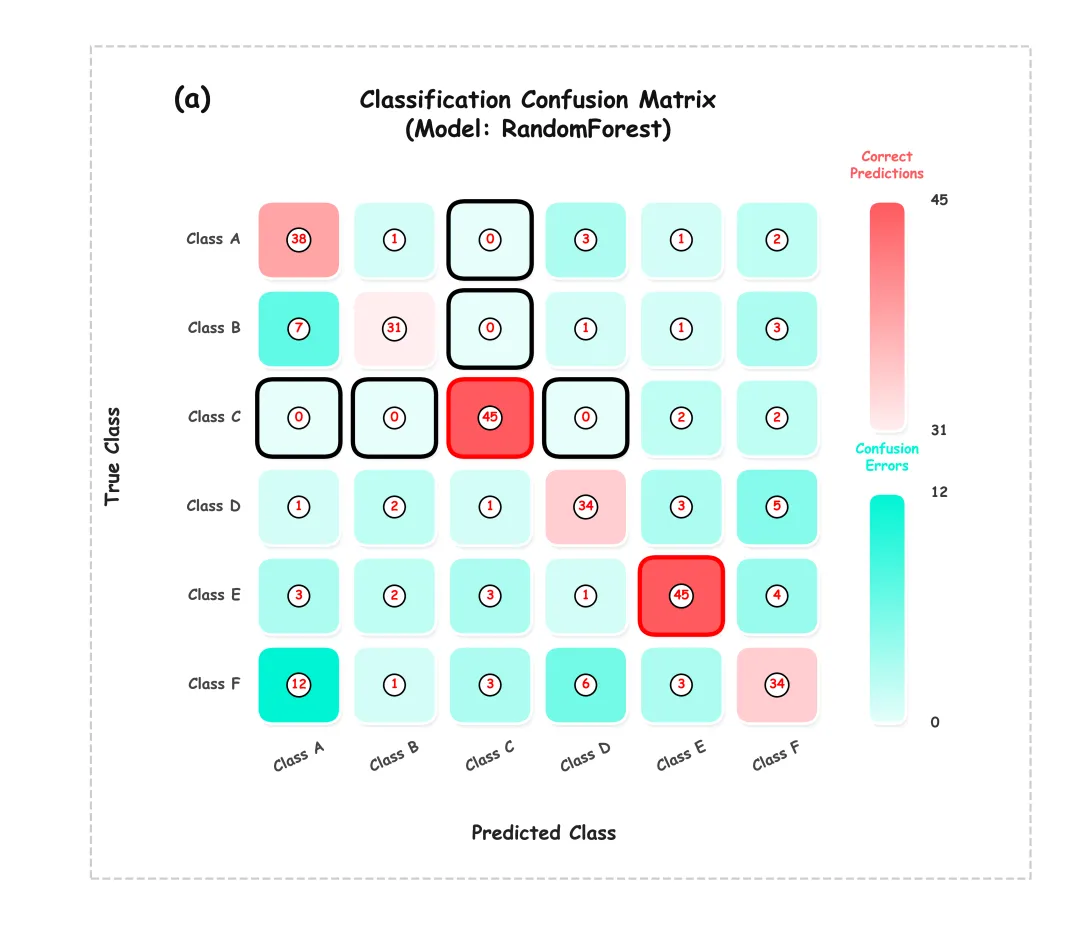
这段代码是一个集成了机器学习模型评估与高颜值混淆矩阵绘制的完整脚本。 主要功能:通过训练多种基础分类算法并对其预测结果进行处理,最终批量生成并导出具有3D立体阴影和果冻质感的卡通风格混淆矩阵图。在整体处理流程上,首先完成了基础绘图环境的配置与60种预设颜色方案的颜色色库的设置,定义了用于极值运算和平滑色彩插值的辅助计算函数;接着精心设计了带有圆角、多层递进立体阴影、文本白边描边以及带圈数值标注的矩阵块,单独开发了能区分“正确”与“错误”预测区间的自定义平滑渐变颜色条;在执行阶段,从本地Excel文件读取数据并按照7:3的比例划分为训练集与测试集,遍历了随机森林、支持向量机、逻辑回归、决策树、K近邻、梯度提升树、自适应提升算法以及高斯朴素贝叶斯这8种经典机器学习模型,依次利用网格搜索进行超参数调优与交叉验证,提取出各算法的最优模型对测试集进行预测,将计算得到的真实混淆矩阵数据连同模型名称、子图序号动态传入前置的绘图模块中,最终在指定的本地目录下自动化生成并保存为PNG与PDF格式文件。 


库的导入以及字体设置 

颜色库的设置以及配色方案的选取 

极值计算辅助函数:用于计算列表内最小值和最大值的辅助函数。在处理异常边界情况时,如果列表为空,则直接返回 (0, 1);如果最小值和最大值相等(即列表内所有数值相同),它会将最大值加1。这样处理是为了防止在后续的颜色映射计算阶段中出现分母为零的错误。 

颜色插值辅助函数:用于实现数值到颜色的映射。函数会判断当前格子属于“正确预测”还是“错误预测”,基于此来选择不同的基准色。然后根据当前数值在整体范围中所占的比例,将基准色与纯白色进行线性插值计算。同时避免了数值极小时颜色变成纯白色而导致无法看清的问题,保证所有数据块都有一定的色彩显现。 


期刊图片复现|Python绘制二维偏依赖PDP图 期刊复现|python绘制基于SHAP分析和GAM模型拟合的单特征依赖图 期刊图片复现|python绘制带有渐变颜色shap特征重要性组合图(条形图+蜂巢图) 期刊复现|用Python绘制SHAP特征重要性总览图、依赖图、双特征交互效应SHAP图,解锁XGBoost模型的终极奥秘 期刊图片复现|Python绘制shap重要性蜂巢图+单特征依赖图+交互效应强度气泡图+交互效应依赖图(回归+二分类+分类) 

公众号中的所有所有的免费代码都已经下架了,都并入到付费部分里了,付费合集代码和数据的购买通道已经开通,全部合集100元,后续将会持续更新,决定购买请后台私信我,注意只会分享练习数据和代码文件,不会提供答疑服务,代码文件中已经包含了每行代码的完整注释,购买前请确保真的需要!!!
代码绘制成果展示
代码主要功能和技术流程
代码解释
第一部分
# =========================================================================================# ====================================== 1. 环境设置 =======================================# =========================================================================================import matplotlib.pyplot as pltimport matplotlib.patches as patchesimport matplotlib.patheffects as peimport matplotlib.colors as mcolorsimport matplotlibimport pandas as pdimport numpy as npimport os
第二部分
# =========================================================================================# ======================================2.颜色库=======================================# =========================================================================================COLOR_SCHEMES = {1: ['#5ca2fb', '#8ec3a5', '#ff9f9b', '#abe5ea', '#fdf6c2', '#c9cbfd', '#bae8ca', '#02ba6f', '#ff9999', '#99ccff'],}SCHEME_ID = 60 #选择配色方案colors = COLOR_SCHEMES.get(SCHEME_ID, COLOR_SCHEMES[1]) # 通过scheme_id获取对应的色彩方案,默认若不存在则回退至方案1color_correct = colors[0] # 获取正确预测的主体色color_error = colors[7] # 选取错误预测的主体色
第三部分
# =============================================================================================================# ======================================3.辅助函数,用于计算传入数值列表的最小值和最大值=======================================# =============================================================================================================def get_min_max(vals):if len(vals) == 0: #如果为空return 0, 1 #返回为0min_v = np.min(vals) #最小值max_v = np.max(vals) #最大值if min_v == max_v: #如果相同return min_v, max_v + 1 #将最大值加1return min_v, max_v #返回计算好的最小值和最大值
第四部分
# =============================================================================================================# ======================================4.辅助函数,用于计算单元格颜色插值的函数=======================================# =============================================================================================================def get_interpolated_color(val, min_val, max_val, is_correct, color_correct, color_error):base_color = color_correct if is_correct else color_error # 根据预测结果,选择颜色c_target = np.array(mcolors.to_rgb(base_color)) #转换为RGB数组c_white = np.array([1.0, 1.0, 1.0]) #纯白色的RGB数组#最大值最小值不同时c = ratio * c_target + (1 - ratio) * c_white #根据调整后的比例,在基准色与白色之间进行线性插值return tuple(c) #转为元组后返回
第五部分
# =========================================================================================# ======================================5.绘图函数,绘制果冻风格颜色条===========================# =========================================================================================def draw_jelly_colorbar(ax, y_bottom, height, is_correct, min_v, max_v, title,color_correct, color_error, cb_x, cb_width,solid_shadow_effects, txt_effects):base_color = color_correct if is_correct else color_error #根据预测结果选择对应的基准颜色cb_base.set_path_effects(solid_shadow_effects) #给背景框添加立体阴影ax.add_patch(cb_base) #添加到子图画布#颜色条切分步数,形成平滑过渡num_steps = 100step_h = height / num_steps #计算每一个渐变小色块的高度#颜色条的标题ax.text(cb_x + cb_width / 2, #xy_bottom + height + 2.5, #ytitle, #标题文字ha='center', #水平va='bottom', #垂直fontsize=13, #字体大小fontweight='bold', #加粗color=base_color, #标题的颜色path_effects=txt_effects, #文本阴影特效zorder=6) #层级
第六部分
# ======================================================================================================# ======================================6.绘制卡通风格混淆矩阵的主函数=======================================# ======================================================================================================def draw_cartoon_policy_chart(conf_matrix, labels, model_name, label_str):n = len(labels) #获取类别数量max_correct = np.max(np.diag(conf_matrix)) #提取混淆矩阵对角线元素并找出其中的最大值min_correct = np.min(np.diag(conf_matrix)) #提取对角线元素中的最小值# 创建一个全为True的布尔掩码矩阵off_diag_mask = np.ones((n, n), dtype=bool)np.fill_diagonal(off_diag_mask, False) #将对角线位置上的掩码设置为False,以区分正确预测与错误预测部分ax.axis('off') #隐藏坐标轴边框及刻度线half_h = (cb_total_height - gap) / 2 #每根颜色条的高度cb_width = 4.5 #颜色条宽度ax.add_patch(rect) #加入到图层中#子图编号ax.text(-15, #Xcb_total_height - CELL_SIZE / 2 + 15, #Ylabel_str, #标签名fontsize=26, #字体大小fontweight='bold', #加粗color='#111', #颜色path_effects=txt_effects, #阴影va='top', #水平ha='left') #垂直#计算整个矩阵主体中心位置的X坐标title_x = ((n - 1) * SPACING) / 2#标题ax.text(title_x, #Xcb_total_height - CELL_SIZE / 2 + 11, #Yf"Classification Confusion Matrix\n(Model: {model_name})", #总标题ha='center', #水平va='center', #垂直fontsize=22, #标题color='#111', #字体颜色fontweight='bold', #加粗path_effects=txt_effects) #阴影
第七部分
# =========================================================================================# ======================================7.执行部分=======================================# =========================================================================================if __name__ == '__main__':LOCAL_DATA_PATH = r'data.xlsx' #文件本地路径TARGET_COLUMN = 'Target' #目标df = pd.read_excel(LOCAL_DATA_PATH) #读取X = df.drop(columns=[TARGET_COLUMN]) #特征y = df[TARGET_COLUMN] #标签# 获取全部可能的类别标签值,去重后并按照一定规则进行排序化unique_labels = sorted(list(y.unique()))#遍历模型配置字典for i, (name, (model, param_grid)) in enumerate(models.items()):label_str = subplot_labels[i] #提取对应编号#开启网格搜索gs = GridSearchCV(model, param_grid, cv=3, n_jobs=-1)gs.fit(X_train, y_train) #拟合模型score = gs.score(X_test, y_test) #使用最佳模型对测试集评估print(f"测试集准确率: {score:.4f} (最佳参数: {gs.best_params_})")best_estimator = gs.best_estimator_ #最佳模型y_pred = best_estimator.predict(X_test) #对测试集进行预测#混淆矩阵cm = confusion_matrix(y_test, y_pred, labels=unique_labels)#绘图draw_cartoon_policy_chart(conf_matrix=cm, #混淆矩阵结果labels=unique_labels, #标签model_name=name, #标题label_str=label_str, #编号)
如何应用到你自己的数据
1.设置配色方案:
SCHEME_ID = 602.设置绘图结果的保存地址:
save_dir = r'卡通风格混淆矩阵' #文件路径3.设置原始数据的保存路径:
LOCAL_DATA_PATH = r'data.xlsx' 4.设置目标变量:
TARGET_COLUMN = 'Target' #目标5.设置模型配置字典:
models = { "RandomForest":}6.设置子图的编号:
subplot_labels = ['(a)', '(b)', '(c)', '(d)', '(e)', '(f)', '(g)', '(h)']推荐
获取方式
本文来自网友投稿或网络内容,如有侵犯您的权益请联系我们删除,联系邮箱:wyl860211@qq.com 。

