使用python进行Logistic regression分析及ROC曲线绘制
- 2026-09-02 19:29:14
使用python进行Logistic regression分析及ROC曲线绘制








关注美格科服公众号 掌握最新最全的美格基因产品资讯 


广东美格基因科技有限公司专注于微生物组学创新技术以及产品的研发与产业化。公司拥有一支由国际知名学者领衔的高水平研发与产业化队伍,建有广东省环境功能基因芯片工程技术研究中心、美格基因研究院、微生物菌种资源库等多个高水平微生物组学研究平台。微生物组科研服务、微生物基因芯片、微生物检测、微生物调控、基因组酶学等技术居国际领先水平。美格基因作为中国微生物组领军企业,多项技术与产品已在科研服务、生态环境、农业、医药健康领域得到了广泛应用。展望未来,美格基因志在以微生物组技术造福社会,并致力在国际微生物组领域占有一席之地。 如您有任何需求和疑问,欢迎随时咨询,美格基因竭诚为您服务! 固话:400-968-5700 客服QQ:811480176 邮箱:support@magigene.com 官网:http://www.magigene.com

Logistic regression是一种结合了linear regression和logistic压缩函数的机器学习模型,压缩函数可以将负无穷到正无穷的输入压缩为0-1的输出,将其输出用作二分类模型的类别预测概率即可以实现将线性回归用于分类问题。线性回归可以通过梯度下降更新每个特征的权重系数从而缩小模型的预测误差,提升模型性能,但为了避免过拟合,一般在线性回归中需要加入惩罚项,L1惩罚项的含义为权重w每个元素绝对值的和。当惩罚项为L1时,可以使某些特征的权重系数为0,从而实现特征选择。通常Logistic regression适合于数据量较小或中等的机器学习分类问题。
对于包含疾病和健康分组的多组学数据,我们可以使用Logistic regression模型进行疾病概率预测及重要特征提取,以下即以一个微生物组数据为例进行讲解:
示例数据
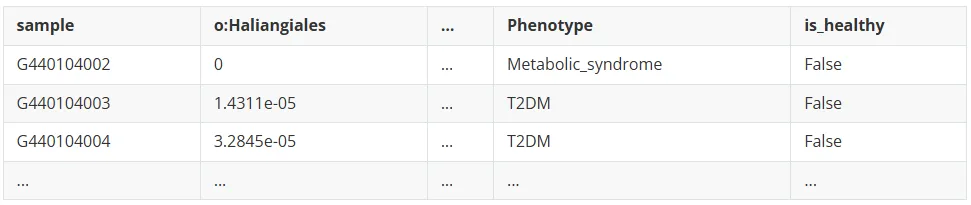
micro.xls, 包含样本名微生物相对丰度数据及疾病类型
执行代码
01
模型训练及疾病概率预测
import pandas as pdimport numpy as npimport sysimport warningsimport joblibimport osfrom sklearn.linear_model import LogisticRegressionfrom sklearn.base import BaseEstimatorfrom sklearn.metrics import balanced_accuracy_scorefrom sklearn.model_selection import cross_val_predictfrom sklearn.decomposition import PCAfrom sklearn.model_selection import StratifiedKFold, train_test_splitfrom sklearn.metrics import RocCurveDisplayfrom sklearn.metrics import roc_auc_scorefrom sklearn.metrics import confusion_matrix, classification_report#读取数据disease='T2DM' #二型糖尿病training_set = pd.read_csv("micro.xls", sep='\t', header=0)training_set = training_set[training_set["Phenotype"].str.contains(disease, na=False) |training_set["Phenotype"].str.contains("healthy", na=False) ]X = training_set.drop(["Phenotype","is_healthy",'sample'],axis=1)#过滤含有NA 的行X = X.dropna()#去除种水平和界水平的物种丰度X.drop([c for c in training_set.columns if "s:"inc],axis=1,inplace=True)X.drop([c for c in training_set.columns if "k:"inc],axis=1,inplace=True)# 将is_healthy列转换为二进制标签:True(健康)=0, False(疾病)=1y = training_set["is_healthy"].map({True: 0, False: 1})#提取x对应的yy = y[X.index]print(f"目标变量分布: {y.value_counts()}")print(f"类别比例: {y.value_counts(normalize=True)}")if len(y.unique()) <2:raiseValueError(f"数据中只有一个类别: {y.unique()},无法进行二分类")#从y=0中抽取疾病样本数量, 解决标签不平衡问题disease_num = y.sum()healthy_samples = y[y == 0].sample(n=disease_num, random_state=42)y = pd.concat([healthy_samples, y[y == 1]])X = X.loc[y.index]print(f"重新抽样后目标变量分布: {y.value_counts()}")print(f"重新抽样后类别比例: {y.value_counts(normalize=True)}")# 分层抽样拆分得到训练和测试集X_train, X_test, y_train, y_test = train_test_split(X, y, test_size=0.2, random_state=42, stratify=y )#保存测试集真实标签用于后续AUC曲线绘制y_test.to_csv("GMWI2_T2DM_true.csv", index=False)#使用训练集进行10倍交叉验证获取超参数C,即L1正则化强度参数skf = StratifiedKFold(n_splits=10, shuffle=True, random_state=42)forregin [0.001, 0.003, 0.01, 0.03, 0.1, 0.3, 1, 3, 5, 7]:gmwi2 = LogisticRegression(random_state=42, penalty="l1", solver="liblinear", C=reg, class_weight="balanced")#generate logit predictions for each foldGMWI2_scores_ISV = cross_val_predict(gmwi2, X_train, y_train, method="decision_function", cv=skf, verbose=0, n_jobs=32)bal = balanced_accuracy_score(y_train, GMWI2_scores_ISV>0)auc = roc_auc_score(y_train, GMWI2_scores_ISV)hyperparam_results[reg] = {'balanced_accuracy': bal, 'auc': auc}#根据balanced_accuracy评估选择最佳超参数hyperparam_df = pd.DataFrame(hyperparam_results).TREGULARIZATION = hyperparam_df.sort_values("balanced_accuracy").index[-1]print("REGULARIZATION: ", REGULARIZATION)#使用L1惩罚项gmwi2 = LogisticRegression(random_state=42, penalty="l1", solver="liblinear", C=REGULARIZATION, class_weight="balanced")X_GMWI2 = X_train.copy()gmwi2.fit(X_GMWI2, y_train) #计算概率 (0-1)model_probabilities = pd.DataFrame(gmwi2.predict_proba(X_test), index=X_test.index)model_probabilities.columns = ["GMWI2_Probability_0", "GMWI2_Probability_1"]model_probabilities.to_csv("GMWI2_T2DM_probabilities.tsv",sep='\t',index=False)#提取特征重要性feature_importance = pd.DataFrame({'feature': X_GMWI2.columns,'coefficient': gmwi2.coef_[0],'abs_coefficient': np.abs(gmwi2.coef_[0]) })#按模型中特征权重系数的绝对值排序(重要性从高到低)feature_importance_sorted = feature_importance.sort_values('abs_coefficient', ascending=False)feature_importance_sorted.to_csv('feature_importance.csv', index=False)feature_importance.csv
02
绘制AUC曲线
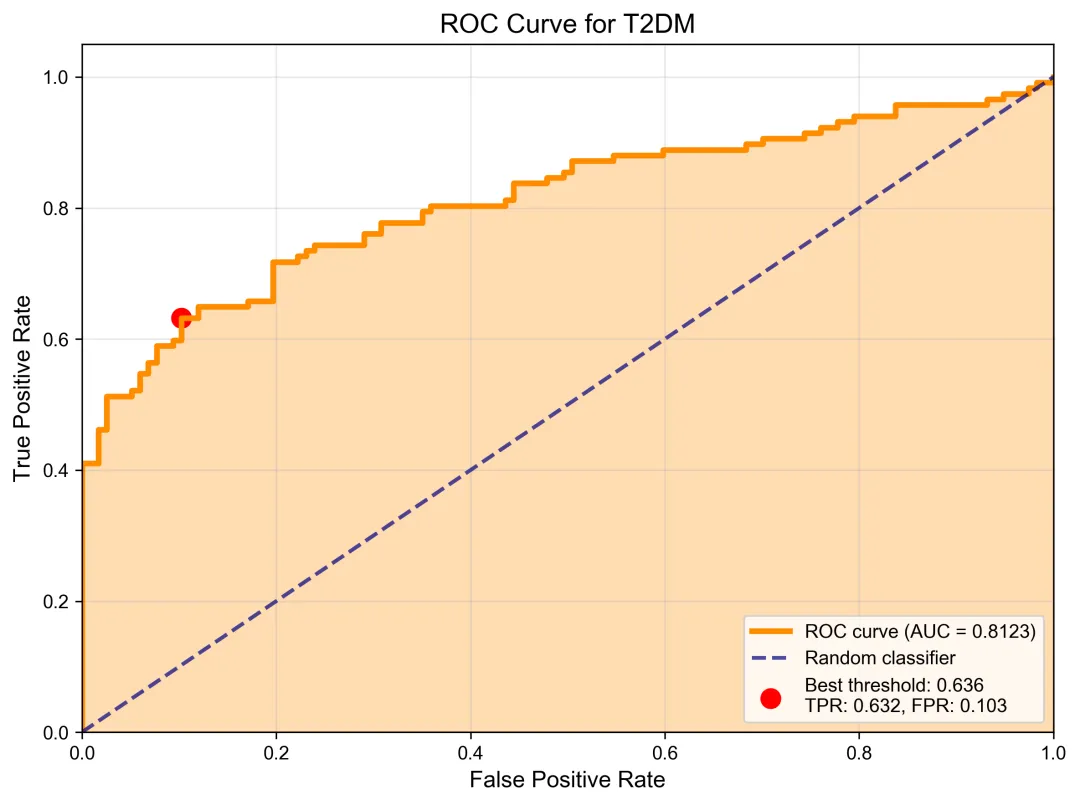
import pandas as pdimport numpy as npimport matplotlib.pyplot as pltimport os,sys# 设置中文字体plt.rcParams['font.sans-serif'] = ['SimHei', 'Arial Unicode MS', 'DejaVu Sans']plt.rcParams['axes.unicode_minus'] = Falsedef plot_auc_curve(prob_file, dataset,y_true_file=None, disease_name="T2DM", output_dir="logistic_models_ggmpOnly"):""" 绘制AUC曲线 Parameters: ----------- prob_file : str 概率文件路径 y_true_file : str, optional 真实标签文件路径,如果为None则从概率文件名推断 disease_name : str 疾病名称 """# 读取概率数据print(f"正在读取概率文件: {prob_file}")prob_df = pd.read_csv(prob_file, sep='\t')# 检查概率文件结构print(f"概率文件列名: {prob_df.columns.tolist()}")print(f"概率文件形状: {prob_df.shape}")# 获取阳性概率(GMWI2_Probability_1)if'GMWI2_Probability_1'inprob_df.columns:y_prob = prob_df['GMWI2_Probability_1']else:raiseValueError("概率文件中未找到合适的概率列")# 从文件读取真实标签y_true_df = pd.read_csv(y_true_file)y_true = y_true_df.values.flatten()# 计算ROC曲线fpr, tpr, thresholds = roc_curve(y_true, y_prob)roc_auc = auc(fpr, tpr)# 创建ROC曲线图plt.figure(figsize=(8, 6))# 绘制ROC曲线plt.plot(fpr, tpr, color='darkorange', lw=3, label=f'ROC curve (AUC = {roc_auc:.4f})')plt.plot([0, 1], [0, 1], color='navy', lw=2, linestyle='--', alpha=0.7, label='Random classifier')plt.fill_between(fpr, tpr, alpha=0.3, color='darkorange')# 标记最佳阈值点(Youden's J statistic)youden_j = tpr-fprbest_idx = np.argmax(youden_j)best_threshold = thresholds[best_idx]plt.scatter(fpr[best_idx], tpr[best_idx], color='red', s=100, label=f'Best threshold: {best_threshold:.3f}\nTPR: {tpr[best_idx]:.3f}, FPR: {fpr[best_idx]:.3f}')plt.xlim([0.0, 1.0])plt.ylim([0.0, 1.05])plt.xlabel('False Positive Rate', fontsize=12)plt.ylabel('True Positive Rate', fontsize=12)plt.title(f'ROC Curve for T2DM', fontsize=14, fontweight='bold')plt.legend(loc="lower right", fontsize=10)plt.grid(True, alpha=0.3)plt.tight_layout()# 保存图像os.makedirs(output_dir, exist_ok=True)plt.savefig('AUC_curve_detailed.png', dpi=300, bbox_inches='tight')plt.savefig('AUC_curve_detailed.pdf', bbox_inches='tight')# 设置文件路径prob_file = "GMWI2_T2DM_probabilities.csv"disease_name = "T2DM"y_true_file = "GMWI2_T2DM_true.csv"# 检查文件是否存在if not os.path.exists(prob_file):print(f"错误: 概率文件不存在: {prob_file}")print("请确保模型已经训练并生成了概率文件")returntry:# 绘制AUC曲线auc_score, best_threshold = plot_auc_curve(prob_file=prob_file,disease_name=disease_name,output_dir=output_dir,y_true_file=y_true_file,dataset=dataset )except Exception as e:print(f"错误: {e}")print("请检查概率文件的格式和内容")ROC图
以上就是本期推文的全部内容, 希望此教程对您的科研工作有所帮助!
﹀
﹀
﹀
致尊敬的您:
本文来自网友投稿或网络内容,如有侵犯您的权益请联系我们删除,联系邮箱:596563534@qq.com 。
