https://github.com/prometheushttps://grafana.com/grafana/downloadhttps://github.com/nginx/nginx-prometheus-exporterhttps://github.com/prometheus/mysqld_exporter
tar xzvf prometheus-3.10.0.linux-amd64.tar.gz -C /usr/local/tar xzvf node_exporter-1.10.2.linux-amd64.tar.gz -C /usr/local/tar xzvf mysqld_exporter-0.19.0.linux-amd64.tar.gz -C /usr/local/tar xzvf alertmanager-0.31.1.linux-amd64.tar.gz -C /usr/local/tar xzvf grafana-enterprise-12.4.2.linux-amd64.tar.gz -C /usr/local/tar xzvf nginx-prometheus-exporter_1.5.1_linux_amd64.tar.gz -C /usr/local/nginx-prometheus-exporter/
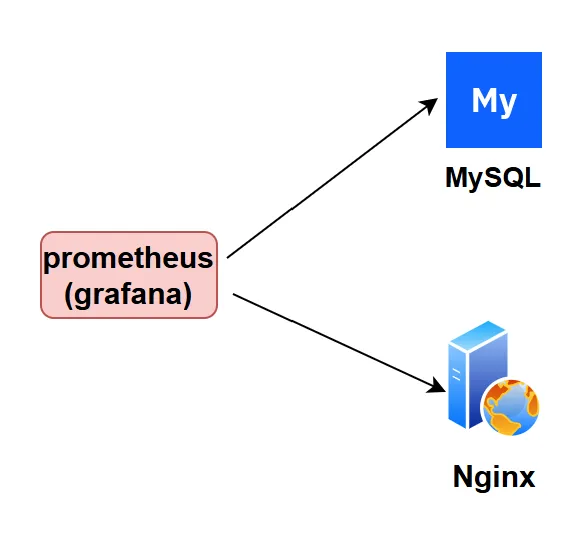
prometheus
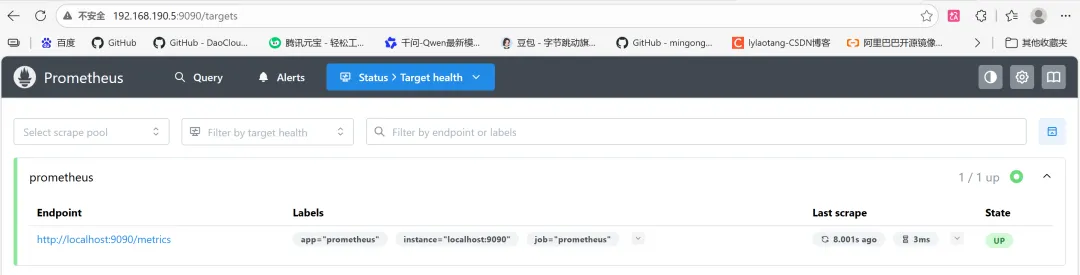
vi /usr/lib/systemd/system/prometheus.service[Unit]After=network.target[Service]ExecStart=/usr/local/prometheus-3.10.0.linux-amd64/prometheus --config.file="/usr/local/prometheus-3.10.0.linux-amd64/prometheus.yml"ExecReload=/bin/kill -HUP $MAINPID[Install]WantedBy=multi-user.target------------------------------------------------------------------------------------------------------------systemctl daemon-reload && systemctl enable --now prometheus && systemctl status prometheusss -tunlp | grep prometheushttp://192.168.190.5:9090/targetscurl http://localhost:9090/metrics
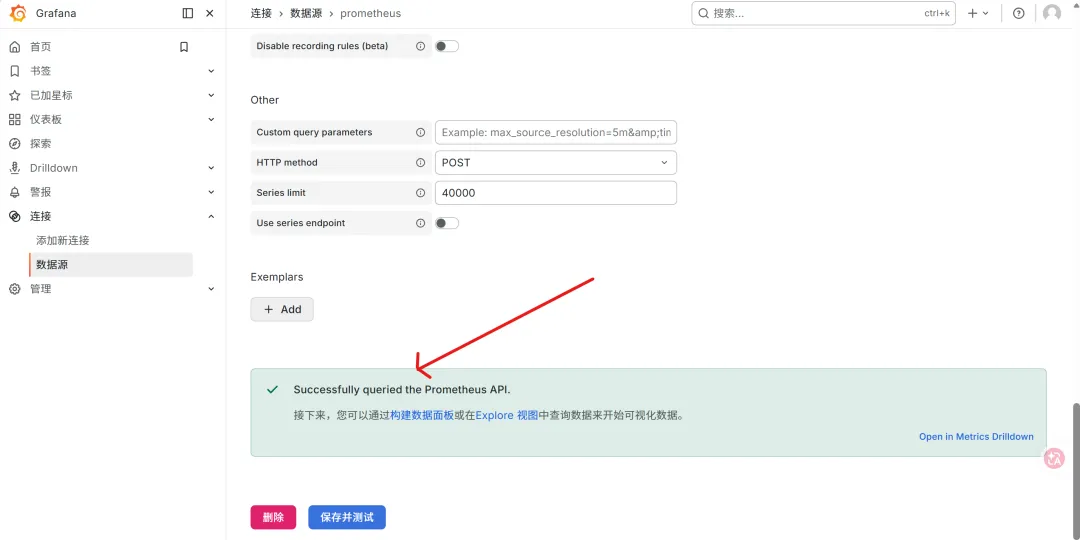
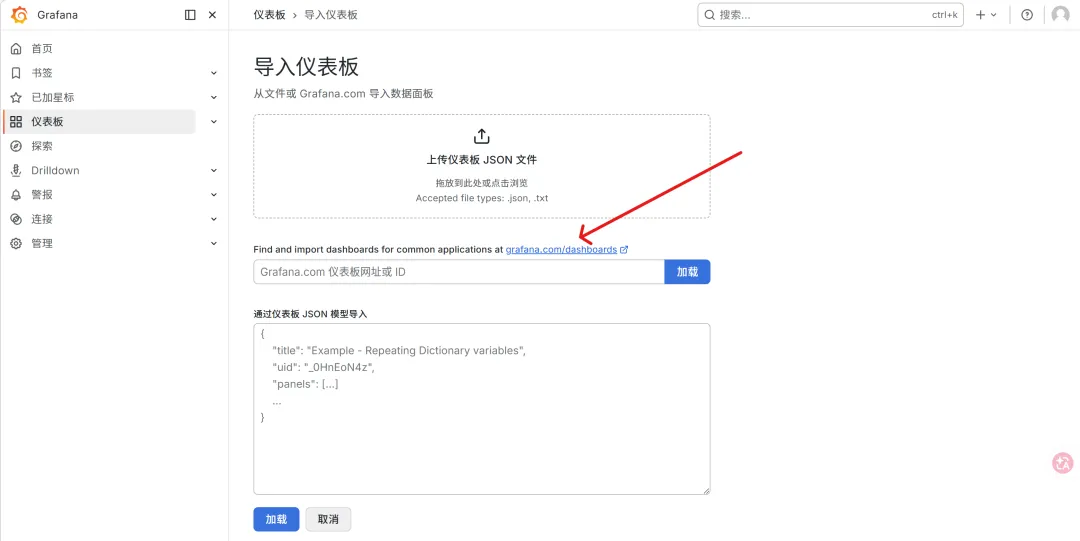
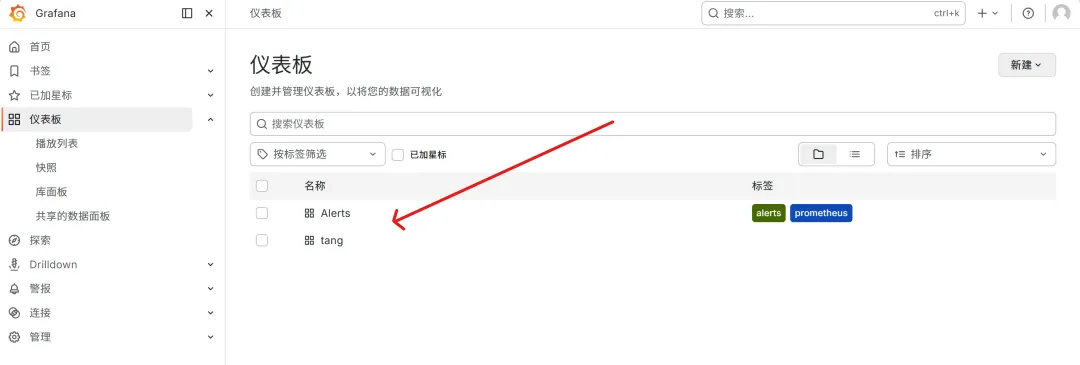
grafana
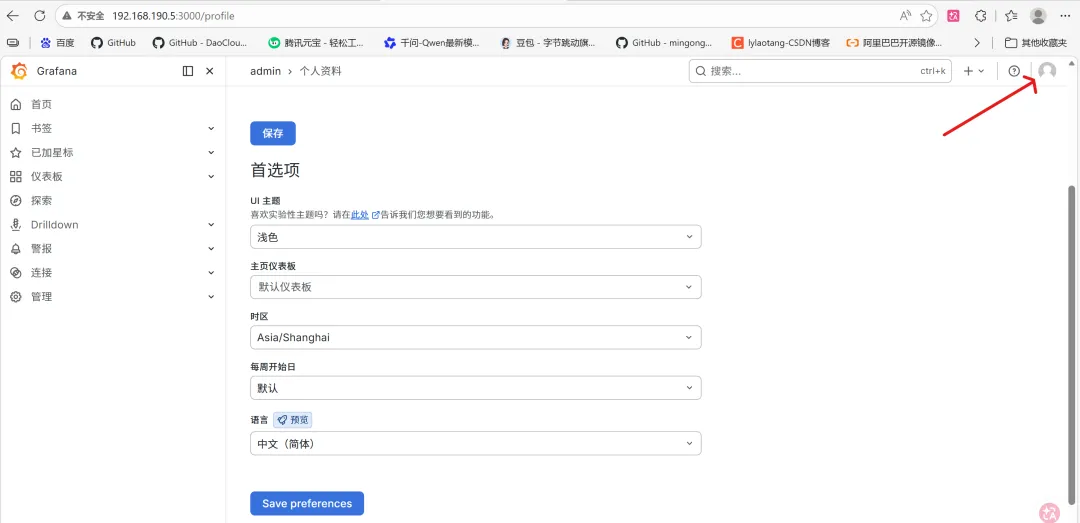
vi /usr/lib/systemd/system/grafana.service[Unit]After=network.target[Service]ExecStart=/usr/local/grafana-12.4.2/bin/grafana server --homepath="/usr/local/grafana-12.4.2/" --config="/usr/local/grafana-12.4.2/conf/sample.ini"ExecReload=/bin/kill -HUP $MAINPIDKillMode=process[Install]WantedBy=multi-user.target------------------------------------------------------------------------------------------------------------systemctl daemon-reload && systemctl enable --now grafana && systemctl status grafanass -tunlp | grep grafana
alertmanager
vi /usr/lib/systemd/system/alertmanager.service[Unit]After=network.target[Service]ExecStart=/usr/local/alertmanager-0.31.1.linux-amd64/alertmanager --config.file="/usr/local/alertmanager-0.31.1.linux-amd64/alertmanager.yml"ExecReload=/bin/kill -HUP $MAINPIDKillMode=process[Install]WantedBy=multi-user.target------------------------------------------------------------------------------------------------------------systemctl daemon-reload && systemctl enable --now alertmanager && systemctl status alertmanagerss -tunlp | grep alertmanager
node_exporter
vi /usr/lib/systemd/system/node_exporter.service[Unit]After=network.target[Service]ExecStart=/usr/local/node_exporter-1.10.2.linux-amd64/node_exporterExecReload=/bin/kill -HUP $MAINPIDKillMode=process[Install]WantedBy=multi-user.target------------------------------------------------------------------------------------------------------------systemctl daemon-reload && systemctl enable --now node_exporter && systemctl status node_exporterss -tunlp | grep node_exportercurl http://localhost:9100/metrics
mysqld_exporter
vi /etc/my.cnf#注意这里的密码一定要设置![client]user=exporterpassword=Exporter@123host=127.0.0.1 # 确保这里是 127.0.0.1 而不是 localhost 或 ::1port=3306------------------------------------------------------------------------------------------------------------#创建mysql监控账户,只需要在master上创建即可!CREATE USER 'exporter'@'localhost' IDENTIFIED BY 'Exporter@123';GRANT PROCESS, REPLICATION CLIENT ON *.* TO 'exporter'@'localhost';GRANT SELECT ON performance_schema.* TO 'exporter'@'localhost';FLUSH PRIVILEGES;------------------------------------------------------------------------------------------------------------vi /usr/lib/systemd/system/mysqld_exporter.service[Unit]After=network.target[Service]ExecStart=/usr/local/mysqld_exporter-0.19.0.linux-amd64/mysqld_exporter --config.my-cnf="/etc/my.cnf"ExecReload=/bin/kill -HUP $MAINPIDKillMode=process[Install]WantedBy=multi-user.target------------------------------------------------------------------------------------------------------------systemctl daemon-reload && systemctl enable --now mysqld_exporter && systemctl status mysqld_exporterss -tunlp | grep mysqld_exportercurl http://localhost:9104/metrics
nginx_exporter
https://github.com/nginx/nginx-prometheus-exporter#安装了stub_status模块(默认没有安装),保证下面的网页有返回信息!http://192.168.190.8/nginx_statusorcurl -v 192.168.190.8/nginx_statusnginx -V | egrep -i "--with-http_stub_status_module"vi /etc/nginx/nginx.conf server { location /nginx_status{ stub_status on; access_log off; allow 127.0.0.1; # 允许本地访问 allow ::1; # 允许 IPv6 本地访问 deny all; # 拒绝其他所有访问 }nginx -t && nginx -s reload && curl -v http://localhost/nginx_status------------------------------------------------------------------------------------------------------------返回各数据项说明:Active connections: 当前nginx正在处理的活动连接数.Server accepts handled requests request_time: nginx总共处理了13057 个连接,成功创建13057 握手(证明中间没有失败的),总共处理了11634 个请求,总共请求时间2230854。Reading: nginx读取到客户端的Header信息数.Writing: nginx返回给客户端的Header信息数.Waiting: 开启keep-alive的情况下,这个值等于 active – (reading + writing),意思就是nginx已经处理完成,正在等候下一次请求指令的驻留连接。所以,在访问效率高,请求很快被处理完毕的情况下,Waiting数比较多是正常的.如果reading +writing数较多,则说明并发访问量非常大,正在处理过程中。------------------------------------------------------------------------------------------------------------vi /usr/lib/systemd/system/nginx-exporter.service[Unit]After=network.target[Service]ExecStart=/usr/local/nginx-prometheus-exporter/nginx-prometheus-exporter --nginx.scrape-uri=http://127.0.0.1:80/nginx_statusExecReload=/bin/kill -HUP $MAINPIDKillMode=process[Install]WantedBy=multi-user.target------------------------------------------------------------------------------------------------------------systemctl daemon-reload && systemctl enable --now nginx-exporter && systemctl status nginx-exporterss -tunlp | grep nginx-prometheucurl http://localhost:9113/metrics
disposition
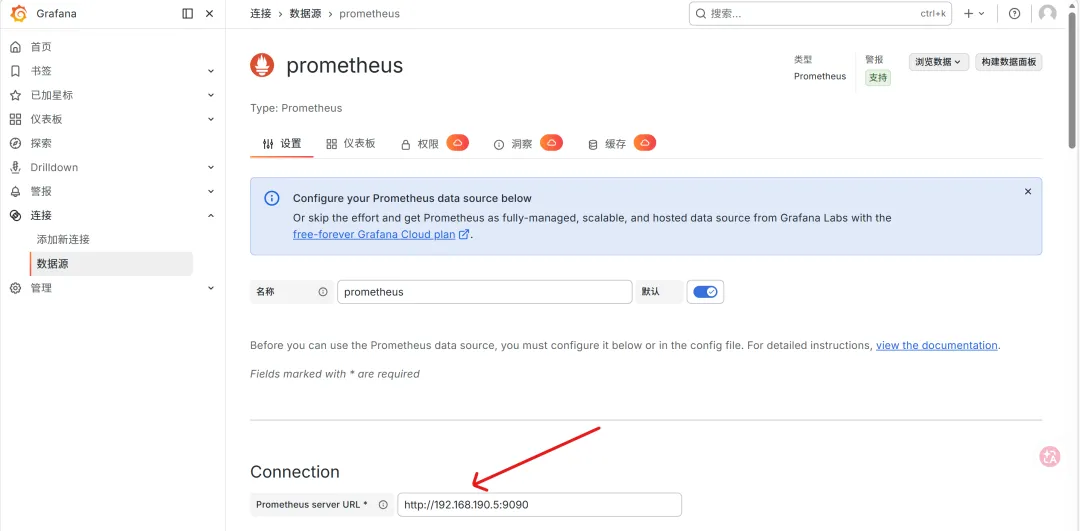
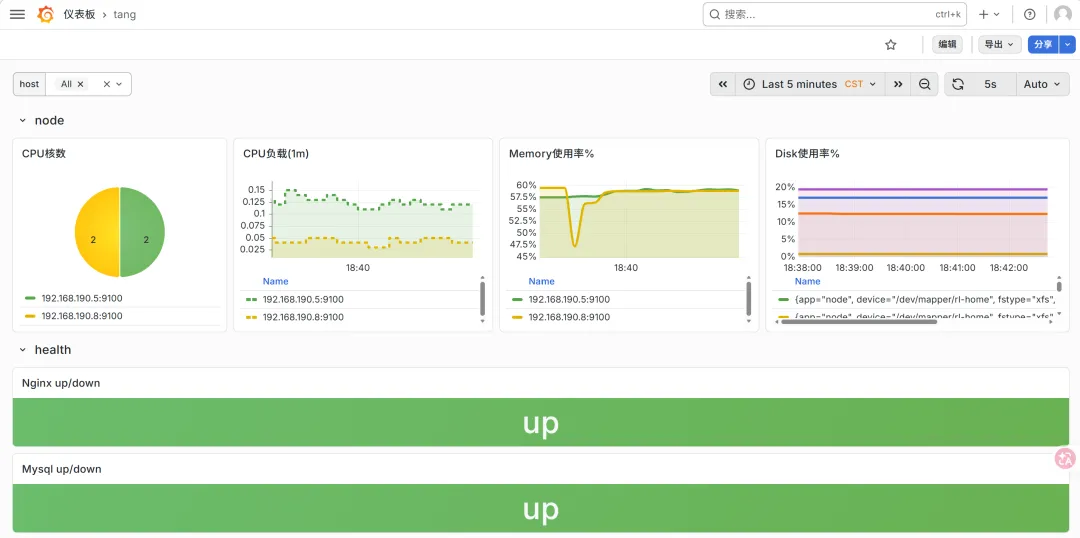
tee /usr/local/prometheus-3.10.0.linux-amd64/prometheus.yml <<eofglobal: scrape_interval: 3s #设置抓取间隔时间 evaluation_interval: 5s #评估规则间隔时间#根据全局设置的'evaluation_interval'定期评估告警规则rule_files: - "/usr/local/prometheus-3.10.0.linux-amd64/rules.yml"#警报管理器(Alertmanager)配置,非必要!alerting: alertmanagers: - static_configs: - targets: ["192.168.190.5:9093"]#抓取(scrape)配置scrape_configs: - job_name: "prometheus" static_configs: - targets: ["192.168.190.5:9090"] - job_name: 'node-exporter' static_configs: - targets: ['192.168.190.5:9100','192.168.190.8:9100'] labels: app: node - job_name: 'nginx-exporter' static_configs: - targets: ["192.168.190.8:9113"] labels: app: nginx - job_name: 'mysqld-exporter' static_configs: - targets: ["192.168.190.8:9104"] labels: app: mysqldeof
vi /usr/local/prometheus-3.10.0.linux-amd64/rules.ymlgroups: - name: server-down rules: - alert: server-down expr: up == 0 # 检测服务器是否宕机 for: 1m # 持续1分钟触发 labels: app: node - name: nginx-down rules: - alert: nginx-down expr: nginx_up == 0 #检测nginx服务是否正常 for: 3s labels: app: nginx - name: mysqld-down rules: - alert: mysqld-down expr: mysql_up == 0 #检测mysqld服务是否正常 for: 3s # 持续1分钟触发 labels: app: mysqld - name: HighCPU rules: - alert: HighCPU-Usage expr: 100 - (avg(irate(node_cpu_seconds_total{mode="idle"}[5m])) by (instance) * 100) > 80 for: 1m labels: app: node - name: HighMemory rules: - alert: HighMemory-Usage expr: (1 - (node_memory_MemAvailable_bytes / node_memory_MemTotal_bytes)) * 100 > 85 for: 1m labels: app: node - name: HighDisk rules: - alert: HighDisk-Usage expr: 100 - (node_filesystem_free_bytes{fstype=~"ext4|xfs"} / node_filesystem_size_bytes{fstype=~"ext4|xfs"} * 100) > 90 for: 1h labels: app: node
[root@rocky1 linshi]# /usr/local/prometheus-3.10.0.linux-amd64/promtool check rules /usr/local/prometheus-3.10.0.linux-amd64/rules.ymlChecking /usr/local/prometheus-3.10.0.linux-amd64/rules.yml SUCCESS: 6 rules found
tee /usr/local/alertmanager-0.31.1.linux-amd64/alertmanager.yml <<eofglobal: smtp_smarthost: 'smtp.163.com:25' # SMTP服务器地址和端口 smtp_from: 'xxx@163.com' # 发件人邮箱 smtp_auth_username: 'xxx@163.com' # SMTP认证用户名 smtp_auth_password: 'GLjCvs123FUdF' # 邮箱授权码(非登录密码) smtp_require_tls: true # 是否需要TLS加密route: group_by: ['alertname', 'job'] group_wait: 5s # 组告警等待时间。也就是告警产生后等待5s,如果有同组告警一起发出 group_interval: 10s # 两组告警的间隔时间 repeat_interval: 5m # 重复告警的间隔时间,减少相同告警的发送频率 receiver: 'mail' # 默认接收器receivers:- name: 'mail' email_configs: - to: 'tangcunzhi@163.com' # 收件人邮箱 send_resolved: true # 是否发送恢复通知eof------------------------------------------------------------------------------------------------------------cd /usr/local/alertmanager-0.28.0.linux-amd64./amtool check-config alertmanager.yml------------------------------------------------------------------------------------------------------------systemctl restart alertmanager