COLOR_PALETTES = { 1: {'up': '#B22222', 'down': '#104E8B', 'gray': '#C0C0C0'}, # 经典红蓝:Nature/Science高频使用,对比鲜明 2: {'up': '#D55E00', 'down': '#0072B2', 'gray': '#E69F00'}, # Colorblind Safe:色盲友好型红蓝方案 3: {'up': '#E41A1C', 'down': '#377EB8', 'gray': '#999999'}, # Set1经典:生物信息学图表常用标准红蓝 4: {'up': '#C00000', 'down': '#002060', 'gray': '#D9D9D9'}, # Cell风格:高饱和深红与深海军蓝搭配 5: {'up': '#A61C1C', 'down': '#1D4E89', 'gray': '#D3D3D3'}, # 优雅学术:低调暗红与学院蓝 6: {'up': '#8B0000', 'down': '#4682B4', 'gray': '#BEBEBE'}, # 深红钢蓝:适用于连续型/分型复合对比 7: {'up': '#FF4500', 'down': '#1E90FF', 'gray': '#E0E0E0'}, # 鲜艳红蓝:适合高对比度基因组学矩阵图 8: {'up': '#B81D13', 'down': '#008A00', 'gray': '#EFB435'}, # 红绿互补:传统芯片/经典通量分析配色 9: {'up': '#800020', 'down': '#008080', 'gray': '#C1CDCD'}, # 勃艮第红与深青:极高雅的医学期刊配色 10: {'up': '#E0115F', 'down': '#0047AB', 'gray': '#F0F0F0'}, # 红宝石与钴蓝:突出极值特异性基因组合 11: {'up': '#990000', 'down': '#034EA2', 'gray': '#EAEAEA'}, # 严谨理工:标准暗红与工业深蓝 12: {'up': '#DE3163', 'down': '#40E0D0', 'gray': '#CCCCCC'}, # 樱桃红与绿松石:现代单细胞测序常用高亮色 13: {'up': '#C70039', 'down': '#581845', 'gray': '#FFC300'}, # 暖色调组合:强调上调基因的渐进层次 14: {'up': '#E64B35', 'down': '#4DBBD5', 'gray': '#741AAC'}, # NEJM期刊风格:经典柳叶刀/新英格兰医学配色 15: {'up': '#3C5488', 'down': '#F39B7F', 'gray': '#91D1C2'}, # Nature Publishing Group (NPG) 经典调色盘 16: {'up': '#00A087', 'down': '#3C5488', 'gray': '#4DBBD5'}, # Lancet风格:医学生物学综合版面常用色 17: {'up': '#B03A2E', 'down': '#2874A6', 'gray': '#95A5A6'}, # 扁平化科研:冷暖平衡的哑光红蓝 18: {'up': '#78281F', 'down': '#1B4F72', 'gray': '#7B7D7D'}, # 重工业风:极深学术红黑与深邃暗蓝 19: {'up': '#D98880', 'down': '#7FB3D5', 'gray': '#F2F4F4'}, # 柔和蜡笔:适合多图层叠加的浅色调方案 20: {'up': '#641E16', 'down': '#0E6251', 'gray': '#BDC3C7'}, # 砖红与深墨绿:多维交集点阵的高对比方案}
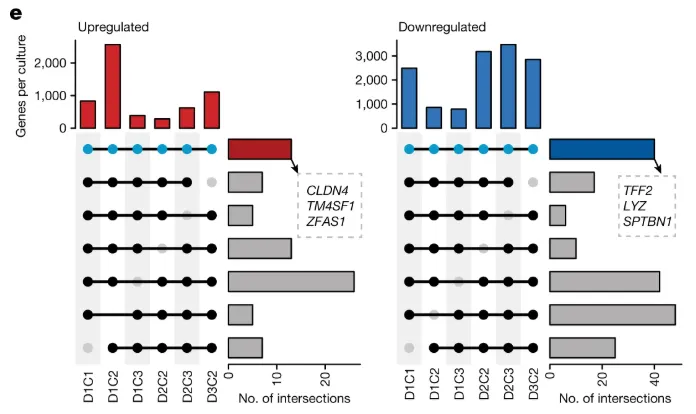
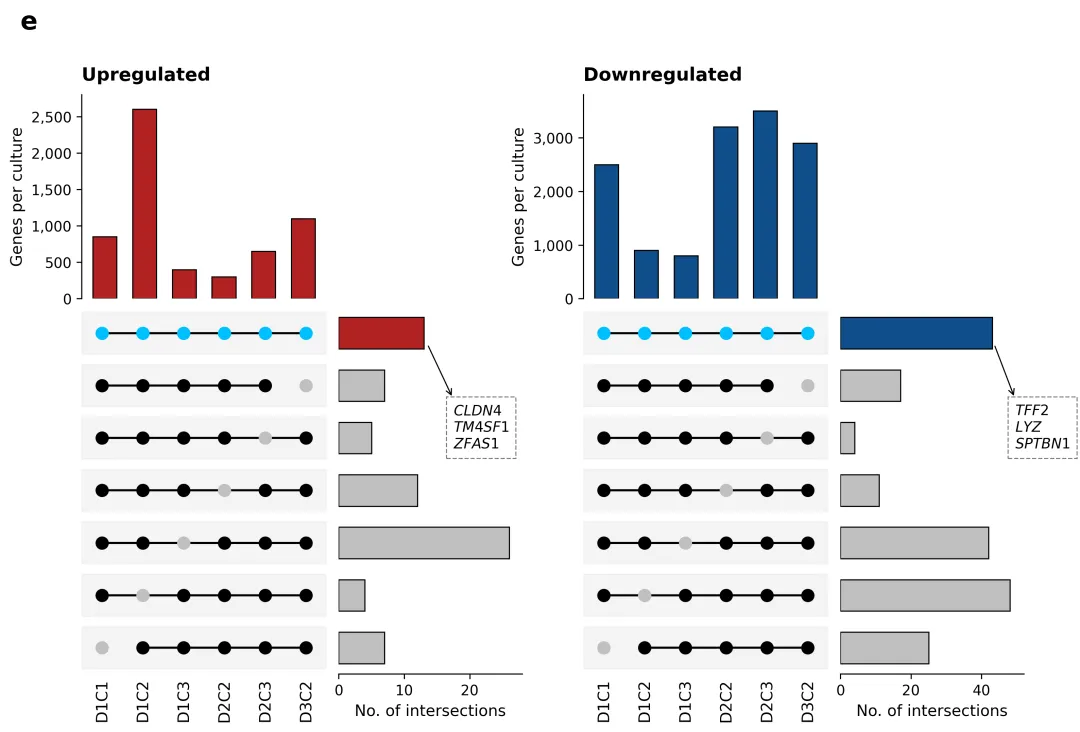
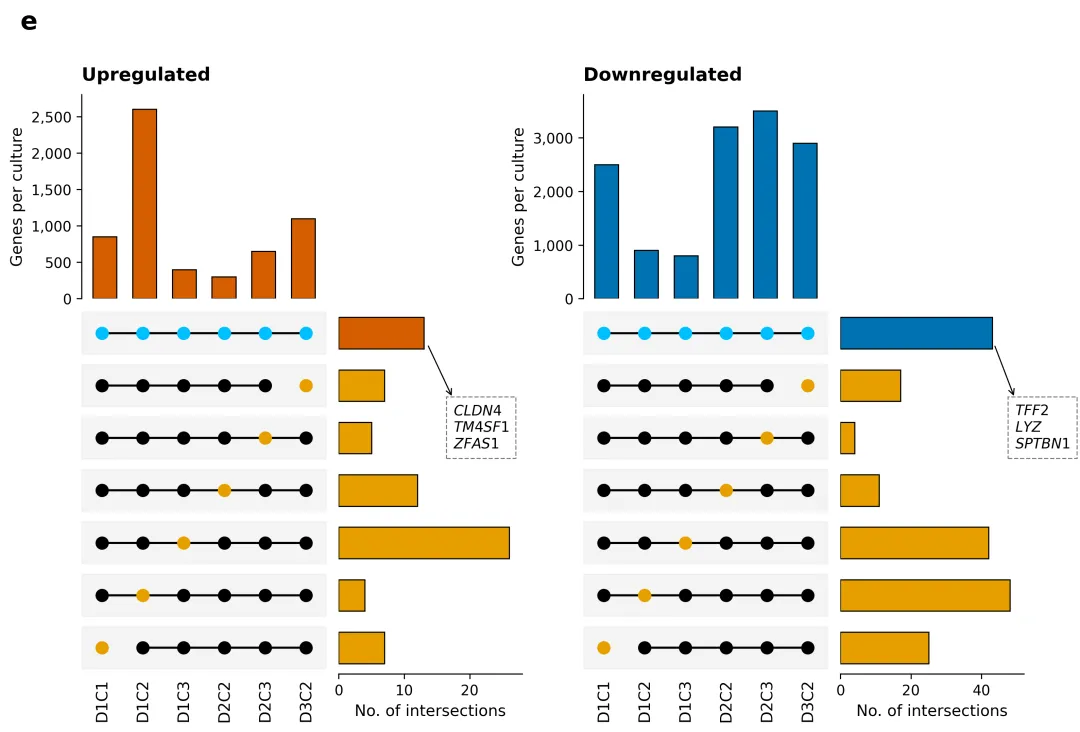
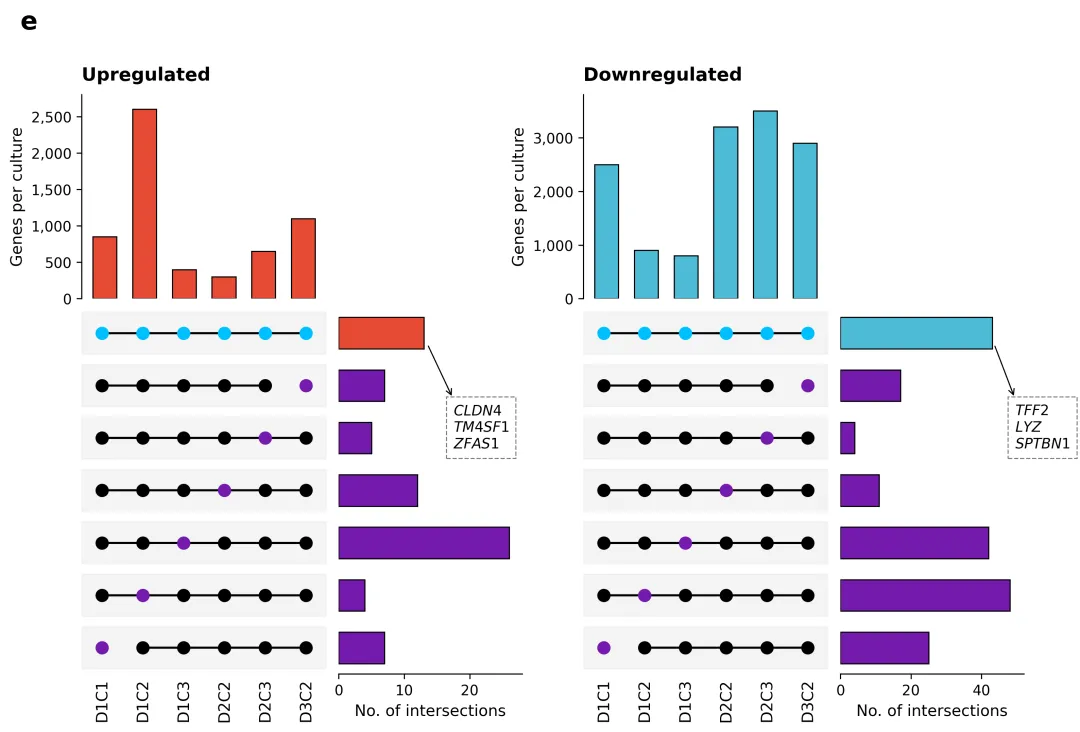
import osimport pandas as pdimport numpy as npimport matplotlib.pyplot as pltos.makedirs('图表', exist_ok=True)if not os.path.exists('data.xlsx'): raise FileNotFoundError("未在同目录下找到 data.xlsx 文件,请确保数据文件已生成。")df_culture = pd.read_excel('data.xlsx', sheet_name='culture_genes')df_inter_up = pd.read_excel('data.xlsx', sheet_name='intersection_up')df_inter_down = pd.read_excel('data.xlsx', sheet_name='intersection_down')samples = df_culture['Culture'].tolist()# 20种专业科研配色方案COLOR_PALETTES = { 1: {'up': '#B22222', 'down': '#104E8B', 'gray': '#C0C0C0'}, # 经典红蓝:Nature/Science高频使用,对比鲜明}# 当前选择:方案 1SELECTED_PALETTE_INDEX = 1palette = COLOR_PALETTES[SELECTED_PALETTE_INDEX]color_up_main = palette['up']color_down_main = palette['down']color_gray = palette['gray']color_dot_bg = '#EAEAEA'color_blue_dot = '#00BFFF'fig = plt.figure(figsize=(12, 8), dpi=300)def draw_upset_sub(fig, rect_top, rect_matrix, rect_side, df_inter, culture_vals, is_up=True): main_color = color_up_main if is_up else color_down_main ax_top = fig.add_axes(rect_top) ax_top.bar(samples, culture_vals, color=main_color, width=0.6, edgecolor='black', linewidth=0.8) ax_top.set_ylabel('Genes per culture', fontsize=11) ax_top.set_title('Upregulated' if is_up else 'Downregulated', fontsize=13, loc='left', pad=10, weight='bold') ax_top.spines['top'].set_visible(False) ax_top.spines['right'].set_visible(False) ax_top.spines['bottom'].set_visible(False) ax_top.tick_params(axis='x', which='both', bottom=False, top=False, labelbottom=False) ax_top.tick_params(axis='y', labelsize=10) ax_top.yaxis.set_major_formatter(plt.FuncFormatter(lambda x, loc: "{:,}".format(int(x)))) ax_top.set_ylim(0, 2800 if is_up else 3800) ax_matrix = fig.add_axes(rect_matrix) n_rows = len(df_inter) n_cols = len(samples) for i in range(n_rows): ax_matrix.axhspan(i - 0.4, i + 0.4, color=color_dot_bg, alpha=0.5, zorder=0) row_status = [df_inter.iloc[i][col] for col in samples] active_idx = [j for j, val in enumerate(row_status) if val == 1] if len(active_idx) > 1: ax_matrix.plot([active_idx[0], active_idx[-1]], [i, i], color='black', linewidth=1.5, zorder=1) for j in range(n_cols): if row_status[j] == 1: dot_color = color_blue_dot if i == 0 else 'black' ax_matrix.scatter(j, i, color=dot_color, s=70, zorder=2) else: ax_matrix.scatter(j, i, color=color_gray, s=70, zorder=2) ax_matrix.set_xlim(-0.5, n_cols - 0.5) ax_matrix.set_ylim(-0.5, n_rows - 0.5) ax_matrix.set_xticks(range(n_cols)) ax_matrix.set_xticklabels(samples, rotation=90, fontsize=11) ax_matrix.set_yticks([]) for spine in ax_matrix.spines.values(): spine.set_visible(False) ax_matrix.tick_params(axis='both', which='both', length=0) ax_matrix.invert_yaxis() ax_side = fig.add_axes(rect_side) sizes = df_inter['Intersection_Size'].tolist() colors_side = [main_color] + [color_gray] * (n_rows - 1) ax_side.barh(range(n_rows), sizes, color=colors_side, height=0.6, edgecolor='black', linewidth=0.8) ax_side.set_xlabel('No. of intersections', fontsize=11) ax_side.set_ylim(-0.5, n_rows - 0.5) ax_side.spines['top'].set_visible(False) ax_side.spines['right'].set_visible(False) ax_side.spines['left'].set_visible(False) ax_side.set_yticks([]) ax_side.tick_params(axis='y', which='both', left=False, right=False, labelleft=False) ax_side.tick_params(axis='x', labelsize=10) ax_side.invert_yaxis() target_y = 1.8 if is_up: ax_side.set_xlim(0, 28) ax_side.annotate('', xy=(sizes[0] + 4.45, target_y - 0.55), xytext=(sizes[0] + 0.5, 0.2), arrowprops=dict(arrowstyle="->", color="black", lw=0.8), zorder=5) text_up = "$CLDN4$\n$TM4SF1$\n$ZFAS1$" ax_side.text(sizes[0] + 4.5, target_y, text_up, bbox=dict(boxstyle="square,pad=0.5", fc="white", ec="gray", ls="--", lw=0.8), fontsize=10, va='center', style='italic', zorder=4) else: ax_side.set_xlim(0, 52) ax_side.annotate('', xy=(sizes[0] + 6.45, target_y - 0.55), xytext=(sizes[0] + 0.5, 0.2), arrowprops=dict(arrowstyle="->", color="black", lw=0.8), zorder=5) text_down = "$TFF2$\n$LYZ$\n$SPTBN1$" ax_side.text(sizes[0] + 6.5, target_y, text_down, bbox=dict(boxstyle="square,pad=0.5", fc="white", ec="gray", ls="--", lw=0.8), fontsize=10, va='center', style='italic', zorder=4)rect_up_top = [0.06, 0.61, 0.20, 0.25]rect_up_matrix = [0.06, 0.15, 0.20, 0.45]rect_up_side = [0.27, 0.15, 0.15, 0.45]rect_down_top = [0.47, 0.61, 0.20, 0.25]rect_down_matrix = [0.47, 0.15, 0.20, 0.45]rect_down_side = [0.68, 0.15, 0.15, 0.45]draw_upset_sub(fig, rect_up_top, rect_up_matrix, rect_up_side, df_inter_up, df_culture['Upregulated_Genes'], is_up=True)draw_upset_sub(fig, rect_down_top, rect_down_matrix, rect_down_side, df_inter_down, df_culture['Downregulated_Genes'], is_up=False)fig.text(0.01, 0.94, 'e', fontsize=18, weight='bold')output_file = '图表/intersection_upset_plot.png'plt.savefig(output_file, bbox_inches='tight', dpi=300)plt.close()print(f"绘图完成。图片已保存至: {output_file}")


 10个月宝宝每天需要喝多少奶粉?
