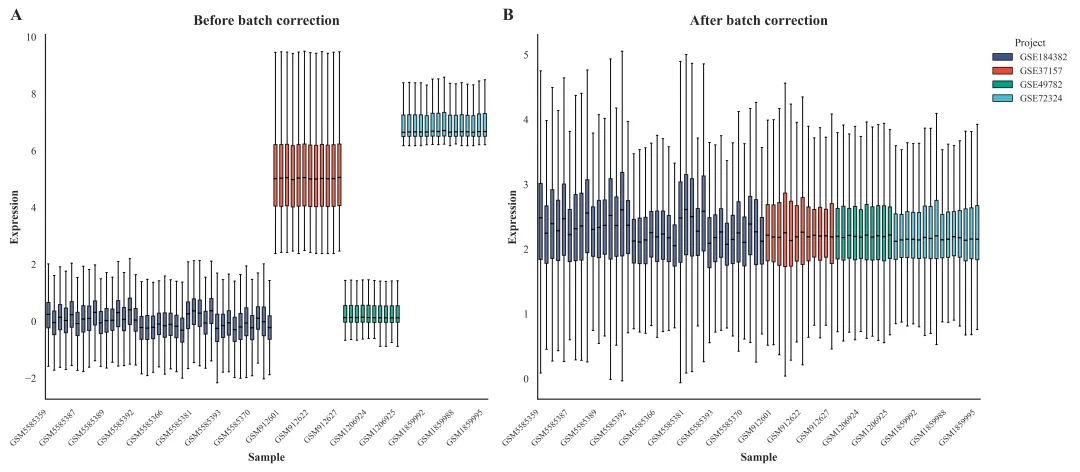
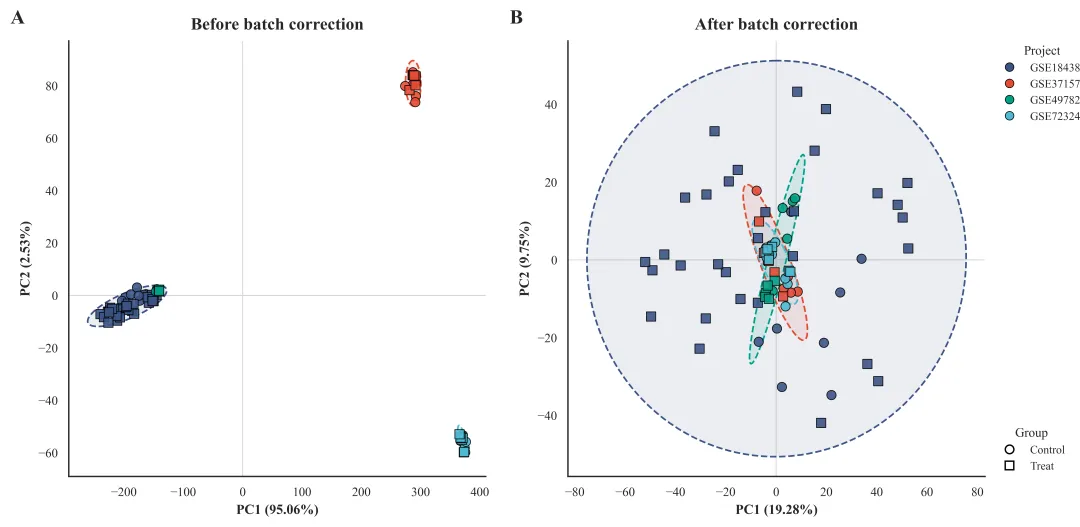
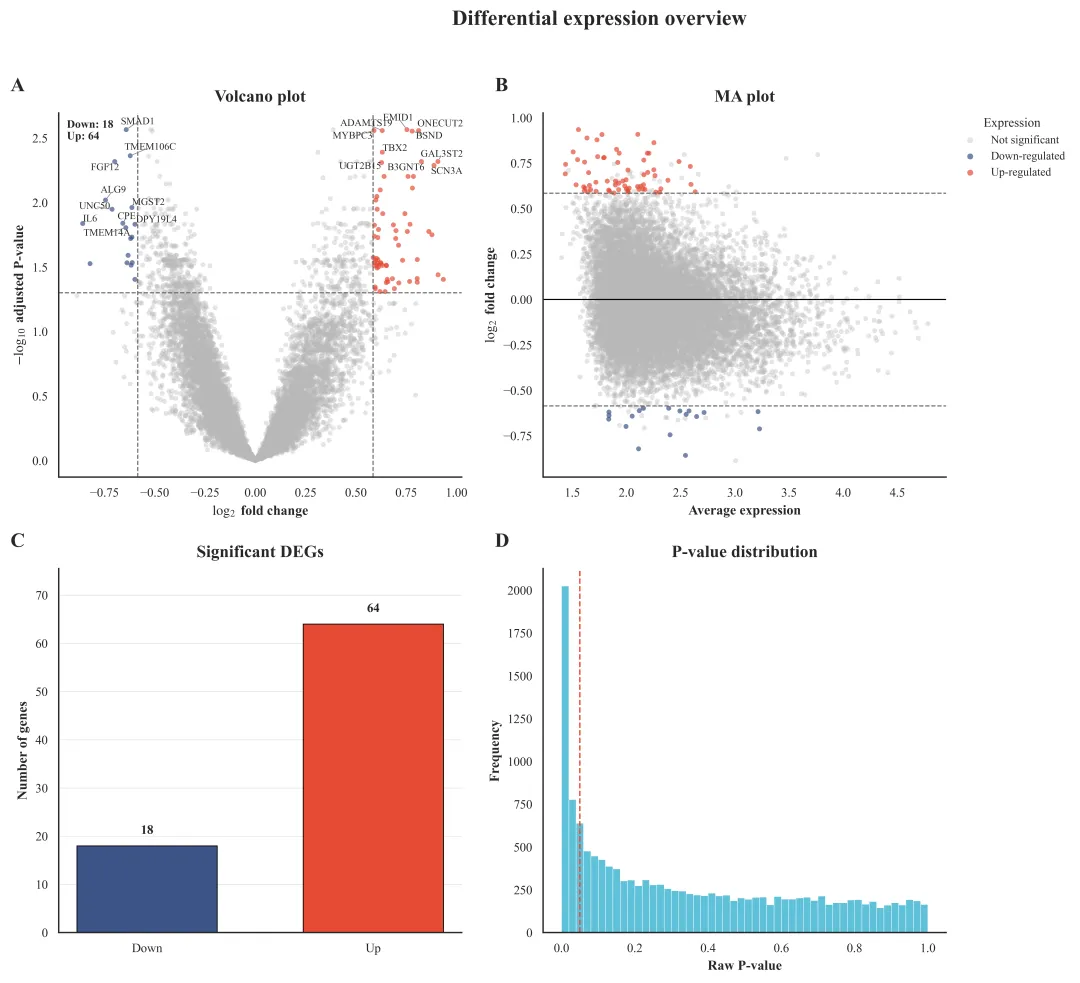
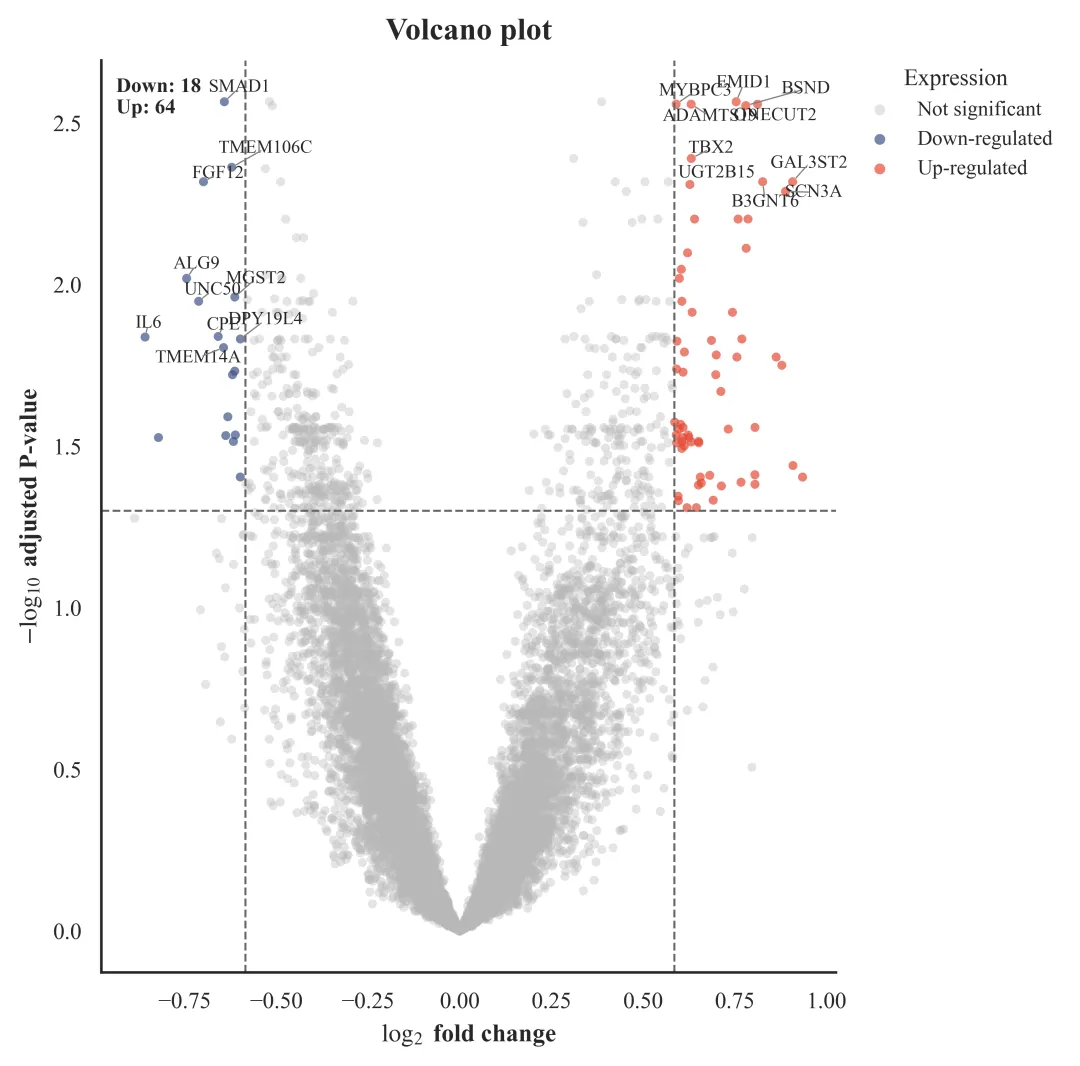
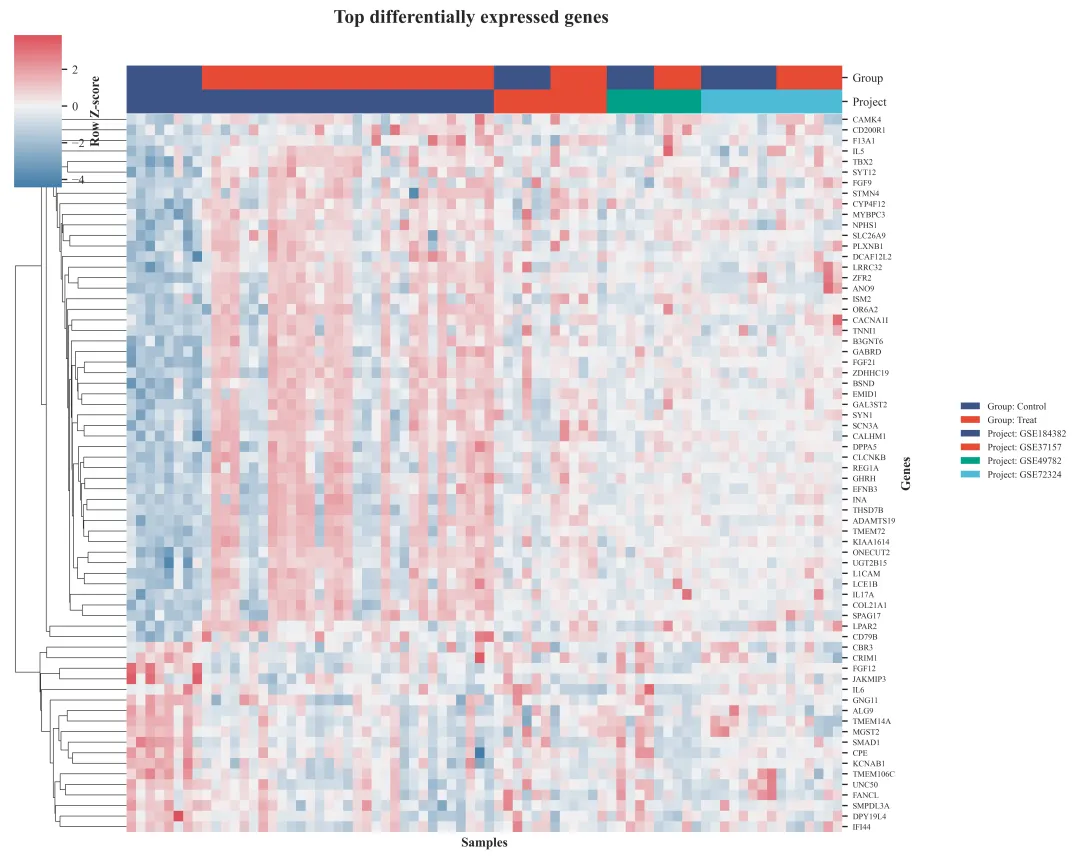
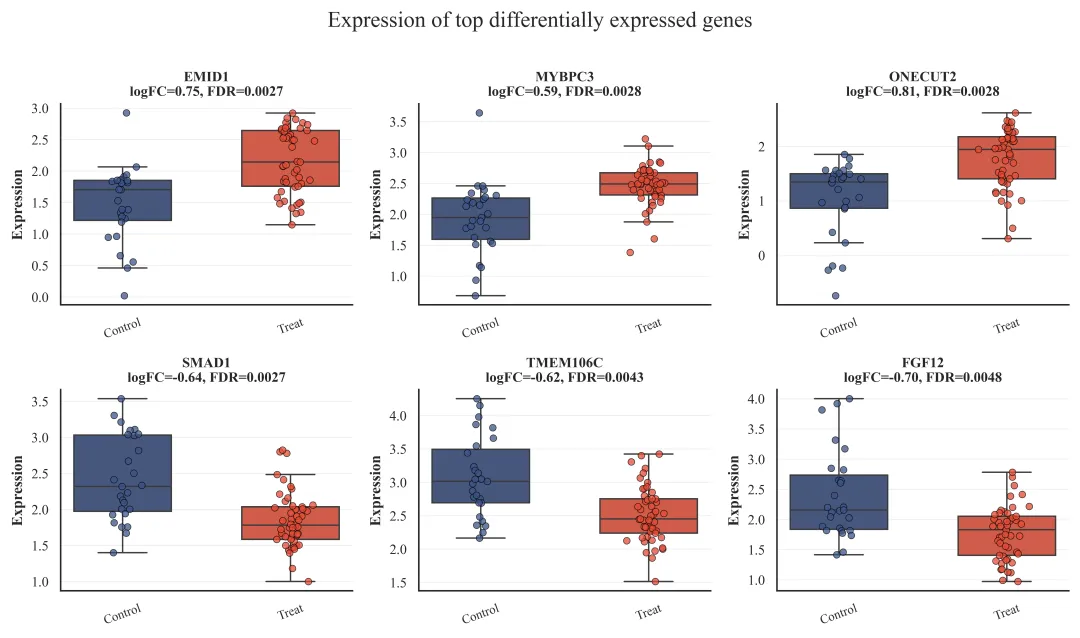
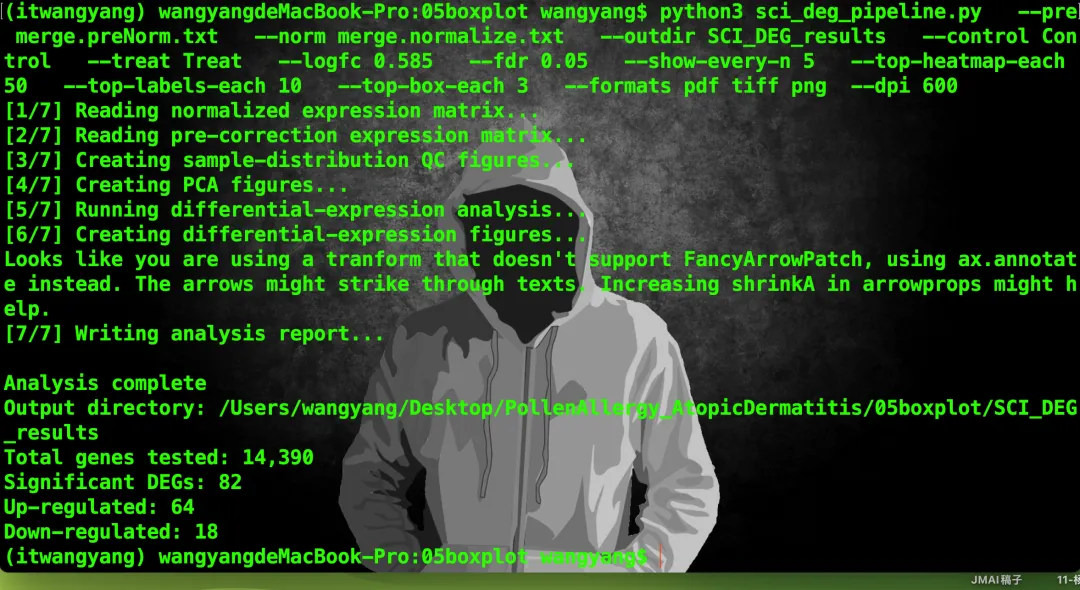
#!/usr/bin/env python3# -*- coding: utf-8 -*-"""Integrated transcriptomic QC and differential-expression pipeline.Main outputs------------1. Before/after sample-expression boxplots2. Before/after PCA plots (project color, phenotype marker, 95% ellipse)3. Differential-expression table using OLS with project covariates4. Volcano plot, MA plot, DEG summary, P-value distribution5. Top-DEG heatmap and top-gene expression boxplots6. Publication-ready PDF/PNG/TIFF/SVG figures with Times New RomanExpected sample name format---------------------------Project_Sample_GroupExamples:GSE37157_GSM123456_ControlGSE37157_GSM123457_TreatThe parser uses the first underscore-delimited field as Project, the last fieldas Group, and everything in between as Sample."""from __future__ import annotationsimport argparseimport jsonimport mathimport reimport sysimport warningsfrom dataclasses import dataclassfrom pathlib import Pathfrom typing import Dict, Iterable, List, Optional, Sequence, Tupleimport matplotlib as mplimport matplotlib.pyplot as pltfrom matplotlib.lines import Line2Dfrom matplotlib.patches import Ellipse, Patchfrom matplotlib import font_managerimport numpy as npimport pandas as pdimport seaborn as snsfrom scipy.stats import chi2, t as student_tfrom sklearn.decomposition import PCAfrom sklearn.preprocessing import StandardScalerfrom statsmodels.stats.multitest import multipleteststry: from adjustText import adjust_textexcept ImportError: # optional dependency adjust_text = None# =============================================================================# Configuration# =============================================================================NPG_COLORS = [ "#3C5488", # blue "#E64B35", # red "#00A087", # green "#4DBBD5", # cyan "#F39B7F", # salmon "#8491B4", # slate "#91D1C2", # mint "#DC0000", # deep red "#7E6148", # brown "#B09C85", # taupe]REGULATION_COLORS = { "Up-regulated": "#E64B35", "Down-regulated": "#3C5488", "Not significant": "#B8B8B8",}GROUP_MARKERS = ["o", "s", "^", "D", "P", "X", "v", "<", ">", "h"]@dataclassclass PipelineConfig: pre_file: Optional[Path] norm_file: Path outdir: Path control: str = "Control" treat: str = "Treat" logfc_cutoff: float = 0.585 fdr_cutoff: float = 0.05 top_heatmap_each: int = 50 top_labels_each: int = 10 top_box_each: int = 3 pca_top_variable_genes: int = 5000 show_every_n: Optional[int] = None auto_log2: bool = True max_missing_fraction: float = 0.20 formats: Tuple[str, ...] = ("pdf", "png") raster_dpi: int = 600 seed: int = 2026# =============================================================================# Style and utility functions# =============================================================================def configure_publication_style() -> None: """Configure a clean, journal-style visual theme.""" try: font_manager.findfont("Times New Roman", fallback_to_default=False) except Exception: warnings.warn( "Times New Roman was not found on this system. Matplotlib will use " "a serif fallback. Install/enable Times New Roman for exact output.", RuntimeWarning, ) sns.set_theme(style="white", context="paper") mpl.rcParams.update( { "font.family": "Times New Roman", "font.size": 10, "font.weight": "normal", "axes.labelweight": "bold", "axes.titleweight": "bold", "axes.linewidth": 1.0, "axes.spines.top": False, "axes.spines.right": False, "xtick.major.width": 1.0, "ytick.major.width": 1.0, "xtick.major.size": 4.0, "ytick.major.size": 4.0, "legend.frameon": False, "pdf.fonttype": 42, "ps.fonttype": 42, "svg.fonttype": "none", "mathtext.fontset": "stix", "savefig.facecolor": "white", "figure.facecolor": "white", } )def ensure_dirs(outdir: Path) -> Dict[str, Path]: paths = { "root": outdir, "figures": outdir / "figures", "results": outdir / "results", "logs": outdir / "logs", } for path in paths.values(): path.mkdir(parents=True, exist_ok=True) return pathsdef save_figure( fig: mpl.figure.Figure, stem: Path, formats: Sequence[str], raster_dpi: int = 600, close: bool = True,) -> None: """Save vector and/or raster versions using consistent settings.""" stem.parent.mkdir(parents=True, exist_ok=True) for fmt in formats: fmt = fmt.lower().lstrip(".") output = stem.with_suffix(f".{fmt}") kwargs = {"bbox_inches": "tight", "facecolor": "white"} if fmt in {"png", "tif", "tiff", "jpg", "jpeg"}: kwargs["dpi"] = raster_dpi fig.savefig(output, **kwargs) if close: plt.close(fig)def make_palette(categories: Iterable[str]) -> Dict[str, str]: cats = list(dict.fromkeys(map(str, categories))) if len(cats) <= len(NPG_COLORS): colors = NPG_COLORS[: len(cats)] else: colors = [mpl.colors.to_hex(c) for c in sns.color_palette("husl", len(cats))] return dict(zip(cats, colors))def make_marker_map(categories: Iterable[str]) -> Dict[str, str]: cats = list(dict.fromkeys(map(str, categories))) return {cat: GROUP_MARKERS[i % len(GROUP_MARKERS)] for i, cat in enumerate(cats)}def sparse_xticks(labels: Sequence[str], step: Optional[int] = None) -> Tuple[List[int], List[str]]: n = len(labels) if step is None: if n <= 20: step = 1 elif n <= 40: step = 2 elif n <= 80: step = 5 elif n <= 120: step = 8 else: step = 10 positions = list(range(1, n + 1, max(1, step))) tick_labels = [labels[i - 1] for i in positions] return positions, tick_labelsdef resolve_label(values: Sequence[str], requested: str) -> str: """Resolve a group label case-insensitively while preserving original text.""" unique = list(dict.fromkeys(map(str, values))) if requested in unique: return requested matches = [x for x in unique if x.lower() == requested.lower()] if len(matches) == 1: return matches[0] raise ValueError( f"Group label '{requested}' not found. Available groups: {', '.join(unique)}" )# =============================================================================# Data loading and metadata# =============================================================================def parse_sample_metadata(sample_names: Sequence[str]) -> pd.DataFrame: rows = [] pattern = re.compile(r"^(?P<Project>[^_]+)_(?P<Sample>.+)_(?P<Group>[^_]+)$") for original in map(str, sample_names): match = pattern.match(original) if match is None: raise ValueError( "Unable to parse sample name: " f"'{original}'. Expected format: Project_Sample_Group" ) rows.append( { "Original": original, "Project": match.group("Project"), "Sample": match.group("Sample"), "Group": match.group("Group"), } ) meta = pd.DataFrame(rows).set_index("Original", drop=False) if meta.index.duplicated().any(): duplicates = meta.index[meta.index.duplicated()].tolist() raise ValueError(f"Duplicated sample names detected: {duplicates[:5]}") return metadef _auto_log2_transform(expr: pd.DataFrame) -> Tuple[pd.DataFrame, bool]: values = expr.to_numpy(dtype=float) finite = values[np.isfinite(values)] if finite.size == 0: return expr, False q01, q50, q99 = np.nanpercentile(finite, [1, 50, 99]) needs_log = (q99 > 100) or ((q99 - q01) > 50 and q50 > 10) if not needs_log: return expr, False min_value = np.nanmin(finite) shift = 1.0 - min_value if min_value <= 0 else 0.0 transformed = np.log2(expr + shift) return transformed, Truedef read_expression( path: Path, auto_log2: bool = True, max_missing_fraction: float = 0.20,) -> Tuple[pd.DataFrame, pd.DataFrame, Dict[str, object]]: """Read genes x samples expression matrix and perform conservative cleaning.""" if not path.exists(): raise FileNotFoundError(f"Input file not found: {path}") expr = pd.read_csv(path, sep="\t", header=0, index_col=0) expr.index = expr.index.astype(str) expr.columns = expr.columns.astype(str) expr = expr.apply(pd.to_numeric, errors="coerce") expr = expr.replace([np.inf, -np.inf], np.nan) initial_shape = expr.shape missing_fraction = expr.isna().mean(axis=1) expr = expr.loc[missing_fraction <= max_missing_fraction].copy() if expr.isna().any().any(): row_medians = expr.median(axis=1) expr = expr.T.fillna(row_medians).T # Average duplicated gene/probe identifiers. expr = expr.groupby(level=0, sort=False).mean() # Remove genes with no variation; they do not contribute to PCA or testing. variances = expr.var(axis=1, ddof=1) expr = expr.loc[variances.fillna(0) > 0].copy() log2_applied = False if auto_log2: expr, log2_applied = _auto_log2_transform(expr) metadata = parse_sample_metadata(expr.columns) info = { "file": str(path), "initial_genes": int(initial_shape[0]), "initial_samples": int(initial_shape[1]), "final_genes": int(expr.shape[0]), "final_samples": int(expr.shape[1]), "log2_applied": bool(log2_applied), "max_missing_fraction": float(max_missing_fraction), } return expr, metadata, info# =============================================================================# PCA and confidence ellipses# =============================================================================def add_confidence_ellipse( ax: mpl.axes.Axes, x: np.ndarray, y: np.ndarray, color: str, level: float = 0.95,) -> None: if len(x) < 3 or len(y) < 3: return cov = np.cov(x, y) if not np.all(np.isfinite(cov)): return eigenvalues, eigenvectors = np.linalg.eigh(cov) if np.any(eigenvalues <= 0): return order = np.argsort(eigenvalues)[::-1] eigenvalues = eigenvalues[order] eigenvectors = eigenvectors[:, order] angle = np.degrees(np.arctan2(eigenvectors[1, 0], eigenvectors[0, 0])) radius = math.sqrt(chi2.ppf(level, df=2)) width, height = 2 * radius * np.sqrt(eigenvalues) ellipse = Ellipse( xy=(np.mean(x), np.mean(y)), width=width, height=height, angle=angle, facecolor=mpl.colors.to_rgba(color, 0.10), edgecolor=color, linewidth=1.2, linestyle="--", zorder=1, ) ax.add_patch(ellipse)def calculate_pca( expr: pd.DataFrame, metadata: pd.DataFrame, top_variable_genes: int = 5000,) -> Tuple[pd.DataFrame, np.ndarray]: variances = expr.var(axis=1).sort_values(ascending=False) selected = variances.head(min(top_variable_genes, len(variances))).index matrix = expr.loc[selected].T # Center genes but do not scale each gene to unit variance by default. centered = StandardScaler(with_mean=True, with_std=False).fit_transform(matrix) pca = PCA(n_components=2, random_state=0) scores = pca.fit_transform(centered) explained = pca.explained_variance_ratio_ * 100 result = metadata.copy() result["PC1"] = scores[:, 0] result["PC2"] = scores[:, 1] return result, explaineddef plot_pca( ax: mpl.axes.Axes, expr: pd.DataFrame, metadata: pd.DataFrame, title: str, project_palette: Dict[str, str], group_markers: Dict[str, str], top_variable_genes: int = 5000, show_legend: bool = True,) -> pd.DataFrame: pca_df, explained = calculate_pca(expr, metadata, top_variable_genes) for project in pca_df["Project"].drop_duplicates(): project_df = pca_df[pca_df["Project"] == project] for group in project_df["Group"].drop_duplicates(): subset = project_df[project_df["Group"] == group] ax.scatter( subset["PC1"], subset["PC2"], s=42, c=project_palette[project], marker=group_markers[group], edgecolors="black", linewidths=0.55, alpha=0.90, zorder=3, ) add_confidence_ellipse( ax, project_df["PC1"].to_numpy(), project_df["PC2"].to_numpy(), color=project_palette[project], level=0.95, ) ax.axhline(0, color="#D9D9D9", linewidth=0.7, zorder=0) ax.axvline(0, color="#D9D9D9", linewidth=0.7, zorder=0) ax.set_xlabel(f"PC1 ({explained[0]:.2f}%)") ax.set_ylabel(f"PC2 ({explained[1]:.2f}%)") ax.set_title(title, fontsize=12, pad=8) ax.grid(False) if show_legend: project_handles = [ Line2D( [0], [0], marker="o", linestyle="none", markersize=6, markerfacecolor=project_palette[p], markeredgecolor="black", markeredgewidth=0.5, label=p, ) for p in project_palette ] group_handles = [ Line2D( [0], [0], marker=group_markers[g], linestyle="none", markersize=6, markerfacecolor="white", markeredgecolor="black", label=g, ) for g in group_markers ] first = ax.legend( handles=project_handles, title="Project", loc="upper left", bbox_to_anchor=(1.02, 1.00), borderaxespad=0, fontsize=8, title_fontsize=9, ) ax.add_artist(first) ax.legend( handles=group_handles, title="Group", loc="lower left", bbox_to_anchor=(1.02, 0.00), borderaxespad=0, fontsize=8, title_fontsize=9, ) return pca_df# =============================================================================# QC boxplots# =============================================================================def plot_sample_boxplot( ax: mpl.axes.Axes, expr: pd.DataFrame, metadata: pd.DataFrame, title: str, project_palette: Dict[str, str], show_every_n: Optional[int] = None, show_legend: bool = True,) -> None: sample_order = metadata.index.tolist() values = [expr[sample].dropna().to_numpy() for sample in sample_order] colors = [project_palette[metadata.loc[sample, "Project"]] for sample in sample_order] box = ax.boxplot( values, patch_artist=True, notch=False, showfliers=False, widths=0.55, medianprops={"color": "black", "linewidth": 1.0}, whiskerprops={"color": "black", "linewidth": 0.8}, capprops={"color": "black", "linewidth": 0.8}, boxprops={"edgecolor": "black", "linewidth": 0.8}, ) for patch, color in zip(box["boxes"], colors): patch.set_facecolor(color) patch.set_alpha(0.82) positions, labels = sparse_xticks(metadata["Sample"].tolist(), show_every_n) ax.set_xticks(positions) ax.set_xticklabels(labels, rotation=45, ha="right", fontsize=7) ax.set_xlabel("Sample") ax.set_ylabel("Expression") ax.set_title(title, fontsize=12, pad=8) ax.grid(False) if show_legend: handles = [ Patch(facecolor=project_palette[p], edgecolor="black", linewidth=0.6, label=p) for p in project_palette ] ax.legend( handles=handles, title="Project", loc="upper left", bbox_to_anchor=(1.02, 1.00), borderaxespad=0, fontsize=8, title_fontsize=9, )# =============================================================================# Differential-expression analysis# =============================================================================def prepare_two_group_data( expr: pd.DataFrame, metadata: pd.DataFrame, control: str, treat: str,) -> Tuple[pd.DataFrame, pd.DataFrame, str, str]: control_resolved = resolve_label(metadata["Group"], control) treat_resolved = resolve_label(metadata["Group"], treat) if control_resolved == treat_resolved: raise ValueError("Control and treatment groups must be different.") keep = metadata["Group"].isin([control_resolved, treat_resolved]) excluded = metadata.loc[~keep, "Group"].drop_duplicates().tolist() if excluded: warnings.warn( "The following groups are excluded from two-group differential analysis: " + ", ".join(excluded), RuntimeWarning, ) meta = metadata.loc[keep].copy() expression = expr.loc[:, meta.index].copy() return expression, meta, control_resolved, treat_resolveddef differential_expression_ols( expr: pd.DataFrame, metadata: pd.DataFrame, control: str, treat: str,) -> Tuple[pd.DataFrame, pd.DataFrame]: """ Per-gene OLS model: expression ~ intercept + treatment + project covariates The treatment coefficient is the log2 fold change (Treat - Control) when the expression matrix is on the log2 scale. """ expr, meta, control, treat = prepare_two_group_data(expr, metadata, control, treat) group_counts = meta["Group"].value_counts() if group_counts.get(control, 0) < 2 or group_counts.get(treat, 0) < 2: raise ValueError( f"At least two samples are required in each group. Counts: {group_counts.to_dict()}" ) design = pd.DataFrame(index=meta.index) design["Intercept"] = 1.0 design[f"{treat}_vs_{control}"] = (meta["Group"] == treat).astype(float) project_dummies = pd.get_dummies( meta["Project"], prefix="Project", drop_first=True, dtype=float ) design = pd.concat([design, project_dummies], axis=1) x = design.to_numpy(dtype=float) rank = np.linalg.matrix_rank(x) if rank < x.shape[1]: cross_tab = pd.crosstab(meta["Project"], meta["Group"]) raise ValueError( "The design matrix is rank deficient. Group and project may be fully " "confounded, so the treatment effect cannot be separated from batch.\n" f"Project x Group table:\n{cross_tab.to_string()}" ) n_samples, n_parameters = x.shape df_residual = n_samples - n_parameters if df_residual <= 0: raise ValueError( f"Insufficient residual degrees of freedom: samples={n_samples}, " f"parameters={n_parameters}." ) y = expr.T.to_numpy(dtype=float) # samples x genes xtx_inv = np.linalg.inv(x.T @ x) beta = xtx_inv @ x.T @ y residuals = y - x @ beta sigma2 = np.sum(residuals**2, axis=0) / df_residual treatment_index = 1 standard_error = np.sqrt(np.maximum(sigma2, 0) * xtx_inv[treatment_index, treatment_index]) logfc = beta[treatment_index, :] with np.errstate(divide="ignore", invalid="ignore"): t_stat = logfc / standard_error p_values = 2 * student_t.sf(np.abs(t_stat), df=df_residual) p_values = np.nan_to_num(p_values, nan=1.0, posinf=0.0, neginf=0.0) adjusted = multipletests(p_values, alpha=0.05, method="fdr_bh")[1] result = pd.DataFrame( { "Gene": expr.index, "logFC": logfc, "AveExpr": np.mean(y, axis=0), "SE": standard_error, "t": t_stat, "P.Value": p_values, "adj.P.Val": adjusted, "df_residual": df_residual, } ).set_index("Gene") result = result.sort_values(["adj.P.Val", "P.Value", "logFC"], ascending=[True, True, False]) return result, designdef classify_degs( result: pd.DataFrame, logfc_cutoff: float, fdr_cutoff: float,) -> pd.DataFrame: classified = result.copy() classified["Significance"] = "Not significant" up_mask = (classified["logFC"] > logfc_cutoff) & ( classified["adj.P.Val"] < fdr_cutoff ) down_mask = (classified["logFC"] < -logfc_cutoff) & ( classified["adj.P.Val"] < fdr_cutoff ) classified.loc[up_mask, "Significance"] = "Up-regulated" classified.loc[down_mask, "Significance"] = "Down-regulated" return classified# =============================================================================# DEG visualizations# =============================================================================def _scatter_by_significance( ax: mpl.axes.Axes, data: pd.DataFrame, x: str, y: str, point_size: float = 11,) -> None: order = ["Not significant", "Down-regulated", "Up-regulated"] for category in order: subset = data[data["Significance"] == category] ax.scatter( subset[x], subset[y], s=point_size, color=REGULATION_COLORS[category], alpha=0.70 if category != "Not significant" else 0.38, edgecolors="none", rasterized=True, label=category, )def plot_volcano( ax: mpl.axes.Axes, result: pd.DataFrame, logfc_cutoff: float, fdr_cutoff: float, top_labels_each: int = 10, show_legend: bool = True,) -> None: plot_df = result.copy() tiny = np.finfo(float).tiny plot_df["minus_log10_fdr"] = -np.log10(plot_df["adj.P.Val"].clip(lower=tiny)) _scatter_by_significance(ax, plot_df, "logFC", "minus_log10_fdr", point_size=12) ax.axvline(-logfc_cutoff, linestyle="--", color="#666666", linewidth=0.8) ax.axvline(logfc_cutoff, linestyle="--", color="#666666", linewidth=0.8) ax.axhline(-math.log10(fdr_cutoff), linestyle="--", color="#666666", linewidth=0.8) up = plot_df[plot_df["Significance"] == "Up-regulated"].nsmallest( top_labels_each, "adj.P.Val" ) down = plot_df[plot_df["Significance"] == "Down-regulated"].nsmallest( top_labels_each, "adj.P.Val" ) labels = pd.concat([up, down]) texts = [] for gene, row in labels.iterrows(): texts.append( ax.text( row["logFC"], row["minus_log10_fdr"], str(gene), fontsize=7, ha="center", va="bottom", ) ) if adjust_text is not None and texts: adjust_text( texts, ax=ax, arrowprops={"arrowstyle": "-", "color": "#808080", "lw": 0.5}, expand_points=(1.2, 1.3), expand_text=(1.1, 1.2), force_text=(0.2, 0.3), ) counts = plot_df["Significance"].value_counts() ax.text( 0.02, 0.98, f"Down: {counts.get('Down-regulated', 0):,}\n" f"Up: {counts.get('Up-regulated', 0):,}", transform=ax.transAxes, ha="left", va="top", fontsize=8, fontweight="bold", ) ax.set_xlabel(r"$\log_2$ fold change") ax.set_ylabel(r"$-\log_{10}$ adjusted P-value") ax.set_title("Volcano plot", fontsize=12, pad=8) ax.grid(False) if show_legend: ax.legend( title="Expression", loc="upper left", bbox_to_anchor=(1.02, 1.00), borderaxespad=0, fontsize=8, title_fontsize=9, markerscale=1.2, )def plot_ma( ax: mpl.axes.Axes, result: pd.DataFrame, logfc_cutoff: float, show_legend: bool = True,) -> None: _scatter_by_significance(ax, result, "AveExpr", "logFC", point_size=12) ax.axhline(0, color="black", linewidth=0.8) ax.axhline(logfc_cutoff, linestyle="--", color="#666666", linewidth=0.8) ax.axhline(-logfc_cutoff, linestyle="--", color="#666666", linewidth=0.8) ax.set_xlabel("Average expression") ax.set_ylabel(r"$\log_2$ fold change") ax.set_title("MA plot", fontsize=12, pad=8) ax.grid(False) if show_legend: ax.legend( title="Expression", loc="upper left", bbox_to_anchor=(1.02, 1.00), borderaxespad=0, fontsize=8, title_fontsize=9, markerscale=1.2, )def plot_deg_summary(ax: mpl.axes.Axes, result: pd.DataFrame) -> None: counts = result["Significance"].value_counts() categories = ["Down-regulated", "Up-regulated"] values = [counts.get(cat, 0) for cat in categories] bars = ax.bar( ["Down", "Up"], values, color=[REGULATION_COLORS[c] for c in categories], width=0.62, edgecolor="black", linewidth=0.6, ) ymax = max(values) if max(values, default=0) > 0 else 1 for bar, value in zip(bars, values): ax.text( bar.get_x() + bar.get_width() / 2, value + ymax * 0.03, f"{value:,}", ha="center", va="bottom", fontsize=9, fontweight="bold", ) ax.set_ylim(0, ymax * 1.18) ax.set_ylabel("Number of genes") ax.set_title("Significant DEGs", fontsize=12, pad=8) ax.grid(axis="y", color="#E6E6E6", linewidth=0.6) ax.set_axisbelow(True)def plot_pvalue_distribution(ax: mpl.axes.Axes, result: pd.DataFrame) -> None: ax.hist( result["P.Value"].dropna(), bins=50, color="#4DBBD5", edgecolor="white", linewidth=0.35, alpha=0.90, ) ax.axvline(0.05, linestyle="--", color="#E64B35", linewidth=1.0) ax.set_xlabel("Raw P-value") ax.set_ylabel("Frequency") ax.set_title("P-value distribution", fontsize=12, pad=8) ax.grid(False)def select_top_degs( result: pd.DataFrame, each_direction: int,) -> Tuple[List[str], List[str]]: up = result[result["Significance"] == "Up-regulated"].nsmallest( each_direction, "adj.P.Val" ) down = result[result["Significance"] == "Down-regulated"].nsmallest( each_direction, "adj.P.Val" ) return up.index.tolist(), down.index.tolist()def plot_heatmap( expr: pd.DataFrame, metadata: pd.DataFrame, result: pd.DataFrame, output_stem: Path, formats: Sequence[str], raster_dpi: int, top_each: int, group_palette: Dict[str, str], project_palette: Dict[str, str],) -> None: up_genes, down_genes = select_top_degs(result, top_each) genes = up_genes + down_genes if not genes: warnings.warn("No significant genes available for heatmap; heatmap skipped.") return heat = expr.loc[genes, metadata.index].copy() row_std = heat.std(axis=1, ddof=0).replace(0, np.nan) heat_z = heat.sub(heat.mean(axis=1), axis=0).div(row_std, axis=0).fillna(0) col_colors = pd.DataFrame( { "Group": metadata["Group"].map(group_palette), "Project": metadata["Project"].map(project_palette), }, index=metadata.index, ) height = max(7.0, min(14.0, 3.5 + 0.075 * len(genes))) width = max(9.0, min(16.0, 5.5 + 0.055 * heat_z.shape[1])) grid = sns.clustermap( heat_z, cmap=sns.diverging_palette(240, 10, as_cmap=True), center=0, row_cluster=(len(genes) > 1), col_cluster=False, col_colors=col_colors, xticklabels=False, yticklabels=True, linewidths=0, figsize=(width, height), cbar_kws={"label": "Row Z-score"}, dendrogram_ratio=(0.14, 0.04), colors_ratio=(0.03, 0.03), ) grid.ax_heatmap.set_xlabel("Samples") grid.ax_heatmap.set_ylabel("Genes") grid.ax_heatmap.tick_params(axis="y", labelsize=6) grid.fig.suptitle( "Top differentially expressed genes", fontsize=14, fontweight="bold", y=1.01, ) legend_handles = [ Patch(facecolor=group_palette[g], edgecolor="none", label=f"Group: {g}") for g in group_palette ] + [ Patch(facecolor=project_palette[p], edgecolor="none", label=f"Project: {p}") for p in project_palette ] grid.fig.legend( handles=legend_handles, loc="center left", bbox_to_anchor=(1.005, 0.5), fontsize=7, frameon=False, ) for fmt in formats: fmt = fmt.lower().lstrip(".") kwargs = {"bbox_inches": "tight", "facecolor": "white"} if fmt in {"png", "tif", "tiff", "jpg", "jpeg"}: kwargs["dpi"] = raster_dpi grid.savefig(output_stem.with_suffix(f".{fmt}"), **kwargs) plt.close(grid.fig)def plot_top_gene_boxplots( expr: pd.DataFrame, metadata: pd.DataFrame, result: pd.DataFrame, output_stem: Path, formats: Sequence[str], raster_dpi: int, top_each: int, group_palette: Dict[str, str], seed: int,) -> None: up_genes, down_genes = select_top_degs(result, top_each) genes = up_genes + down_genes if not genes: warnings.warn("No significant genes available for top-gene boxplots; skipped.") return long_df = ( expr.loc[genes, metadata.index] .T .join(metadata[["Group", "Project"]]) .reset_index(names="Original") .melt( id_vars=["Original", "Group", "Project"], value_vars=genes, var_name="Gene", value_name="Expression", ) ) ncols = 3 nrows = math.ceil(len(genes) / ncols) fig, axes = plt.subplots( nrows, ncols, figsize=(3.2 * ncols, 2.75 * nrows), squeeze=False, ) rng = np.random.default_rng(seed) group_order = list(group_palette) for ax, gene in zip(axes.flat, genes): subset = long_df[long_df["Gene"] == gene] sns.boxplot( data=subset, x="Group", y="Expression", hue="Group", order=group_order, hue_order=group_order, palette=group_palette, dodge=False, legend=False, width=0.58, linewidth=0.9, fliersize=0, ax=ax, ) # Deterministic jitter, avoiding seaborn's version-dependent random state. for i, group in enumerate(group_order): vals = subset.loc[subset["Group"] == group, "Expression"].to_numpy() jitter = rng.normal(loc=i, scale=0.045, size=len(vals)) ax.scatter( jitter, vals, s=18, color=group_palette[group], edgecolors="black", linewidths=0.4, alpha=0.75, zorder=3, ) fc = result.loc[gene, "logFC"] fdr = result.loc[gene, "adj.P.Val"] ax.set_title(f"{gene}\nlogFC={fc:.2f}, FDR={fdr:.2g}", fontsize=9, pad=5) ax.set_xlabel("") ax.set_ylabel("Expression") ax.tick_params(axis="x", rotation=20, labelsize=8) ax.grid(axis="y", color="#ECECEC", linewidth=0.5) ax.set_axisbelow(True) for ax in axes.flat[len(genes) :]: ax.axis("off") fig.suptitle("Expression of top differentially expressed genes", fontsize=14, y=1.01) fig.tight_layout() save_figure(fig, output_stem, formats, raster_dpi)# =============================================================================# Output tables and report# =============================================================================def save_tables( expr: pd.DataFrame, metadata: pd.DataFrame, result: pd.DataFrame, design: pd.DataFrame, result_dir: Path, logfc_cutoff: float, fdr_cutoff: float, control: str, treat: str,) -> Dict[str, int]: significant = result[ (result["adj.P.Val"] < fdr_cutoff) & (result["logFC"].abs() > logfc_cutoff) ].copy() up = significant[significant["logFC"] > 0] down = significant[significant["logFC"] < 0] result.to_csv(result_dir / "all_genes.tsv", sep="\t", index=True) significant.to_csv(result_dir / "significant_genes.tsv", sep="\t", index=True) up.to_csv(result_dir / "upregulated_genes.tsv", sep="\t", index=True) down.to_csv(result_dir / "downregulated_genes.tsv", sep="\t", index=True) metadata.to_csv(result_dir / "sample_metadata.tsv", sep="\t", index=False) design.to_csv(result_dir / "design_matrix.tsv", sep="\t", index=True) # Preserve project identifiers and normalize only the terminal group suffix. renamed_columns = [] for original in expr.columns: group = metadata.loc[original, "Group"] suffix = "con" if group == control else "tre" if group == treat else group base = original.rsplit("_", 1)[0] renamed_columns.append(f"{base}_{suffix}") sig_matrix = expr.loc[significant.index].copy() sig_matrix.columns = renamed_columns sig_matrix.insert(0, "GeneName", sig_matrix.index) sig_matrix.to_csv(result_dir / "Sample_Type_Matrix.csv", index=False) all_matrix = expr.copy() all_matrix.columns = renamed_columns all_matrix.insert(0, "GeneName", all_matrix.index) all_matrix.to_csv(result_dir / "All_Gene_Sample_Type_Matrix.csv", index=False) return { "total_genes": int(len(result)), "significant_genes": int(len(significant)), "upregulated_genes": int(len(up)), "downregulated_genes": int(len(down)), }def write_report( path: Path, config: PipelineConfig, counts: Dict[str, int], input_info: Dict[str, object], design: pd.DataFrame,) -> None: report = { "analysis_method": ( "Per-gene ordinary least squares: expression ~ treatment + project covariates; " "Benjamini-Hochberg FDR correction" ), "contrast": f"{config.treat} - {config.control}", "log2_fold_change_cutoff": config.logfc_cutoff, "fdr_cutoff": config.fdr_cutoff, "counts": counts, "input": input_info, "design_columns": design.columns.tolist(), "note": ( "This pure-Python model is not the empirical-Bayes moderated t-test used by limma. " "For an exact limma analysis, run limma in R or call R from Python." ), } path.write_text(json.dumps(report, indent=2, ensure_ascii=False), encoding="utf-8")# =============================================================================# Pipeline orchestration# =============================================================================def run_pipeline(config: PipelineConfig) -> None: np.random.seed(config.seed) configure_publication_style() paths = ensure_dirs(config.outdir) print("[1/7] Reading normalized expression matrix...") norm_expr, norm_meta, norm_info = read_expression( config.norm_file, auto_log2=config.auto_log2, max_missing_fraction=config.max_missing_fraction, ) pre_expr = pre_meta = None pre_info = None if config.pre_file is not None: print("[2/7] Reading pre-correction expression matrix...") pre_expr, pre_meta, pre_info = read_expression( config.pre_file, auto_log2=config.auto_log2, max_missing_fraction=config.max_missing_fraction, ) else: print("[2/7] Pre-correction matrix not supplied; before/after QC comparison skipped.") all_projects = norm_meta["Project"].tolist() all_groups = norm_meta["Group"].tolist() if pre_meta is not None: all_projects += pre_meta["Project"].tolist() all_groups += pre_meta["Group"].tolist() project_palette = make_palette(all_projects) group_palette = make_palette(all_groups) group_markers = make_marker_map(all_groups) print("[3/7] Creating sample-distribution QC figures...") if pre_expr is not None and pre_meta is not None: fig, axes = plt.subplots(1, 2, figsize=(14.0, 5.5)) plot_sample_boxplot( axes[0], pre_expr, pre_meta, "Before batch correction", project_palette, config.show_every_n, show_legend=False, ) plot_sample_boxplot( axes[1], norm_expr, norm_meta, "After batch correction", project_palette, config.show_every_n, show_legend=True, ) axes[0].text(-0.08, 1.04, "A", transform=axes[0].transAxes, fontsize=14, fontweight="bold") axes[1].text(-0.08, 1.04, "B", transform=axes[1].transAxes, fontsize=14, fontweight="bold") fig.tight_layout(rect=[0, 0, 0.89, 1]) save_figure( fig, paths["figures"] / "Figure_1_batch_correction_boxplots", config.formats, config.raster_dpi, ) else: fig, ax = plt.subplots(figsize=(11.0, 5.5)) plot_sample_boxplot( ax, norm_expr, norm_meta, "Normalized expression distributions", project_palette, config.show_every_n, show_legend=True, ) fig.tight_layout(rect=[0, 0, 0.86, 1]) save_figure( fig, paths["figures"] / "Figure_1_expression_boxplots", config.formats, config.raster_dpi, ) print("[4/7] Creating PCA figures...") if pre_expr is not None and pre_meta is not None: fig, axes = plt.subplots(1, 2, figsize=(12.5, 5.2)) plot_pca( axes[0], pre_expr, pre_meta, "Before batch correction", project_palette, group_markers, config.pca_top_variable_genes, show_legend=False, ) plot_pca( axes[1], norm_expr, norm_meta, "After batch correction", project_palette, group_markers, config.pca_top_variable_genes, show_legend=True, ) axes[0].text(-0.14, 1.04, "A", transform=axes[0].transAxes, fontsize=14, fontweight="bold") axes[1].text(-0.14, 1.04, "B", transform=axes[1].transAxes, fontsize=14, fontweight="bold") fig.tight_layout(rect=[0, 0, 0.85, 1]) save_figure( fig, paths["figures"] / "Figure_2_batch_correction_PCA", config.formats, config.raster_dpi, ) else: fig, ax = plt.subplots(figsize=(6.6, 5.4)) plot_pca( ax, norm_expr, norm_meta, "PCA of normalized samples", project_palette, group_markers, config.pca_top_variable_genes, show_legend=True, ) fig.tight_layout(rect=[0, 0, 0.80, 1]) save_figure( fig, paths["figures"] / "Figure_2_PCA", config.formats, config.raster_dpi, ) print("[5/7] Running differential-expression analysis...") de_result, design = differential_expression_ols( norm_expr, norm_meta, config.control, config.treat, ) control_resolved = resolve_label(norm_meta["Group"], config.control) treat_resolved = resolve_label(norm_meta["Group"], config.treat) de_result = classify_degs(de_result, config.logfc_cutoff, config.fdr_cutoff) counts = save_tables( norm_expr, norm_meta, de_result, design, paths["results"], config.logfc_cutoff, config.fdr_cutoff, control_resolved, treat_resolved, ) print("[6/7] Creating differential-expression figures...") fig, axes = plt.subplots(2, 2, figsize=(11.8, 9.4)) plot_volcano( axes[0, 0], de_result, config.logfc_cutoff, config.fdr_cutoff, config.top_labels_each, show_legend=False, ) plot_ma(axes[0, 1], de_result, config.logfc_cutoff, show_legend=True) plot_deg_summary(axes[1, 0], de_result) plot_pvalue_distribution(axes[1, 1], de_result) for label, ax in zip(["A", "B", "C", "D"], axes.flat): ax.text(-0.12, 1.06, label, transform=ax.transAxes, fontsize=14, fontweight="bold") fig.suptitle("Differential expression overview", fontsize=15, fontweight="bold", y=1.01) fig.tight_layout(rect=[0, 0, 0.90, 0.99]) save_figure( fig, paths["figures"] / "Figure_3_differential_expression_overview", config.formats, config.raster_dpi, ) # Individual volcano plot, often needed as a standalone main figure. fig, ax = plt.subplots(figsize=(7.2, 5.8)) plot_volcano( ax, de_result, config.logfc_cutoff, config.fdr_cutoff, config.top_labels_each, show_legend=True, ) fig.tight_layout(rect=[0, 0, 0.82, 1]) save_figure( fig, paths["figures"] / "Figure_3A_volcano_plot", config.formats, config.raster_dpi, ) # Heatmap and top-gene boxplots use only the two modeled groups. expr_two, meta_two, _, _ = prepare_two_group_data( norm_expr, norm_meta, config.control, config.treat ) modeled_group_palette = { g: group_palette[g] for g in meta_two["Group"].drop_duplicates() } modeled_project_palette = { p: project_palette[p] for p in meta_two["Project"].drop_duplicates() } plot_heatmap( expr_two, meta_two, de_result, paths["figures"] / "Figure_4_top_DEG_heatmap", config.formats, config.raster_dpi, config.top_heatmap_each, modeled_group_palette, modeled_project_palette, ) plot_top_gene_boxplots( expr_two, meta_two, de_result, paths["figures"] / "Figure_5_top_gene_boxplots", config.formats, config.raster_dpi, config.top_box_each, modeled_group_palette, config.seed, ) print("[7/7] Writing analysis report...") input_info = {"normalized": norm_info, "pre_correction": pre_info} write_report( paths["results"] / "analysis_report.json", config, counts, input_info, design, ) print("\nAnalysis complete") print(f"Output directory: {config.outdir.resolve()}") print(f"Total genes tested: {counts['total_genes']:,}") print(f"Significant DEGs: {counts['significant_genes']:,}") print(f"Up-regulated: {counts['upregulated_genes']:,}") print(f"Down-regulated: {counts['downregulated_genes']:,}")# =============================================================================# Command-line interface# =============================================================================def parse_args(argv: Optional[Sequence[str]] = None) -> PipelineConfig: parser = argparse.ArgumentParser( description="Integrated SCI-style transcriptomic QC and DEG analysis pipeline." ) parser.add_argument( "--norm", required=True, type=Path, help="Normalized/batch-corrected expression matrix (genes x samples, TSV).", ) parser.add_argument( "--pre", type=Path, default=None, help="Optional pre-correction expression matrix for before/after QC.", ) parser.add_argument( "--outdir", type=Path, default=Path("sci_deg_output"), help="Output directory. Default: sci_deg_output", ) parser.add_argument("--control", default="Control", help="Control group label.") parser.add_argument("--treat", default="Treat", help="Treatment group label.") parser.add_argument( "--logfc", type=float, default=0.585, help="Absolute log2FC cutoff." ) parser.add_argument("--fdr", type=float, default=0.05, help="FDR cutoff.") parser.add_argument( "--top-heatmap-each", type=int, default=50, help="Top up and down genes shown in the heatmap.", ) parser.add_argument( "--top-labels-each", type=int, default=10, help="Top up and down genes labeled on the volcano plot.", ) parser.add_argument( "--top-box-each", type=int, default=3, help="Top up and down genes shown in expression boxplots.", ) parser.add_argument( "--pca-top-genes", type=int, default=5000, help="Number of most-variable genes used for PCA.", ) parser.add_argument( "--show-every-n", type=int, default=None, help="Display every Nth sample label in expression boxplots.", ) parser.add_argument( "--no-auto-log2", action="store_true", help="Disable conservative automatic log2 transformation detection.", ) parser.add_argument( "--max-missing-fraction", type=float, default=0.20, help="Remove genes with a larger missing-value fraction.", ) parser.add_argument( "--formats", nargs="+", default=["pdf", "png"], choices=["pdf", "png", "tif", "tiff", "svg"], help="Figure formats. Example: --formats pdf tiff", ) parser.add_argument( "--dpi", type=int, default=600, help="DPI for raster figure formats." ) parser.add_argument("--seed", type=int, default=2026, help="Random seed.") args = parser.parse_args(argv) if args.logfc < 0: parser.error("--logfc must be non-negative") if not (0 < args.fdr < 1): parser.error("--fdr must be between 0 and 1") if not (0 <= args.max_missing_fraction < 1): parser.error("--max-missing-fraction must be in [0, 1)") return PipelineConfig( pre_file=args.pre, norm_file=args.norm, outdir=args.outdir, control=args.control, treat=args.treat, logfc_cutoff=args.logfc, fdr_cutoff=args.fdr, top_heatmap_each=args.top_heatmap_each, top_labels_each=args.top_labels_each, top_box_each=args.top_box_each, pca_top_variable_genes=args.pca_top_genes, show_every_n=args.show_every_n, auto_log2=not args.no_auto_log2, max_missing_fraction=args.max_missing_fraction, formats=tuple(args.formats), raster_dpi=args.dpi, seed=args.seed, )def main(argv: Optional[Sequence[str]] = None) -> int: try: config = parse_args(argv) run_pipeline(config) return 0 except Exception as exc: print(f"ERROR: {exc}", file=sys.stderr) return 1if __name__ == "__main__": raise SystemExit(main())
 10个月宝宝每天需要喝多少奶粉?