Cracking the Linux Boot Code: Linux Boot-Time Diagnostics Foundations
内容涵盖启动流程各阶段、内核日志级别 loglevel、earlyprintk 早期输出、initcall_debug 计时、用 Dracut 排查 initramfs 与根文件系统挂载问题,以及用 systemd-analyze 分析用户空间服务启动,并给出调试工作流与最佳实践。https://blogs.oracle.com/linux/cracking-linux-boot-code-1
https://www.tecmint.com/linux-boot-process/
https://www.kernel.org/doc/Documentation/admin-guide/kernel-parameters.txt
https://man7.org/linux/man-pages/man7/dracut.cmdline.7.html
https://www.kernel.org/doc/html/latest/trace/boottime-trace.html
https://docs.kernel.org/admin-guide/bootconfig.html
When a Linux system crawls, freezes, or vanishes into a blank screen during startup, the real story is often hidden in the earliest seconds of boot. Linux boot-time debugging helps uncover that story by identifying whether the delay or failure comes from a problematic service, driver, mount, firmware handoff, or kernel initialization path.当 Linux 系统在启动过程中变得缓慢、卡死,或消失为一片空白屏幕时,真正的原因往往藏在启动最初的几秒钟里。Linux 启动阶段调试的作用,就是判断这种延迟或失败究竟来自某个有问题的服务、驱动、挂载、固件交接,还是内核初始化路径,从而把这段被隐藏的过程揭示出来。
During startup, the Linux kernel initializes hardware, mounts the root file system, prepares the initramfs flow, and hands control to user space, often before familiar debugging tools are available. This first part focuses on the foundation: kernel verbosity, early console output, initcall timing, initramfs debugging with Dracut, and systemd startup analysis.
在启动期间,Linux 内核会初始化硬件、挂载根文件系统、准备 initramfs 流程,并将控制权交给用户空间,而这一切通常发生在常用的调试工具尚不可用之前。本文第一部分聚焦于基础环节:内核日志详细度、早期控制台输出、initcall 计时、借助 Dracut 调试 initramfs,以及 systemd 启动分析。
For deeper kernel instrumentation with dynamic debug, boot-time tracing, ftrace, and kprobes, continue with Cracking the Linux Boot Code: Deep-Dive Linux Boot Diagnostics.
若需借助 dynamic debug、启动阶段 tracing、ftrace 与 kprobes 进行更深入的内核插桩,可继续阅读《Cracking the Linux Boot Code: Deep-Dive Linux Boot Diagnostics》。
Sometimes, the delay is long enough to deserve a little humor: Why did the sysadmin bring a sleeping bag to work? Because systemd-analyze blame said the network timeout had a long story to tell.
有时启动延迟长到值得开个玩笑:系统管理员为什么带着睡袋来上班?因为 systemd-analyze blame 说,网络超时这件事说来话长。
Why Boot-Time Diagnostics Are Important
为什么启动阶段诊断很重要
Boot-time diagnostics are important because many startup problems occur before the system is fully operational. They provide early visibility into the boot path and help identify whether a system is slow, stuck, or failing because of a service, driver, mount, firmware handoff, kernel issue, or resource constraint.
启动阶段诊断之所以重要,是因为许多启动问题发生在系统尚未完全就绪之前。它们能在启动路径上提供早期的可见性,帮助判断系统之所以缓慢、卡住或失败,究竟是源于某个服务、驱动、挂载、固件交接、内核问题,还是资源受限。
Fixing boot failures: Early-stage bugs can freeze or crash the system before traditional logging utilities such as syslog, journald, or systemd are available.
修复启动失败:早期阶段的缺陷可能在 syslog、journald 或 systemd 等传统日志工具可用之前,就已使系统冻结或崩溃。
Optimizing boot performance: Fast boot times matter for cloud micro-instances, embedded devices, automotive dashboards, and production systems where startup delay directly affects availability or user experience.
优化启动性能:对于云端微型实例、嵌入式设备、车载仪表盘,以及启动延迟会直接影响可用性或用户体验的生产系统而言,快速的启动时间十分重要。
Identifying driver bottlenecks: Hardware initialization can stall the boot process when drivers wait too long for device responses, firmware handshakes, or timeout events.
识别驱动瓶颈:当驱动等待设备响应、固件握手或超时事件的时间过长时,硬件初始化可能拖住整个启动过程。
Security auditing: Early tracing helps verify that kernel security modules, secure boot flows, and related initialization steps execute correctly before user space takes control.
安全审计:早期 tracing 有助于验证内核安全模块、安全启动流程及相关初始化步骤,是否在用户空间接管之前正确执行。
Finding resource constraints: Early diagnostics can reveal memory allocation issues, CPU stalls, and other bottlenecks that occur before normal user-space monitoring tools are available.
发现资源受限:早期诊断能揭示内存分配问题、CPU 停顿,以及其他发生在常规用户空间监控工具可用之前的瓶颈。
Boot-Time Debugging Toolkit
启动阶段调试工具集
This guide covers the foundational techniques used to debug and measure the Linux boot path: kernel verbosity, early console output, initcall timing, Dracut debugging, and systemd startup analysis. The companion deep-dive article covers dynamic debug, boot-time tracing, ftrace, and kprobes.
本指南介绍用于调试和测量 Linux 启动路径的基础技术:内核日志详细度、早期控制台输出、initcall 计时、Dracut 调试,以及 systemd 启动分析。配套的深入文章则涵盖 dynamic debug、启动阶段 tracing、ftrace 与 kprobes。
Linux Boot Flow at a Glance
Linux 启动流程概览
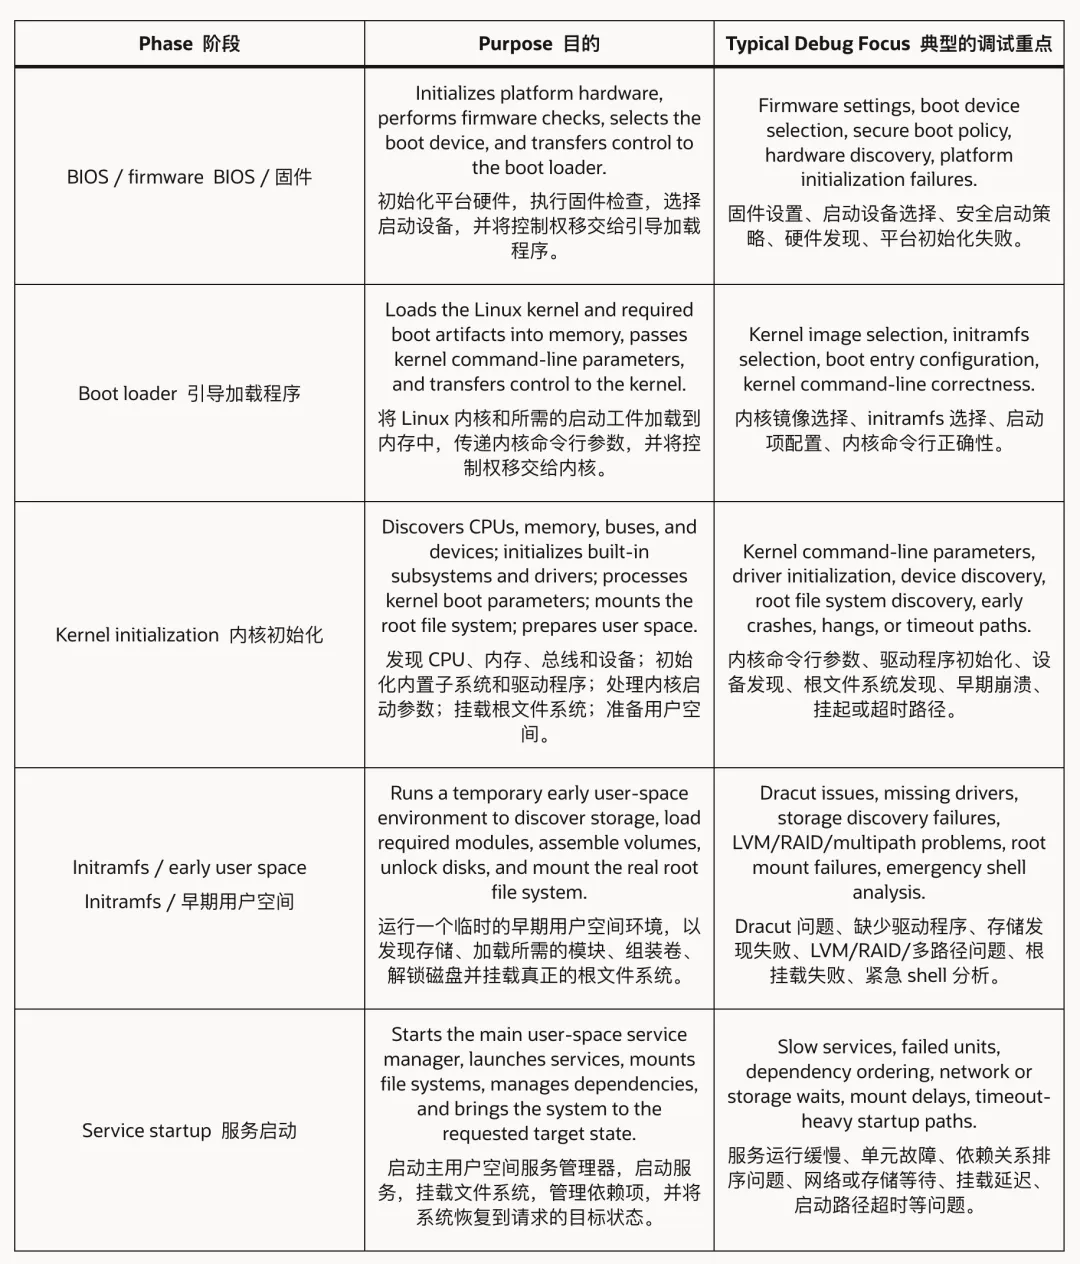
Linux boot debugging becomes easier when the issue is mapped to the correct boot phase. Each phase has different responsibilities, different failure patterns, and different levels of logging or tool availability.
当把问题对应到正确的启动阶段时,Linux 启动调试会变得更容易。每个阶段承担不同的职责,具有不同的失败模式,其日志与工具的可用程度也各不相同。
This article focuses mainly on post-boot-loader diagnostics: kernel initialization, initramfs / early user space, and service startup.
本文主要关注引导加载程序之后的诊断:内核初始化、initramfs / 早期用户空间,以及服务启动。
Kernel Console Log Level
内核控制台日志级别
The kernel console log level is one of the simplest and most useful controls for early boot debugging. It determines which kernel messages are printed to the console while the system is starting, especially before full user-space logging is available.
内核控制台日志级别是早期启动调试中最简单也最有用的控制手段之一。它决定了系统启动时哪些内核消息会被打印到控制台,尤其是在完整的用户空间日志尚不可用之前。
Use the loglevel= kernel command-line parameter to control console verbosity:
使用内核命令行参数 loglevel= 来控制控制台的日志详细度:
0 KERN_EMERG System is unusable1 KERN_ALERT Immediate action is required2 KERN_CRIT Critical condition3 KERN_ERR Error condition4 KERN_WARNING Warning condition5 KERN_NOTICE Normal but significant condition6 KERN_INFO Informational message7 KERN_DEBUG Debug-level message
Kernel messages use severity levels from 0 to 7, where lower numbers represent more critical conditions and higher numbers include more detailed output.
内核消息采用 0 到 7 的严重级别,数值越小表示情况越危急,数值越大则包含越详细的输出。
For boot debugging, increasing the console log level can help expose driver initialization failures, device discovery issues, root file system problems, mount delays, and other early kernel warnings that may otherwise remain hidden.
在启动调试中,提高控制台日志级别有助于暴露驱动初始化失败、设备发现问题、根文件系统问题、挂载延迟,以及其他原本可能被隐藏的早期内核告警。
Append the parameter through the boot loader, such as GRUB or U-Boot.
通过引导加载程序(如 GRUB 或 U-Boot)追加该参数。
After the system boots, verify the active kernel command line with cat /proc/cmdline.
系统启动后,用 cat /proc/cmdline 确认当前生效的内核命令行。
To force the kernel to print all messages regardless of the configured console log level, use ignore_loglevel.
若要让内核无视所配置的控制台日志级别、强制打印所有消息,可使用 ignore_loglevel。
Use high verbosity carefully on production systems because debug-level output can be noisy, may slow down console logging, and can make important messages harder to identify when the boot path generates a large amount of output.
在生产系统上应谨慎使用高日志详细度,因为 debug 级别的输出较为嘈杂,可能拖慢控制台日志记录,并在启动路径产生大量输出时,使重要消息更难被识别出来。
Capture Very Early Messages with earlyprintk
用 earlyprintk 捕获极早期的消息
earlyprintk helps print kernel messages before the normal console driver is initialized.
earlyprintk 可以在常规控制台驱动初始化之前打印内核消息。
This is useful when the system crashes, hangs, or goes silent very early in the boot process, before standard console output or user-space logging is available.
当系统在启动过程中极早期就崩溃、挂起或陷入沉默——也就是标准控制台输出或用户空间日志尚不可用时——这一点很有用。
A common serial-console example is earlyprintk=serial,ttyS0,115200. Use this option when debugging early platform initialization, CPU or memory setup, firmware handoff issues, or early driver bring-up problems where regular kernel logs may not yet be visible.
一个常见的串口控制台示例是 earlyprintk=serial,ttyS0,115200。当调试早期平台初始化、CPU 或内存设置、固件交接问题,或常规内核日志尚不可见的早期驱动启用问题时,可使用该选项。
Time Built-In Initialization with initcall_debug
用 initcall_debug 为内建初始化计时
Built-in kernel drivers and subsystems are initialized through a sequence of functions known as initcalls. Because these functions run early in the boot process, a slow or failing initcall can delay startup, trigger timeouts, or stop the system before normal debugging tools are available. To trace this stage, add the initcall_debug parameter to the kernel command line. It prints timing and return information for each built-in initialization function, making it easier to identify slow, failed, or suspicious initialization paths.
内建的内核驱动与子系统是通过一系列被称为 initcalls 的函数完成初始化的。由于这些函数在启动过程的早期运行,某个缓慢或失败的 initcall 可能拖延启动、触发超时,或在常规调试工具可用之前就使系统停止。要跟踪这一阶段,可在内核命令行中加入 initcall_debug 参数。它会为每个内建初始化函数打印计时与返回信息,从而更容易识别出缓慢、失败或可疑的初始化路径。
After boot, inspect the kernel log with: dmesg | grep "_init"
启动后,用以下命令查看内核日志:dmesg | grep "_init"
Ensure the following kernel configuration options are enabled:
确保启用了以下内核配置选项:
# grep -E 'CONFIG_EARLY_PRINTK=|CONFIG_SERIAL_8250=|CONFIG_SERIAL_8250_CONSOLE=' /boot/config-$(uname -r)CONFIG_SERIAL_8250=yCONFIG_SERIAL_8250_CONSOLE=yCONFIG_EARLY_PRINTK=y
Set earlyprintk and initcall_debug:
设置 earlyprintk 与 initcall_debug:
# grubby --update-kernel=”/boot/vmlinuz-$(uname -r)” \ --args=”earlyprintk=serial,ttyS0,115200 console=ttyS0,115200 loglevel=8 ignore_loglevel initcall_debug”# rebootCheck console logs:[ 0.243767] calling rcu_sysrq_init+0x0/0x27 @ 10 usecs[ 0.243768] initcall rcu_sysrq_init+0x0/0x27 returned 0
This output shows when an initcall started, when it returned, and whether it completed successfully. It is especially useful for debugging built-in driver initialization, subsystem bring-up delays, and early boot paths that increase kernel startup time.
这段输出显示了某个 initcall 何时开始、何时返回,以及是否成功完成。它对调试内建驱动初始化、子系统启用延迟,以及那些拉长内核启动时间的早期启动路径尤为有用。
Debug Initramfs Issues with Dracut
用 Dracut 调试 initramfs 问题
Dracut is used by many Linux distributions to generate and manage the initramfs image used during early boot. The initramfs contains the tools, drivers, scripts, and configuration needed to discover storage, load required modules, assemble devices, and mount the real root file system before control is handed over to the main system.
许多 Linux 发行版使用 Dracut 来生成和管理早期启动所用的 initramfs 镜像。initramfs 包含在把控制权交给主系统之前,用于发现存储、加载所需模块、组装设备并挂载真正根文件系统所需的工具、驱动、脚本与配置。
When boot fails in this stage, Dracut may drop the system into an emergency shell. In many failure cases, it also generates the diagnostic report file /run/initramfs/rdsosreport.txt. This file contains boot logs, Dracut output, kernel messages, and command output collected from the initramfs environment.
当启动在这一阶段失败时,Dracut 可能会将系统丢入一个应急 shell。在许多失败情形下,它还会生成诊断报告文件 /run/initramfs/rdsosreport.txt。该文件包含从 initramfs 环境中收集到的启动日志、Dracut 输出、内核消息及命令输出。
Save /run/initramfs/rdsosreport.txt to a mounted partition such as /boot, or copy it to removable storage if available. Include this file in incident reports or support requests, because it often contains the most useful evidence for diagnosing root file system discovery failures, missing drivers, storage configuration issues, LVM or RAID problems, and early boot timeouts.
请将 /run/initramfs/rdsosreport.txt 保存到某个已挂载的分区(如 /boot),或在有条件时复制到可移动存储。应在事件报告或支持请求中附上此文件,因为它常常包含诊断根文件系统发现失败、缺失驱动、存储配置问题、LVM 或 RAID 问题以及早期启动超时时最有用的证据。
Common Dracut Kernel Command-Line Options
常用的 Dracut 内核命令行选项
Dracut provides several rd.* kernel command-line options that help debug initramfs failures, root file system discovery problems, storage delays, and early boot hangs. These options are added through the boot loader, along with the normal kernel parameters.
Dracut 提供了若干 rd.* 内核命令行选项,用于调试 initramfs 失败、根文件系统发现问题、存储延迟及早期启动挂起。这些选项与常规内核参数一同,通过引导加载程序添加。
rd.info: Prints informational Dracut output, even when quiet is present on the kernel command line.
rd.info:打印 Dracut 的信息性输出,即便内核命令行上存在 quiet 也仍会打印。
rd.shell: Drops to an emergency shell if Dracut cannot mount the root file system.
rd.shell:当 Dracut 无法挂载根文件系统时,进入应急 shell。
rd.debug: Enables verbose shell tracing for Dracut scripts. If systemd is active in the initramfs, output can be inspected with journalctl -ab; otherwise, logs are written to dmesg and /run/initramfs/init.log.
rd.debug:为 Dracut 脚本启用详细的 shell tracing。如果 initramfs 中启用了 systemd,可用 journalctl -ab 查看输出;否则日志会写入 dmesg 与 /run/initramfs/init.log。
rd.memdebug=0-5: Prints memory usage information at increasing verbosity levels, where higher values produce more detailed output.
rd.memdebug=0-5:按递增的详细度级别打印内存使用信息,数值越大输出越详细。
rd.break=: Drops to a shell at a specific Dracut stage, such as cmdline, pre-udev, pre-trigger, initqueue, pre-mount, mount, pre-pivot, or cleanup.
rd.break=:在指定的 Dracut 阶段进入 shell,例如 cmdline、pre-udev、pre-trigger、initqueue、pre-mount、mount、pre-pivot 或 cleanup。
rd.udev.info: Sets the udev log level to info during initramfs execution.
rd.udev.info:在 initramfs 执行期间将 udev 日志级别设为 info。
rd.udev.debug: Sets the udev log level to debug during initramfs execution.
rd.udev.debug:在 initramfs 执行期间将 udev 日志级别设为 debug。
Boolean rd.* parameters can usually be enabled by specifying the parameter alone or by setting it to =1, and disabled by setting it to =0. If the same parameter appears multiple times on the kernel command line, the last value is the one Dracut uses.
布尔型的 rd.* 参数通常可以通过单独指定该参数或将其设为 =1 来启用,通过设为 =0 来禁用。如果同一参数在内核命令行上出现多次,Dracut 采用的是最后一个值。
Dracut Debugging Examples
Dracut 调试示例
The following examples show common Dracut kernel command-line options used when debugging initramfs or root file system discovery issues.
以下示例展示了在调试 initramfs 或根文件系统发现问题时常用的 Dracut 内核命令行选项。
Enable verbose Dracut debug output:This is the least disruptive test. It should boot normally but produce more Dracut/initramfs logging.
启用详细的 Dracut 调试输出:这是干扰最小的一种测试。系统应能正常启动,但会产生更多 Dracut/initramfs 日志。
sudo grubby \ --update-kernel=/boot/vmlinuz-6.12.0-202.76.4.1.el9uek.x86_64 \ --remove-args=”rhgb quiet” \ --args=”rd.debug log_buf_len=1M”
If Dracut used systemd in the initramfs, rd.debug output can be inspected with journalctl -ab.
如果 Dracut 在 initramfs 中使用了 systemd,可用 journalctl -ab 查看 rd.debug 的输出。
Drop to a shell before switching root:
在切换根目录之前进入 shell:
Use rd.break=pre-pivot to stop Dracut after root file system discovery and mount, but before switching to the real OS root.
使用 rd.break=pre-pivot,可让 Dracut 在完成根文件系统发现与挂载之后、切换到真正的操作系统根目录之前停下来。
# sudo grubby \ --update-kernel=/boot/vmlinuz-6.12.0-202.76.4.1.el9uek.x86_64 \ --remove-args=”rhgb quiet” \ --args=”rd.debug rd.shell rd.break=pre-pivot log_buf_len=1M”# rebootOn the console:pre-pivot:/
It helps confirm:
它有助于确认:
Did Dracut find the root device?Is the real root mounted at /sysroot?Are LVM, RAID, multipath, or encrypted devices assembled?Are the expected drivers and devices present?Is the failure before or after initramfs handoff?
Dracut 是否找到了根设备?真正的根是否挂载在 /sysroot?LVM、RAID、multipath 或加密设备是否已组装?预期的驱动与设备是否都在?失败发生在 initramfs 交接之前还是之后?
Key checks from the shell:
在 shell 中的关键检查:
If /sysroot is mounted correctly, Dracut found the root file system.If /sysroot is missing or empty, the issue is still in initramfs storage/root discovery.
如果 /sysroot 已正确挂载,说明 Dracut 找到了根文件系统。如果 /sysroot 缺失或为空,则问题仍出在 initramfs 的存储/根发现环节。
Emergency shell
应急 shell
rd.shell enables the Dracut emergency shell on failure. The emergency shell is the troubleshooting prompt you enter after Dracut cannot continue booting.
rd.shell 会在失败时启用 Dracut 应急 shell。应急 shell 就是在 Dracut 无法继续启动之后,你所进入的排障提示符。
With rd.debug rd.shell:
在使用 rd.debug rd.shell 时:
If boot succeeds, no shell appears.If Dracut cannot find or mount the root file system, it may drop into an emergency shell.
如果启动成功,不会出现 shell。如果 Dracut 无法找到或挂载根文件系统,则可能进入应急 shell。
Analyze Service Startup with systemd
用 systemd 分析服务启动
Most modern Linux distributions use systemd as the service manager during user-space startup. After the kernel and initramfs stages complete, systemd starts services, tracks processes, manages mount and automount points, applies dependency ordering, and brings the system to the requested target state. When the system boots slowly after user space begins, systemd tools are often the best place to start.
大多数现代 Linux 发行版在用户空间启动期间使用 systemd 作为服务管理器。在内核与 initramfs 阶段完成之后,systemd 会启动各项服务、跟踪进程、管理挂载与自动挂载点、施加依赖顺序,并将系统带入所请求的目标状态。当系统在用户空间开始之后启动缓慢时,systemd 工具往往是最合适的着手点。
To increase systemd logging during boot, add the following kernel command-line parameter:
要在启动期间增加 systemd 的日志量,可添加以下内核命令行参数:
Additional logging controls, such as systemd.log_target=, systemd.log_location=, and systemd.log_time=, may also be useful depending on the environment and systemd version.
视环境与 systemd 版本而定,其他日志控制项——如 systemd.log_target=、systemd.log_location= 与 systemd.log_time=——可能同样有用。
Measure Overall Boot Time
测量整体启动时间
Use systemd-analyze without arguments to get a high-level breakdown of boot time:
不带参数运行 systemd-analyze,可获得启动时间的高层次分解:
$ systemd-analyzeStartup finished in 1.083s (kernel) + 4.116s (initrd) + 12.996s (userspace) = 18.197smulti-user.target reached after 12.643s in userspace.
This separates the time spent in the kernel, initrd, and user-space phases.
这将内核、initrd 与用户空间三个阶段所花费的时间区分开来。
Inspect the systemd Manager State
检查 systemd 管理器状态
Use systemd-analyze dump to print a detailed, human-readable view of the current systemd manager state:
使用 systemd-analyze dump,可打印当前 systemd 管理器状态的详细、可读视图:
$ systemd-analyze dumpManager: systemd 252 (252-55.0.3.el9_7.9)Features: +PAM +AUDIT +SELINUX -APPARMOR +IMA +SMACK +SECCOMP +GCRYPT +GNUTLS +OPENSSL +ACL +BLKID +CURL +ELFUTILS +FIDO2 +IDN2 -IDN -IPTC +KMOD +LIBCRYPTSE>Timestamp kernel: Thu 2026-06-18 04:54:16 GMT......Timestamp initrd-units-load-start: Thu 2026-06-18 04:54:17 GMTTimestamp initrd-units-load-finish: Thu 2026-06-18 04:54:17 GMTSubscribed: :1.2Subscribed: :1.1-> Unit udisks2.service: Description: Disk Manager Instance: n/a Unit Load State: loaded...... SystemCallErrorNumber: kill -> ExecStart: Command Line: /usr/bin/cloud-init init PID: 2175 Start Timestamp: Thu 2026-06-18 04:54:27 GMT Exit Timestamp: Thu 2026-06-18 04:54:28 GMT Exit Code: exited Exit Status: 0 CPUAccounting: yes IOAccounting: no......
The output is usually long and is intended for debugging. It should not be treated as a stable machine-readable interface.
这类输出通常很长,用于调试。不应把它当作稳定的机器可读接口来使用。
Identify Slow Units
识别缓慢的 unit
Use systemd-analyze blame to list units ordered by the time they took to initialize:
使用 systemd-analyze blame,可按各 unit 初始化所耗时间排序列出它们:
$ systemd-analyze blame5.962s unified-monitoring-agent_config_downloader.service4.353s dev-rfkill.device4.353s sys-devices-virtual-misc-rfkill.device4.281s sys-devices-pnp0-00:00-00:00:0-00:00:0.0-tty-ttyS0.device4.280s dev-ttyS0.device4.274s sys-devices-platform-serial8250-serial8250:0-serial8250:0.3-tty-ttyS3.device4.274s dev-ttyS3.device4.269s sys-devices-platform-serial8250-serial8250:0-serial8250:0.2-tty-ttyS2.device4.268s dev-ttyS2.device...... 6ms iscsi.service 4ms pmie_check.service 2ms sys-fs-fuse-connections.mount 1ms pmlogger_farm_check.service 1ms pmie_farm_check.service
This helps identify units with long startup times. However, a unit with a high duration is not always responsible for delaying the final boot target; it may have started in parallel and may not be on the critical path.
这有助于识别启动耗时较长的 unit。不过,耗时较长的 unit 并不总是拖延最终启动目标的元凶;它可能是并行启动的,也可能并不处于关键路径上。
Show the Critical Chain
显示关键链(critical chain)
Use systemd-analyze critical-chain to display the dependency path that directly affected when the target was reached:
使用 systemd-analyze critical-chain,可显示直接影响目标何时达成的依赖路径:
$ systemd-analyze critical-chainThe time when unit became active or started is printed after the ”@” character.The time the unit took to start is printed after the ”+” character.multi-user.target @12.643s└─pmie.service @7.928s +1.713s └─pmcd.service @6.656s +1.250s └─network-online.target @6.616s └─cloud-init.service @6.197s +416ms...... └─systemd-journald.socket └─system.slice └─-.slice
In this output, the value after @ shows when the unit became active or started, and the value after + shows how long the unit took to start.
在这段输出中,@ 后面的值表示 unit 何时变为活动或开始启动,+ 后面的值表示 unit 启动所花的时长。
Generate Boot Charts
生成启动图表
Generate an SVG boot timeline:
生成 SVG 格式的启动时间线:
systemd-analyze plot > sysd.svg
Generate a dependency graph using Graphviz:
使用 Graphviz 生成依赖关系图:
# sudo systemd-analyze dot | dot -Tsvg > systemd.svg Color legend: black = Requires dark blue = Requisite dark grey = Wants red = Conflicts green = After
To view it, open the image in a web page or directly with a Linux desktop GUI. Click here to view the full-size image.
要查看它,可在网页中打开该图像,或直接用 Linux 桌面 GUI 打开。点击此处查看全尺寸图像。
Practical Debugging Workflow
实用调试工作流
A structured workflow helps narrow down whether a boot issue belongs to the kernel, initramfs, driver initialization, storage discovery, or user-space service startup path.
一套结构化的工作流,有助于逐步缩小范围,判断某个启动问题属于内核、initramfs、驱动初始化、存储发现,还是用户空间服务启动路径。
Check the active kernel command line: Verify the parameters used for the current boot with cat /proc/cmdline.
检查当前生效的内核命令行:用 cat /proc/cmdline 确认本次启动所用的参数。
Increase kernel verbosity: Use loglevel=7 for debug-level console output, or ignore_loglevel to print all kernel messages regardless of the configured console log level.
提高内核日志详细度:使用 loglevel=7 获得 debug 级别的控制台输出,或使用 ignore_loglevel 无视所配置的控制台日志级别、打印全部内核消息。
Capture very early failures: If the system fails before the regular console is initialized, enable earlyprintk or the appropriate early console option for the platform.
捕获极早期的失败:如果系统在常规控制台初始化之前就失败,可启用 earlyprintk,或该平台对应的早期控制台选项。
Debug initramfs and root mount failures: If the system reaches initramfs but cannot mount the root file system, use Dracut options such as rd.debug, rd.shell, or a targeted breakpoint like rd.break=.
调试 initramfs 与根挂载失败:如果系统到达了 initramfs 却无法挂载根文件系统,可使用 rd.debug、rd.shell 等 Dracut 选项,或 rd.break= 这类有针对性的断点。
Save Dracut diagnostics: From an emergency shell, save /run/initramfs/rdsosreport.txt before rebooting. This report often contains the most useful evidence for initramfs and storage discovery problems.
保存 Dracut 诊断:在应急 shell 中,重启之前先保存 /run/initramfs/rdsosreport.txt。该报告常常包含针对 initramfs 与存储发现问题最有用的证据。
Trace driver and subsystem initialization: Use initcall_debug to identify slow, failing, or suspicious built-in driver and subsystem initialization paths.
跟踪驱动与子系统初始化:使用 initcall_debug 来识别缓慢、失败或可疑的内建驱动与子系统初始化路径。
Analyze user-space startup: After the system reaches user space, use systemd-analyze, systemd-analyze blame, and systemd-analyze critical-chain to isolate slow services, dependency delays, and startup bottlenecks.
分析用户空间启动:系统进入用户空间后,使用 systemd-analyze、systemd-analyze blame 与 systemd-analyze critical-chain,来隔离缓慢的服务、依赖延迟与启动瓶颈。
Escalate to deeper tracing when needed: If foundational logs do not explain the issue, use the companion deep-dive article for dynamic debug, boot-time tracing, ftrace, and kprobe-based instrumentation.
在需要时升级到更深入的 tracing:如果基础日志仍无法解释问题,可参考配套的深入文章,使用 dynamic debug、启动阶段 tracing、ftrace 与基于 kprobe 的插桩。
Best Practices
最佳实践
Enable one debug option at a time: Add kernel and Dracut options incrementally so the impact of each parameter is easy to understand.
一次只启用一个调试选项:逐步添加内核与 Dracut 选项,以便清楚理解每个参数的影响。
Record the exact kernel command line: Save the full output of cat /proc/cmdline for every test boot. This makes results reproducible and helps compare different debugging attempts.
记录准确的内核命令行:为每次测试启动都保存 cat /proc/cmdline 的完整输出。这能让结果可复现,并有助于比较不同的调试尝试。
Preserve early boot logs before rebooting: If Dracut drops to an emergency shell, copy /run/initramfs/rdsosreport.txt to a mounted partition or removable storage before restarting the system.
在重启之前保存早期启动日志:如果 Dracut 进入应急 shell,请在重启系统之前,把 /run/initramfs/rdsosreport.txt 复制到已挂载的分区或可移动存储上。
Keep production-like systems lean: On production or performance-sensitive systems, avoid high-volume tracing unless the issue cannot be reproduced elsewhere. Use narrow trace filters and collect only the data needed.
让类生产系统保持精简:在生产或性能敏感的系统上,除非问题无法在别处复现,否则应避免大量 tracing。使用范围狭窄的 trace 过滤器,只收集所需的数据。
Compare against a known-good boot: When possible, compare logs and traces from a failing boot with a successful boot using similar hardware, kernel, boot loader, initramfs, and service configuration.
与已知正常的启动做对比:在可能的情况下,将失败启动的日志与 trace,同硬件、内核、引导加载程序、initramfs 及服务配置相近的一次成功启动作对比。
Watch for timing side effects: Heavy logging and verbose debug settings can slow the boot path and affect the issue being investigated. Treat diagnostic results with that overhead in mind.
留意计时上的副作用:大量日志与详细的调试设置会拖慢启动路径,并影响到正在调查的问题。看待诊断结果时,应把这部分开销考虑在内。
Clean up after debugging: Remove verbose boot parameters, tracing options, temporary breakpoints, and debug-only kernel command-line settings after the investigation is complete.
调试结束后清理:调查完成后,移除详细的启动参数、tracing 选项、临时断点,以及仅用于调试的内核命令行设置。
Conclusion
结论
Linux boot diagnostics turn an otherwise silent startup path into something visible, measurable, and debuggable. Start with basic kernel verbosity, move to early console logging or Dracut diagnostics when needed, use initcall_debug for built-in initialization timing, and use systemd-analyze once the system reaches user space. If the problem needs deeper kernel instrumentation, continue with Cracking the Linux Boot Code: Deep-Dive Linux Boot Diagnostics.
Linux 启动诊断能把原本沉默的启动路径,变成可见、可测量、可调试的对象。先从基础的内核日志详细度入手,需要时再转向早期控制台日志或 Dracut 诊断,用 initcall_debug 为内建初始化计时,并在系统进入用户空间后使用 systemd-analyze。如果问题需要更深入的内核插桩,可继续阅读《Cracking the Linux Boot Code: Deep-Dive Linux Boot Diagnostics》。



 10个月宝宝每天需要喝多少奶粉?