Python绘制卫星降雨校正、水文模型模拟径流的散点密度图(文末免费包邮送书)
- 2026-10-14 12:06:02
Python绘制卫星降雨校正、水文模型模拟径流的散点密度图(文末免费包邮送书)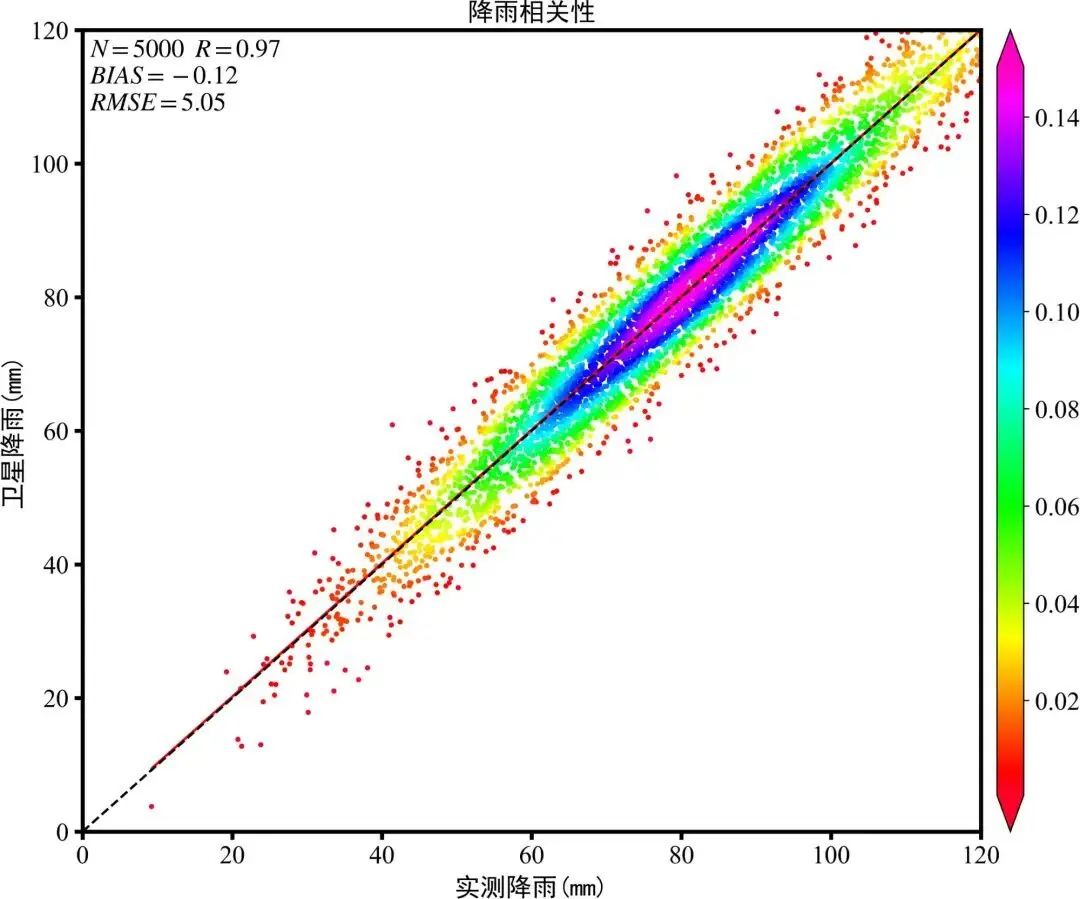
给大家送本书: 《深人浅出Python人工智能》。 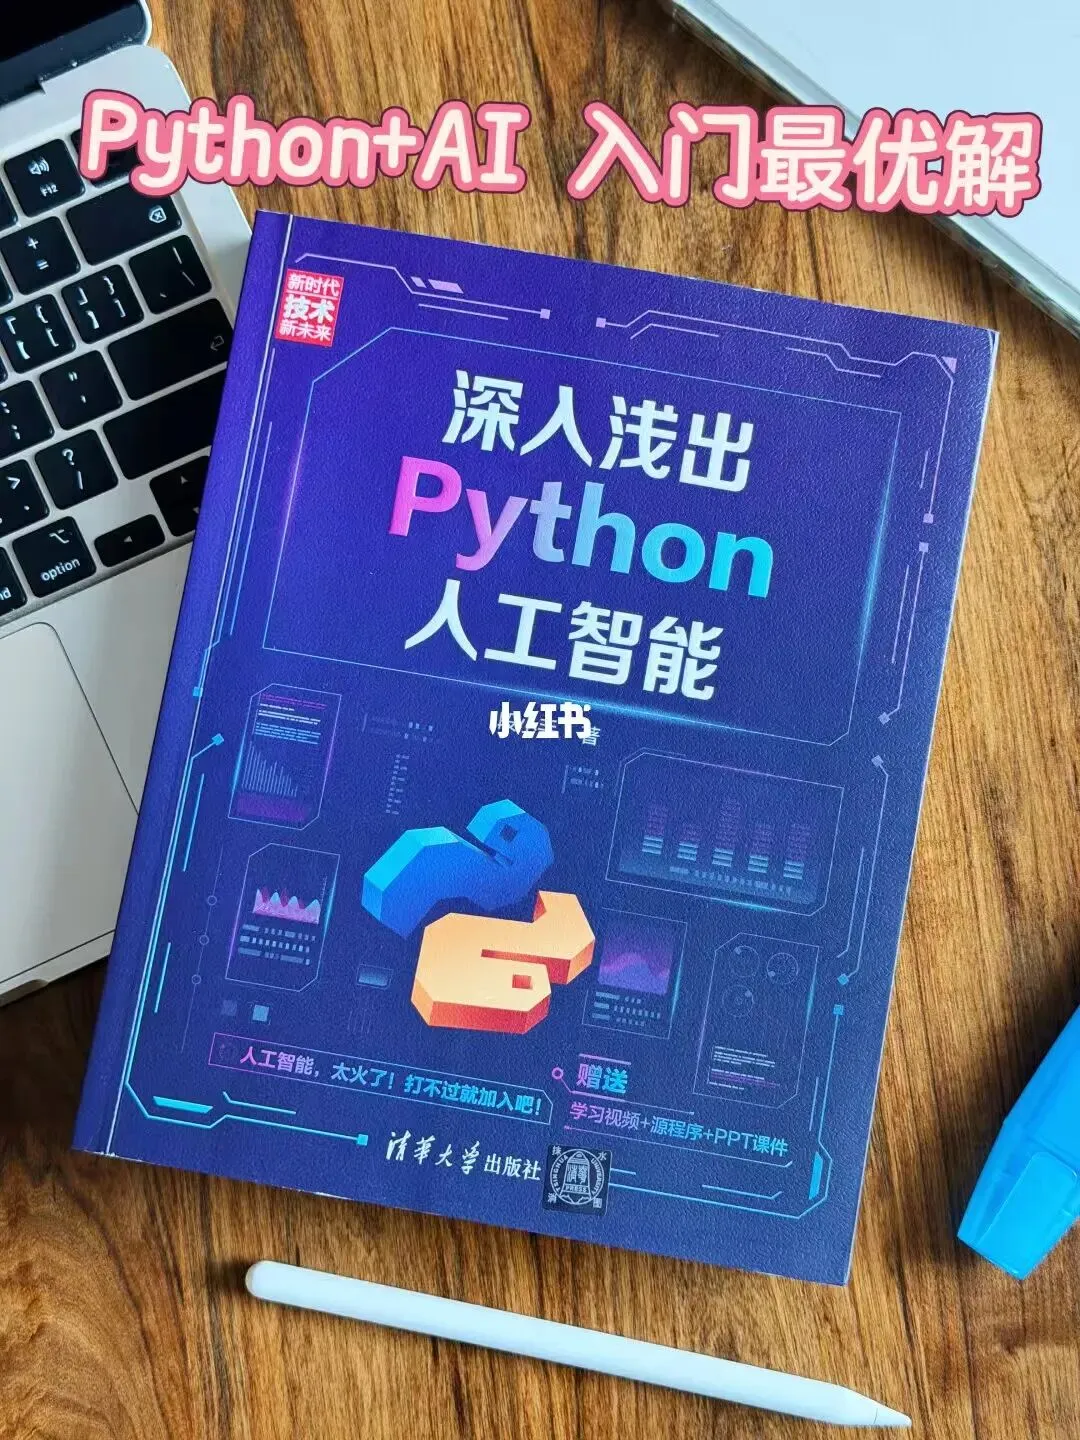
每人免费包邮一本: 《深人浅出Python人工智能》。开奖日期:2026年8月30日晚8点。
********************************** 欢迎加气象水文科研猫主编微信, 免费加入微信交流群, 获取更多免费代码和科研数据。 ********************************** 
Python绘制卫星降雨分面散点密度图:
import numpy as npimport pandas as pdimport matplotlib.pyplot as pltfrom scipy.stats import gaussian_kdefrom sklearn.metrics import mean_squared_errorfrom matplotlib.pyplot import MultipleLocatorfrom sklearn.linear_model import LinearRegressionfrom statistics import meanfrom matplotlib import rcParamsconfig = {"font.family":'Times New Roman',"font.size": 16,"mathtext.fontset":'stix'}rcParams.update(config)# 读取数据filename=r'./data613.xlsx'df2=pd.read_excel(filename)#读取文件p1=df2['p1']p2=df2['p2']# 开始绘图fig,ax=plt.subplots(figsize=(12,9),dpi=600)# Calculate the point densityxy = np.vstack([p1,p2])z = gaussian_kde(xy)(xy)scatter = ax.scatter(p1,p2,marker='o',c=z*100,edgecolors=None,s=5,label='LST',cmap='gist_rainbow')cbar=plt.colorbar(scatter,shrink=1,orientation='vertical',extend='both',pad=0.015,aspect=30)# 求相关性拟合公式import matplotlib.pyplot as plt#create basic scatterplot#obtain m (slope) and b(intercept) of linear regression linem, b = np.polyfit(p1, p2, 1)#add linear regression line to scatterplot plt.plot(p1, m*p1+b, c='r', lw=1.5)x, y = p1,p2BIAS = mean(x - y)MSE = mean_squared_error(x, y)RMSE = np.power(MSE, 0.5)R = np.corrcoef(x, y)[0, 1]ax.text(1, 116, '$N=%.f$' % len(y), family = 'Times New Roman')ax.text(15, 116, '$R=%.2f$' % R, family = 'Times New Roman')ax.text(1, 112, '$BIAS=%.2f$' % BIAS, family = 'Times New Roman')ax.text(1, 108, '$RMSE=%.2f$' % RMSE, family = 'Times New Roman')plt.plot([0,120],[0,120],'k--',lw=1.5) # 绘制1:1线# 设置边框粗细ax.spines['bottom'].set_linewidth(2.5); # 设置底部坐标轴的粗细ax.spines['top'].set_linewidth(2.5); # 设置底部坐标轴的粗细ax.spines['left'].set_linewidth(2.5); # 设置底部坐标轴的粗细ax.spines['right'].set_linewidth(2.5); # 设置底部坐标轴的粗细# 设置刻度线长短粗细ax2=plt.gca()ax.tick_params(which='major',width=2.5,length=5)# ax为两条坐标轴的实例x_major_locator=MultipleLocator(100)# 把x轴的刻度间隔设置为1,并存在变量里y_major_locator=MultipleLocator(100)# 把y轴的刻度间隔设置为10,并存在变量里ax2.xaxis.set_major_locator(x_major_locator)# 把x轴的主刻度设置为1的倍数ax2.yaxis.set_major_locator(y_major_locator)font3={'family':'SimHei','size':16,'color':'k'}plt.title('降雨相关性',fontdict=font3)plt.xlabel('实测降雨(mm)',fontdict=font3)plt.ylabel('卫星降雨(mm)',fontdict=font3)plt.xticks()plt.yticks()plt.xlim(xmin=0, xmax=120)plt.xticks(np.arange(0, 121, 20))plt.ylim(ymin=0, ymax=25)plt.yticks(np.arange(0, 121, 20))plt.savefig('./plot283.png',dpi=500,bbox_inches='tight',pad_inches=0)plt.show()内容简介:
从Python基础到机器学习与大模型应用,完整构建AI技术体系路径。深入浅出:从算法原理到工程实现层层拆解,让复杂AI技术变得可理解、可复现。实战落地:凝聚作者多年AI工程与数据科学实战经验,覆盖真实业务场景落地方法。案例丰富:涵盖多个真实AI应用案例,覆盖机器学习、推荐系统与大模型实践路径。
抽奖方式及满足条件:
1.关注气象水文科研猫;
2.转发本文到朋友圈;
3.给本文点【赞】、点【在看】;
4.留言区评论点赞最多者。
同时满足上述4个条件的留言区点赞前5名的读者,
本文来自网友投稿或网络内容,如有侵犯您的权益请联系我们删除,联系邮箱:596563534@qq.com 。
随机文章
-
 10个月宝宝每天需要喝多少奶粉?
- 用Python制造数学情景?
- Python连SQLite——派办事员去档案室(sqlite3)
- 下一个风口,Python,真的很缺人!!
- Python知识点 | Day22 元组tuple
- Python 异常处理:从 try-except 到自定义异常
- 《Python小技巧&易错点100例》第三篇
- Python 数据结构+算法 面试实战系列:字典
- 【PhpStorm 2018】PhpStorm 2018软件安装包下载PhpStorm 软件含激活步骤完整安装流程
- PHP 原生编译器 TypePHP 正式开源登顶 GitHub
- 【PhpStorm 2021】PhpStorm 2021软件安装包下载PhpStorm 软件含激活步骤完整安装流程