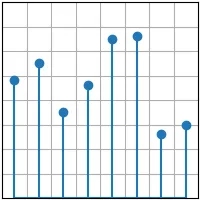
import matplotlib.pyplot as pltimport numpy as npplt.style.use('_mpl-gallery')# make datax = 0.5 + np.arange(8)y = [4.8, 5.5, 3.5, 4.6, 6.5, 6.6, 2.6, 3.0]# plotfig, ax = plt.subplots()ax.stem(x, y)ax.set(xlim=(0, 8), xticks=np.arange(1, 8), ylim=(0, 8), yticks=np.arange(1, 8))plt.show()
# 1. 导入库import matplotlib.pyplot as pltimport numpy as np# 2. 设置内置绘图样式plt.style.use('_mpl-gallery')# 3. 准备数据x = 0.5 + np.arange(8) # 结果[0.5, 1.5, 2.5, 3.5, 4.5, 5.5, 6.5, 7.5]y = [4.8, 5.5, 3.5, 4.6, 6.5, 6.6, 2.6, 3.0]# 4. 创建图形和坐标轴fig, ax = plt.subplots() # 返回一个 Figure 对象(整个画布)和一个 Axes 对象(具体的绘图区域)# 5. 绘制茎叶图ax.stem(x, y)# 茎叶图元素:# 茎(stem line):从基线(默认 y=0)到数据点的垂直线。# 叶(leaf):位于数据点位置的标记(默认是圆圈)。# 基线(baseline):所有茎线起点的水平线(默认 y=0)。# 参数 x 和 y 分别指定数据点的横、纵坐标。# 6. 设置坐标轴范围与刻度ax.set(xlim=(0, 8), xticks=np.arange(1, 8), ylim=(0, 8), yticks=np.arange(1, 8))# x 轴显示范围 0~8,x 轴刻度位置设为 [1,2,3,4,5,6,7]# y 轴显示范围 0~8,y 轴刻度位置设为 [1,2,3,4,5,6,7]# 7. 显示图形plt.show()