Python遥感实战:基于随机森林的土地利用土地覆盖分类
- 2026-07-03 22:06:01
Python遥感实战:基于随机森林的土地利用土地覆盖分类
1.训练样本点制作 首先,我们打开ArcMap软件进行训练样本点的制作,我们打开文件夹下面的测试栅格数据 test.tif 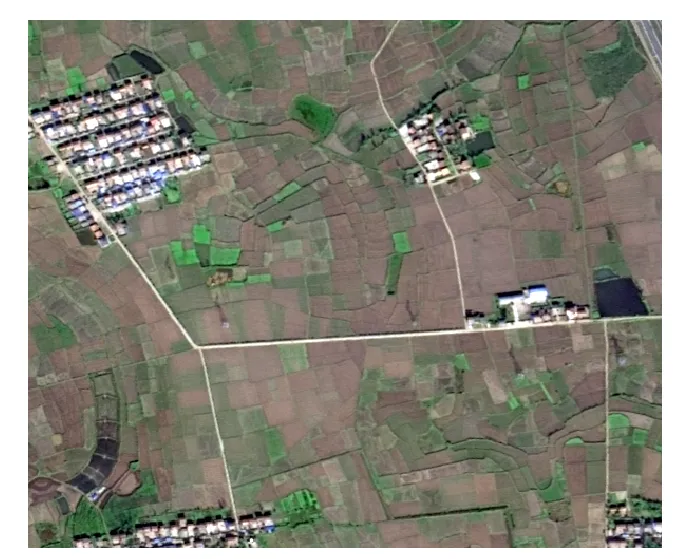
查看元数据信息: 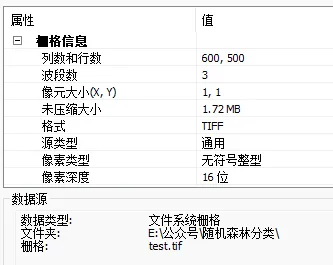
接下来,我们用 ArcMap 在目标文件夹下面新建多个类别点矢量数据: 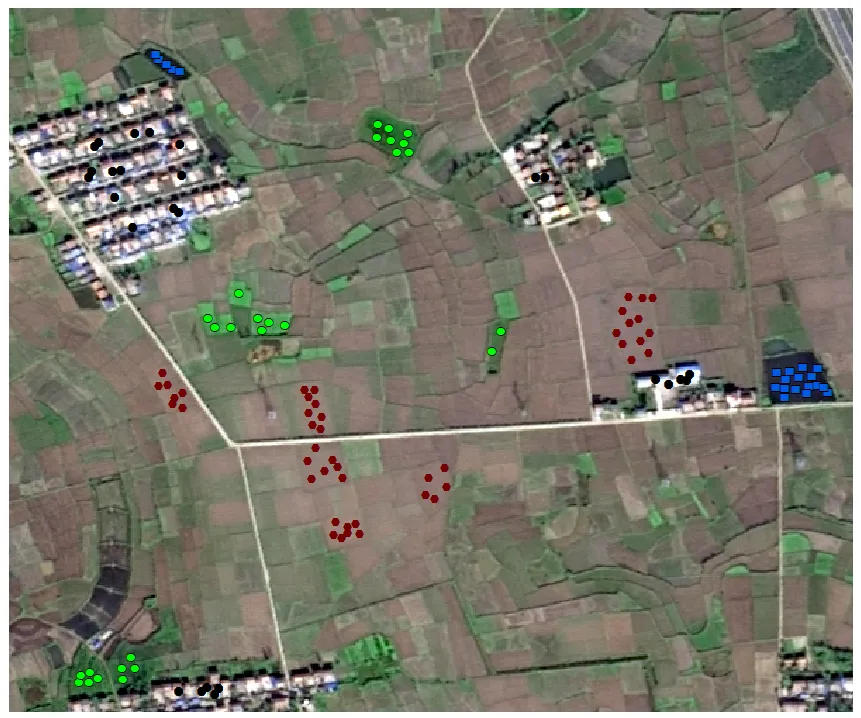
其中,不同的矢量点代表不同的地物,0 代表 水体,1 代表 植被,2 代表 房屋,3 代表 耕地: 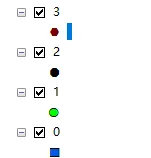
文件夹中显示: 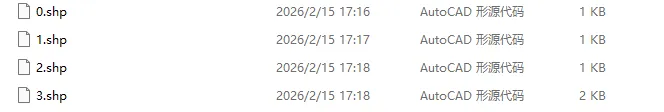
2. 训练模型的步骤 下面具体的代码函数在数据文件夹中 1. 将所有的类别矢量数据进行合并 可以看到所有类别的点的坐标信息都在这个 DataFrame 中 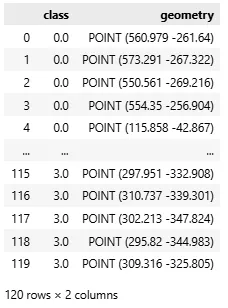
2. 读取测试栅格数据 3. 通过坐标信息提取训练样本点对应栅格像元值 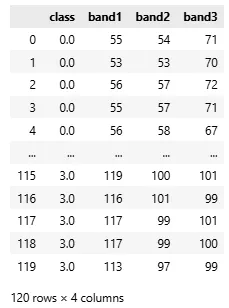
4. 建立数据集并进行训练 5. 预测结果图 6. 可视化 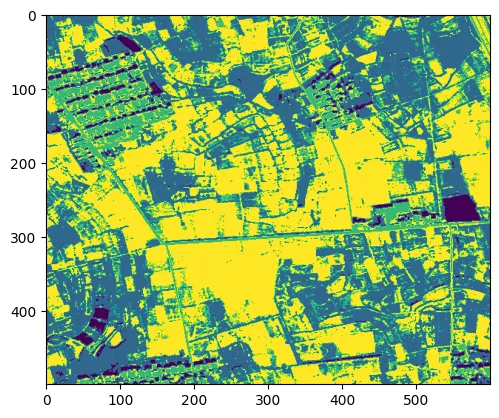
注:上述代码已经全部打包,后期会将集成公众号更多数据分析代码和可视化代码进行整理并进一步更新打包! 📒 点赞👍 关注 ❤️ 不迷路哦~
🌍 在遥感影像监督分类的实际应用中,从样本点制作、像元值提取到模型训练与结果输出,往往涉及多个软件和繁琐的手动操作。这一流程不仅耗时,而且难以保证可重复性,尤其在处理多时相、大范围数据时效率较低。
✅ 本文介绍一套基于 Python 的完整遥感分类工作流:首先在 ArcMap 中制作不同地物类别的训练样本点(如水体、植被、房屋、耕地),随后通过脚本自动合并矢量文件、批量提取对应栅格像元值,构建训练数据集;接着使用随机森林算法进行模型训练,并对整景影像进行分块预测;最后输出并可视化分类结果。
👇 该方法实现了从样本准备到结果生成的全流程自动化,代码结构清晰、易于复用。
下文将逐步说明各环节的实现细节,并提供完整可运行代码。
完整可复制代码随机森林分类.zip
点击关注上方“翔的学术日记”,选择加"星标"置顶重磅干货,第一时间送达
import geosis.mlc as mlcimport geosis.prepro as primport geopandas as gpdimport rasterio# 1. Merge all shpsmerge = pr.merge_shp_with_class('./datasets/01/training_points/')print(merge)#######def merge_shp_with_class(shp_dir: str, save_path: str | None = None) -> gpd.GeoDataFrame:'''This function merges multiple shapefiles from a directory into a single GeoDataFrame.It assigns a class ID to each feature based on the numeric filename of the source shapefile.Parameters:shp_dir: The directory path containing the source shapefiles (.shp).The filename of each shapefile (without extension) must be numeric,as it represents the class ID (e.g., '1.shp', '2.shp').save_path: Optional. The file path (including filename and extension, e.g., 'data/merged.shp')where the resulting merged vector file will be stored.Return:A geopandas.GeoDataFrame containing all merged features with a 'class' columninserted as the first attribute.'''.......return merged
img = rasterio.open('./datasets/01/test.tif')endm = pr.extract(img, merge)#####def extract(image, vector):'''This function extracts spectral values from a multi-band raster at specificpoint locations provided by a vector file. It is typically used to createtraining datasets for supervised classification.Parameters:image: A multi-band raster object. It must be of typerasterio.io.DatasetReader (opened via rasterio.open).vector: A geopandas.GeoDataFrame containing point geometries.The first column of this GeoDataFrame is expected to containthe class labels or IDs.Return:A pandas.DataFrame where the first column contains the class IDs fromthe vector file, and the subsequent columns contain the sampledspectral values for each band (e.g., band1, band2, ...).'''....return join_df
inst = mlc.MLC(image = img, endmembers = endm)rf_model, _ = inst.train_RF(training_split = 0.8)# outputTraining Complete. OA: 0.9167, Kappa: 0.8852
final_results = inst.predict_blocks(model=rf_model, block_size = 512)from matplotlib import pyplot as pltplt.imshow(final_results.get('Classification_Map'))
本文来自网友投稿或网络内容,如有侵犯您的权益请联系我们删除,联系邮箱:wyl860211@qq.com 。

