在足球比赛中,进球的发生常常看似随机,但可以通过简单的概率模型来模拟比赛中的进球过程。在本文中,将展示如何利用Python模拟一场90分钟的比赛,其中进球是完全随机发生的。通过这个模拟,你将更好地理解进球的随机性,以及为什么大多数比赛的进球数通常在0到5之间。
接下来,将一步步搭建这个模拟模型,并分析其结果。让我们一起来探索足球比赛中的这一有趣现象吧!
首先导入模块:
import numpy as npimport numpy.random as rndimport timeimport pylab as plt
设置参数
让我们来设置足球比赛的基本得分率。
#Length of matchmatch_minutes = 90#Average goals per matchgoals_per_match = 2.79#Probability of a goal per minuteprob_per_minute = np.array(goals_per_match/match_minutes)print('The probability of a goal per minute is %5.5f. \n' % prob_per_minute )
运行结果:
模拟单场比赛
现在我们来模拟一场比赛。每分钟进球的概率是相同的。将下面的模拟运行10次,看看有多少场比赛中有3个进球?
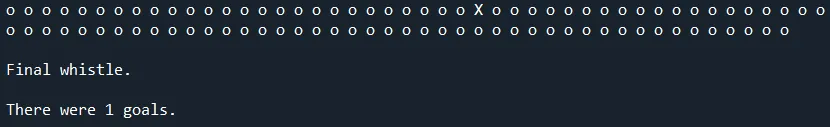
#Count of the number of goalsgoals=0for minute in range(match_minutes):#Generate a random number between 0 and 1. r=rnd.rand(1,1)#Prints an X when there is a goal and a zero otherwise.if (r < prob_per_minute):#Goal - if the random number is less than the goal probability.print('X', end = ' ') goals=goals+1 time.sleep(1) #Longer pauseelse:print('o', end = ' ') time.sleep(0.1) #Short pauseprint('\n')print('Final whistle. \n \nThere were ' + str(goals) + ' goals.')
运行结果:
你的模拟中大约有2到3次会以3个进球结束。大多数比赛的进球数在0到5个之间。你可能只看到一场比赛的进球数为0。
模拟整个赛季的进球情况
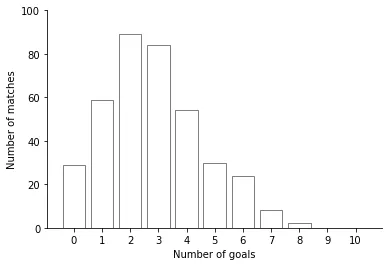
# We now simulate 380 matches of a football season and look at how well it predicts the# distribution of the number of goals. This is done in the code below: we loop over 380 matches,# store the number of goals for each match in array and then we make a histogram of the number of goals.#defsimulateMatch(n, p):# n - number of time units# p - probability per time unit of a goal# display_match == True then display simulation output for match.# Count the number of goals goals = 0for minute in range(n):# Generate a random number between 0 and 1. r = rnd.rand(1, 1)# Prints an X when there is a goal and a zero otherwise.if (r < p):# Goal - if the random number is less than the goal probability. goals = goals + 1return goals# Number of matchesnum_matches = 380# Loop over all the matches and print the number of goals.goals = np.zeros(num_matches)for i in range(num_matches): goals[i] = simulateMatch(match_minutes, prob_per_minute)#print('In match ' + str(i+1) + ' there were ' + str(int(goals[i])) + ' goals.')# Create a histogramfig, ax = plt.subplots(num=1)histogram_range = np.arange(-0.5, 10.51, 1)histogram_goals = np.histogram(goals, histogram_range)ax.bar(histogram_goals[1][:-1] + 0.5, histogram_goals[0], color='white', edgecolor='black', linestyle='-', alpha=0.5)ax.set_ylim(0, 100)ax.spines['top'].set_visible(False)ax.spines['right'].set_visible(False)ax.set_xticks(np.arange(0, 11, step=1))ax.set_yticks(np.arange(0, 101, step=20))ax.set_xlabel('Number of goals')ax.set_ylabel('Number of matches')plt.show()
运行结果:
运行代码几次,并查看生成的直方图。现在我们已经看过这个模拟,我们可以进一步探讨足球比赛中的情况……
总结
导入必要模块:使用 numpy 和 pylab 模块进行数据处理和可视化。
设置参数:定义比赛时间、平均进球数和每分钟进球的概率。
模拟单场比赛:运行模拟以观察进球的随机性,并统计每场比赛中的进球数。
分析结果:通过直方图展示模拟结果,了解进球数的分布情况。
推荐阅读:
Python实战 | 1-使用Statsbomb
Python实战 | 2-使用Wyscout
Python实战 | 3-孙兴慜无逆足吗?
Python | 4-英超曼城角球T检验
关注微信公众号并回复“soccermatics-player”获取GitHub球员的公开数据。关注微信公众号并回复“code”获取完整代码。
仅供学习交流。


 10个月宝宝每天需要喝多少奶粉?
