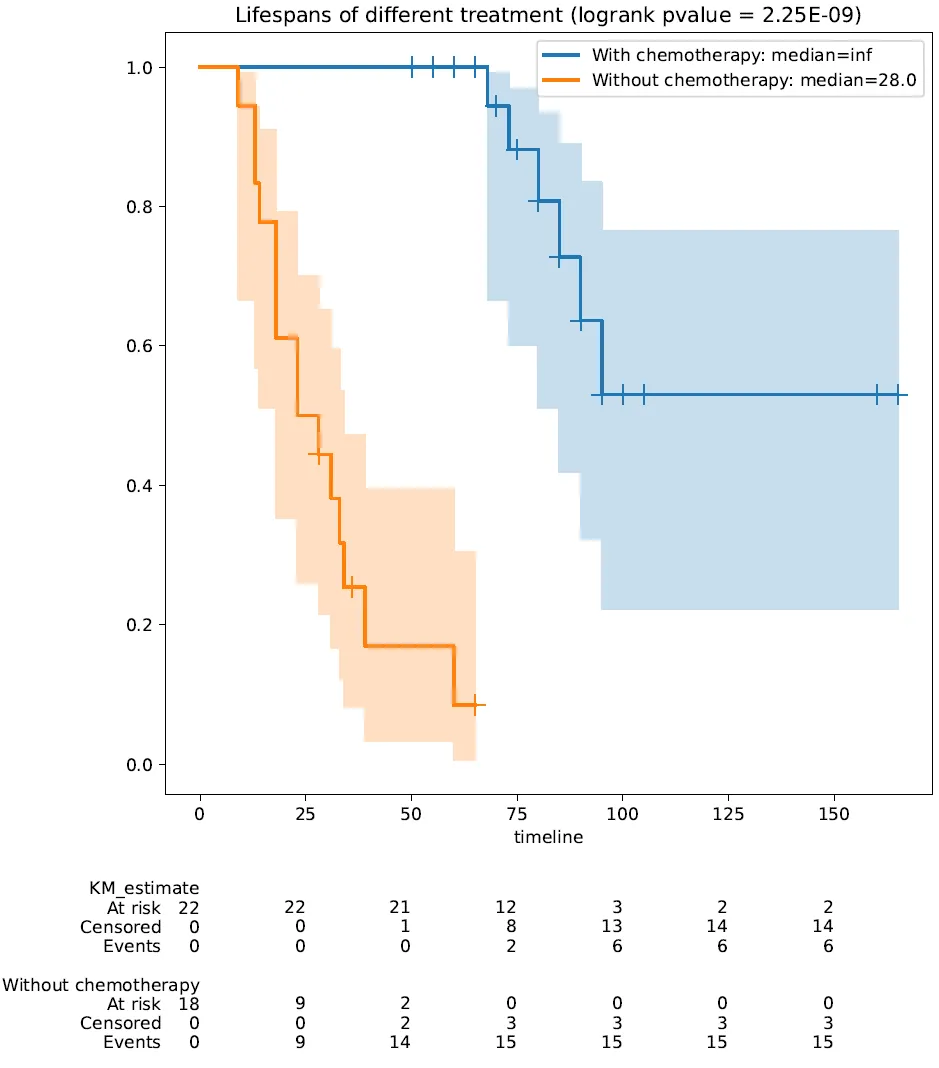
import osimport pandas as pdfrom matplotlib import pyplot as pltfrom lifelines import KaplanMeierFitterfrom lifelines.statistics import logrank_testfrom lifelines.plotting import add_at_risk_counts# 获取当前文件夹路径并切换为工作文件夹work_dir = os.getcwd()os.chdir(work_dir)# 读取数据表格file_path = os.path.join(work_dir, '生存曲线数据实例.xlsx')df = pd.read_excel(file_path)# 展示数据display(df)# 在当前图形中创建一个子图(subplot),111表示 “1 行 1 列的第 1 个子图”(即整个图形仅包含一个子图)。# 变量ax用于引用该子图,后续绘图会指定在这个子图上进行。fig, ax = plt.subplots(1, 1, figsize=(8,8)) # 从 DataFrame df中提取名为Time的列,存储到变量time中。该列通常表示 “生存时间”(如随访时间、事件发生时间等,是生存分析的核心时间变量)。time = df['Time']# 从 DataFrame df中提取名为Status的列,存储到变量event中。# 该列通常是 “事件指示器”(如 1 表示发生了目标事件,如死亡 / 复发;0 表示删失,即未发生事件且随访结束)。event = df['Status']# 创建一个布尔索引dem:当df['Chemotherapy']列的值为"With chemotherapy"(接受化疗)时,dem对应位置为True;否则为False。# 用于将数据分为 “接受化疗” 和 “未接受化疗” 两组。dem = (df['Chemotherapy'] == "With chemotherapy")# 为 “接受化疗” 组单独创建一个 Kaplan-Meier 拟合器实例。kmf_withchemo = KaplanMeierFitter()# 对 “接受化疗” 组的生存数据进行拟合kmf_withchemo.fit(time[dem], event_observed=event[dem])# 计算中位生存期,如果未达到输出为np.infmediansurvival_withchemo = kmf_withchemo.median_survival_time_# 绘制 “接受化疗” 组的生存函数曲线,并指定在之前创建的子图ax上绘制(确保多条曲线在同一图中)。kmf_withchemo.plot(ax=ax, show_censors=True, # 显示删失 label=f"With chemotherapy: median={mediansurvival_withchemo}", # ci_show=False ) # 为 “未接受化疗” 组单独创建一个 Kaplan-Meier 拟合器实例。kmf_withoutchemo = KaplanMeierFitter()# 对 “未接受化疗” 组的生存数据进行拟合kmf_withoutchemo.fit(time[~dem], event_observed=event[~dem], label="Without chemotherapy")# 计算中位生存期,如果未达到输出为np.infmediansurvival_withoutchemo = kmf_withoutchemo.median_survival_time_# 绘制 “未接受化疗” 组的生存函数曲线,同样在子图ax上绘制(与上一组曲线叠加)。kmf_withoutchemo.plot(ax=ax, show_censors=True, # 显示删失 label=f"Without chemotherapy: median={mediansurvival_withoutchemo}", # ci_show=False ) # 调用lifelines库的add_at_risk_counts函数,在生存曲线下方添加 “风险人数”(at-risk counts)标注。# 风险人数表示在某一时间点仍未发生事件且未被删失的样本量,用于直观展示不同时间点两组的有效样本量。add_at_risk_counts(kmf_withchemo, kmf_withoutchemo, ax=ax)# 调用Logrank检验方法,进行组间统计检验分析results = logrank_test(time[dem], time[~dem], event[dem], event[~dem], alpha=.99)# 输出检验结果P值logrank_pvalue = results.p_value # 为图形设置标题:“不同治疗的生存期”,将检验的P值加入到标题中。ax.set_title(f"Lifespans of different treatment (logrank pvalue = {logrank_pvalue:.2E})")# 将绘制好的生存曲线图形保存为 PDF 文件,文件名为Survival plot.pdf。fig.savefig('Survival plot.pdf', bbox_inches='tight')