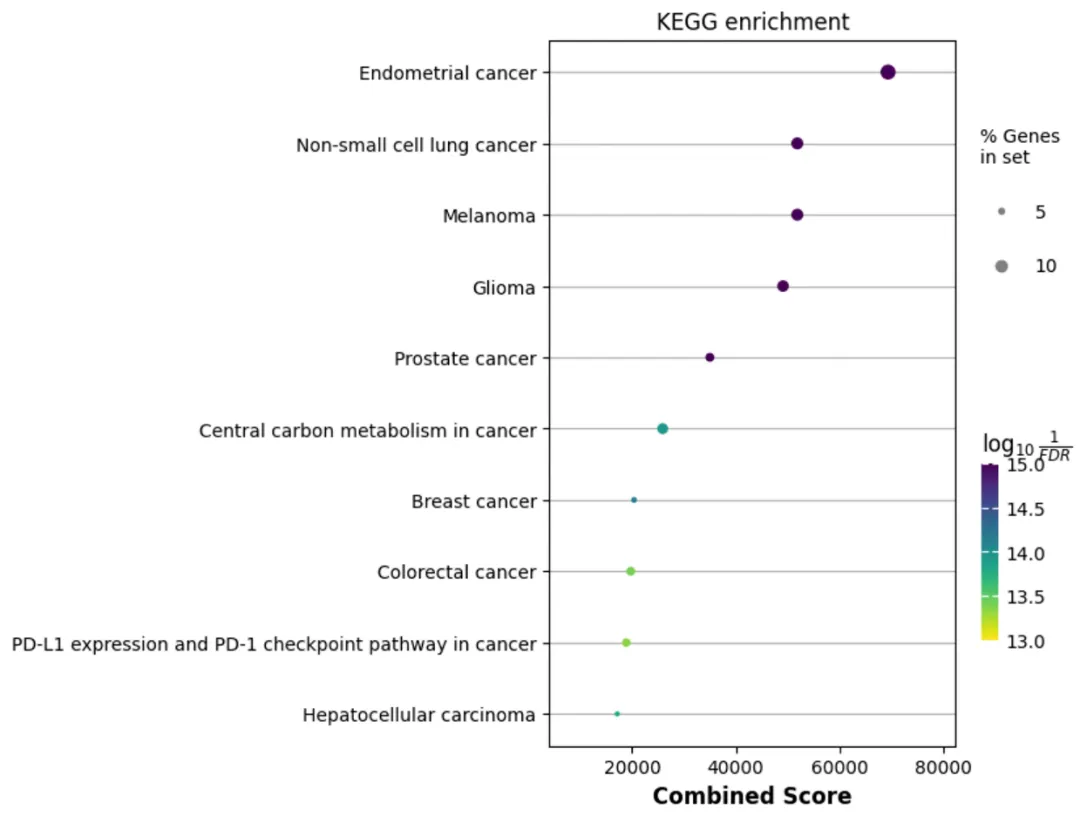
import matplotlib.pyplot as pltimport gseapy as gp# 1. 输入差异基因列表(可从文件读取或直接输入)直接输入基因Symbol(示例)diff_genes = ["TP53", "EGFR", "KRAS", "PTEN", "BRAF", "ALK", "ROS1", "NRAS", "PIK3CA", "AKT1"]# 1. 执行GO富集分析(BP/CC/MF三类)go_enrich = gp.enrichr( gene_list=diff_genes, gene_sets=[ 'GO_Biological_Process_2023', # 生物过程 'GO_Cellular_Component_2023', # 细胞组分 'GO_Molecular_Function_2023' # 分子功能 ], organism='human', # 物种 outdir='./富集分析结果/GO', # 结果保存目录(自动创建) cutoff=0.05 # 显著富集的p值阈值)go_df = go_enrich.results# 2. 查看富集结果(前5行)print("=== GO富集结果(生物过程Top5)===")# print(go_df.head())# 处理一下Term列的值,默认的值太长了,显示起来不好看go_df['Term'] = go_df['Term'].apply(lambda x: str(x).split('(')[0])print(go_df.head())# 3. 可视化富集结果(出版级图表)# GO气泡图(显示前10个显著条目)fig, axs = plt.subplots(3,1, figsize=(5,20))go_lists = ['GO_Biological_Process_2023', # 生物过程 'GO_Cellular_Component_2023', # 细胞组分 'GO_Molecular_Function_2023' # 分子功能 ]x_keyword = 'Combined Score'for (ax, go_list) in zip(axs, go_lists): gp.dotplot(go_df[go_df['Gene_set'] == go_list], column="Adjusted P-value", x=x_keyword, size=20, top_term=10, show_ring=False, # set to False to revmove outer ring ax=ax ) ax.set_title(f"GO {go_list.split('_')[1]}", fontsize=12) ax.set_xlabel(x_keyword, fontsize=12) ax.tick_params(axis='x', labelsize=10) ax.tick_params(axis='y', labelsize=10)fig.savefig("./富集分析结果/GO_BP_dotplot.pdf", dpi=300, bbox_inches='tight') # 保存为PDF(高清)# 4. 执行KEGG富集分析kegg_enrich = gp.enrichr( gene_list=diff_genes, gene_sets='KEGG_2021_Human', # KEGG数据库(人类) organism='human', outdir='./富集分析结果/KEGG', cutoff=0.05)kegg_df = kegg_enrich.resultsprint("\n=== KEGG富集结果Top5 ===")print(kegg_df.head())# 5. KEGG气泡图fig, ax = plt.subplots(1,1, figsize=(5,7))x_keyword = 'Combined Score'gp.dotplot(kegg_df, x=x_keyword, size=10, top_term=10, show_ring=False, # set to False to revmove outer ring ax=ax )ax.set_title(f"KEGG enrichment", fontsize=12)ax.set_xlabel(x_keyword, fontsize=12)ax.tick_params(axis='x', labelsize=10)ax.tick_params(axis='y', labelsize=10)fig.savefig("./富集分析结果/KEGG_dotplot.pdf", dpi=300, bbox_inches='tight')

 10个月宝宝每天需要喝多少奶粉?
