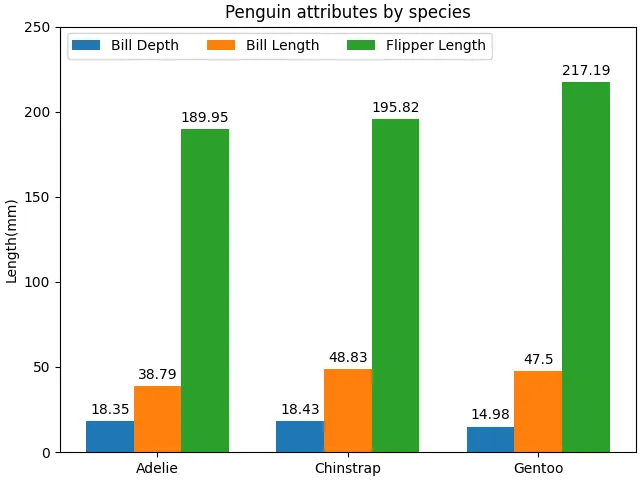
创建分组条形图以及用标签标注条形
- 展示了三种企鹅(Adelie、Chinstrap、Gentoo)在三个身体测量指标(Bill Depth 喙深、Bill Length 喙长、Flipper Length 鳍状肢长)上的平均值。
- 数据来源于 palmerpenguins 数据集。
# data from https://allisonhorst.github.io/palmerpenguins/import matplotlib.pyplot as pltimport numpy as npspecies = ("Adelie", "Chinstrap", "Gentoo")penguin_means = { 'Bill Depth': (18.35, 18.43, 14.98), 'Bill Length': (38.79, 48.83, 47.50), 'Flipper Length': (189.95, 195.82, 217.19),}x = np.arange(len(species)) # the label locationswidth = 0.25 # the width of the barsmultiplier = 0fig, ax = plt.subplots(layout='constrained')for attribute, measurement in penguin_means.items(): offset = width * multiplier rects = ax.bar(x + offset, measurement, width, label=attribute) ax.bar_label(rects, padding=3) multiplier += 1# Add some text for labels, title and custom x-axis tick labels, etc.ax.set_ylabel('Length (mm)')ax.set_title('Penguin attributes by species')ax.set_xticks(x + width, species)ax.legend(loc='upper left', ncols=3)ax.set_ylim(0, 250)plt.show()
# 1. 导入库import matplotlib.pyplot as pltimport numpy as np# 2. 定义数据species = ("Adelie", "Chinstrap", "Gentoo") # 元组,包含三种企鹅的名称,将作为 x 轴的分组标签。penguin_means = { 'Bill Depth': (18.35, 18.43, 14.98), 'Bill Length': (38.79, 48.83, 47.50), 'Flipper Length': (189.95, 195.82, 217.19),}# 字典,键为属性名称,值为包含三个物种对应测量均值的元组,元组顺序与 species 一致。# 例如,'Bill Depth' 对应 Adelie 喙深 18.35 mm,Chinstrap 喙深 18.43 mm,Gentoo 喙深 14.98 mm。# 3. 设置条形位置和宽度x = np.arange(len(species)) # 生成 [0, 1, 2],作为每个物种组的基准 x 坐标。width = 0.25 # 每个条形的宽度(在 x 轴上的占据长度)。multiplier = 0 # 用于计算每个属性组内条形的偏移量。每次绘制一个属性后,multiplier 增加 1,使不同属性的条形在同一个物种组内横向错开,形成分组效果。# 4. 创建图形和坐标轴fix, ax = plt.subplots(layout='constrained') # 使用约束布局,自动调整图形元素的位置,避免标签、图例等重叠。# 5. 循环绘制每个属性的条形图for attribute, measurement in penguin_means.items(): # 遍历 penguin_means 字典,attribute 为属性名(如 'Bill Depth'),measurement 为对应三个物种的均值元组。 offset = width * multiplier # 计算偏移量:offset = width * multiplier。 # 第一个属性时 multiplier=0,偏移为 0; # 第二个属性时 multiplier=1,偏移为 0.25; # 第三个属性时 multiplier=2,偏移为 0.5 rects = ax.bar(x + offset, measurement, width, label=attribute) # x + offset:为每个物种的基准 x 坐标加上偏移量,使同一物种的不同属性条形在 x 轴上错开。 # 例如 Adelie(x=0)的 Bill Depth 条形位于 0 + 0 = 0,Bill Length 位于 0 + 0.25,Flipper Length 位于 0 + 0.5。 # measurement:该属性下三个物种的均值。 # width:条形宽度(0.25)。 # label=attribute:设置图例标签,后续 legend() 会显示这三个属性名。 ax.bar_label(rects, padding=3) # 在每个条形顶部添加数值标签(默认显示条形的数值),padding=3 设置标签与条形顶部之间的间距(单位:点)。 multiplier += 1 # 为下一个属性准备偏移量。# 6. 设置坐标轴标签、标题和刻度ax.set_ylabel('Length(mm)') # y 轴标签为“Length (mm)”ax.set_title('Penguin attributes by species') # 图表标题ax.set_xticks(x + width, species) # 设置 x 轴刻度位置和标签# x + width 是每个物种组的中心位置。由于三个条形分别位于 x, x+0.25, x+0.5,组中心大约在 x + 0.25 处(偏移一个宽度)。# 这里用 width 作为偏移,使刻度标签对准每组条形的中间位置。# species 作为标签显示物种名称。# 7. 添加图例并设置 y 轴范围ax.legend(loc="upper left", ncols=3) # 显示图例,放置在左上角,并将图例分成 3 列,使三个属性名水平排列,节省空间。ax.set_ylim(0, 250) # 设置 y 轴范围为 0 到 250,确保所有条形(最长约 217 mm)完整显示,并留出顶部空间给数值标签。# 8. 显示图形plt.show()

 10个月宝宝每天需要喝多少奶粉?
