Python 图像实战:三阶颜色矩特征提取与直方图可视化对比
Python 图像实战|三阶颜色矩特征提取 + 直方图可视化对比
unsetunset 前言unsetunset
在图像识别、图像检索、植物分类、目标检测任务中,颜色特征是最基础、最常用的底层特征。 而颜色矩凭借计算简单、无需复杂预处理的优势,成为颜色特征提取的经典算法。
今天带大家用 Python + OpenCV 实现:
✅ 三通道(BGR)三阶颜色矩计算
✅ 局部图像裁剪,去除背景干扰
✅ 两张图像颜色特征直方图对比
✅ 硬核代码通俗化拆解,告别看不懂的推导式
unsetunset📌 一、什么是三阶颜色矩?unsetunset
颜色矩通过统计像素颜色分布规律,描述图像色彩信息,分为 3 个维度:
我们对 B、G、R 三个通道 分别计算 3 阶矩,最终得到 9 维颜色特征向量。
unsetunset🛠 二、环境依赖unsetunset
本次实验需要 3 个核心库,提前安装:
pip install opencv-python numpy matplotlib
导入依赖:
import cv2import numpy as npimport matplotlib.pyplot as plt
unsetunset 三、核心代码分步讲解unsetunset
1. 自定义颜色矩提取函数
defcolor_moments(img, trans_hsv=False):# 可选:切换为HSV颜色空间if trans_hsv == True: img = cv2.cvtColor(img, cv2.COLOR_BGR2HSV)# 分离图像三个通道 f, s, t = cv2.split(img) color_feature = []# ========== 一阶矩:均值 ========== f_mean = np.mean(f) s_mean = np.mean(s) t_mean = np.mean(t) color_feature.extend([f_mean, s_mean, t_mean])# ========== 二阶矩:标准差 ========== f_std = np.std(f) s_std = np.std(s) t_std = np.std(t) color_feature.extend([f_std, s_std, t_std])# ========== 三阶矩:偏度 ========== f_skewness = np.mean(abs(f - f.mean()) ** 3) s_skewness = np.mean(abs(s - s.mean()) ** 3) t_skewness = np.mean(abs(t - t.mean()) ** 3) f_thirdMoment = f_skewness ** (1. / 3) s_thirdMoment = s_skewness ** (1. / 3) t_thirdMoment = t_skewness ** (1. / 3) color_feature.extend([f_thirdMoment, s_thirdMoment, t_thirdMoment])return color_feature
2. 读取图像 + 局部裁剪
直接整张图片计算会受背景影响,裁剪目标区域提升特征准确度:
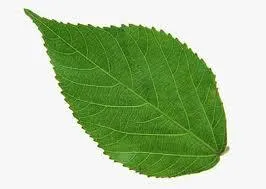
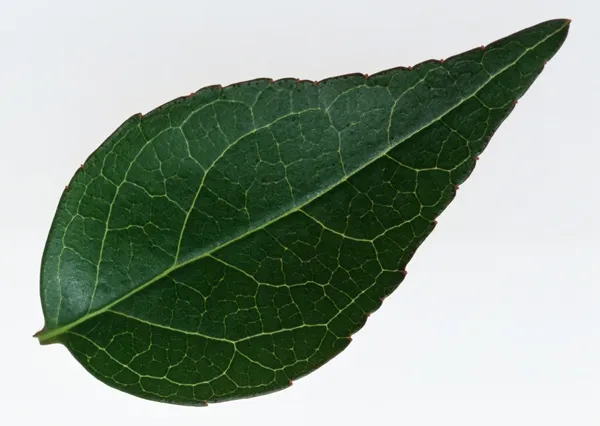
# 读取图像(OpenCV 默认 BGR 格式)img1 = cv2.imread('../data/leaf1.jpg')img2 = cv2.imread('../data/leaf2.jpg')# 裁剪固定区域:[行起始:行结束, 列起始:列结束]img1 = img1[188: 238, 275: 325, :]img2 = img2[69: 119, 108: 158, :]
3. 提取两张图像的颜色特征
img1_feature = color_moments(img1)img2_feature = color_moments(img2)
unsetunset 四、重点难点:标签生成代码通俗改造unsetunset
原代码精简写法(双层列表推导式),新手很难理解:
# 精简写法,看不懂版本labels = [i + j for i in ['一阶', '二阶', '三阶'] for j in ['B', 'G', 'R']]
✅ 改造后:基础 for 循环,直白易懂逻辑完全一致,适合初学者理解双层循环逻辑:
# 定义阶数、通道order_list = ['一阶', '二阶', '三阶']channel_list = ['B', 'G', 'R']# 新建空列表存放标签labels = []# 外层循环:遍历一二三阶for order in order_list:# 内层循环:遍历B/G/R通道for ch in channel_list:# 字符串拼接,加入标签列表 labels.append(order + ch)
最终自动生成 9 个一一对应的坐标轴标签:
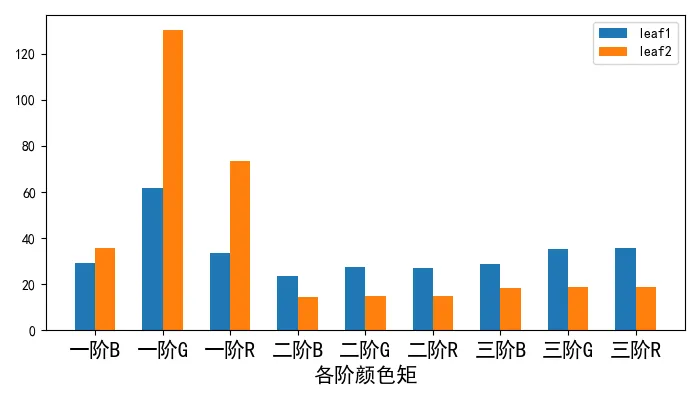
unsetunset 五、绘制对比直方图unsetunset
双柱状图并列展示两张树叶图像的颜色矩差异:
x = np.arange(9)fs = 15# 字体大小plt.figure(figsize=(7, 4))# 左右偏移,防止柱子重叠plt.bar(x - 0.15, img1_feature, width=0.3, label='leaf1')plt.bar(x + 0.15, img2_feature, width=0.3, label='leaf2')plt.xticks(x, labels, fontsize=fs)plt.xlabel('各阶颜色矩', fontsize=fs)plt.legend()plt.tight_layout()plt.show()
unsetunset六、完整整合源码unsetunset
复制即可直接运行,修改图片路径就能替换自定义图片:
import cv2import numpy as npimport matplotlib.pyplot as pltdefcolor_moments(img, trans_hsv=False):if trans_hsv == True: img = cv2.cvtColor(img, cv2.COLOR_BGR2HSV) f, s, t = cv2.split(img) color_feature = []# 一阶矩 f_mean = np.mean(f) s_mean = np.mean(s) t_mean = np.mean(t) color_feature.extend([f_mean, s_mean, t_mean])# 二阶矩 f_std = np.std(f) s_std = np.std(s) t_std = np.std(t) color_feature.extend([f_std, s_std, t_std])# 三阶矩 f_skewness = np.mean(abs(f - f.mean()) ** 3) s_skewness = np.mean(abs(s - s.mean()) ** 3) t_skewness = np.mean(abs(t - t.mean()) ** 3) f_thirdMoment = f_skewness ** (1. / 3) s_thirdMoment = s_skewness ** (1. / 3) t_thirdMoment = t_skewness ** (1. / 3) color_feature.extend([f_thirdMoment, s_thirdMoment, t_thirdMoment])return color_featureif __name__ == '__main__':# 读取并裁剪图像 img1 = cv2.imread('../data/leaf1.jpg') img2 = cv2.imread('../data/leaf2.jpg') img1 = img1[188: 238, 275: 325, :] img2 = img2[69: 119, 108: 158, :]# 提取颜色矩特征 img1_feature = color_moments(img1) img2_feature = color_moments(img2)# 通俗易懂方式生成坐标轴标签 order_list = ['一阶', '二阶', '三阶'] channel_list = ['B', 'G', 'R'] labels = []for order in order_list:for ch in channel_list: labels.append(order + ch)# 绘图 x = np.arange(9) fs = 15 plt.figure(figsize=(7, 4)) plt.bar(x - 0.15, img1_feature, width=0.3, label='leaf1') plt.bar(x + 0.15, img2_feature, width=0.3, label='leaf2') plt.xticks(x, labels, fontsize=fs) plt.xlabel('各阶颜色矩', fontsize=fs) plt.legend() plt.tight_layout() plt.show()
 10个月宝宝每天需要喝多少奶粉?
