Python 可视化升级版:动态太阳系模拟
✨Python 可视化升级版!带中文标注 + 专业图例的动态太阳系模拟
哈喽各位 Python 爱好者!
unsetunset🎯 升级后核心效果unsetunset
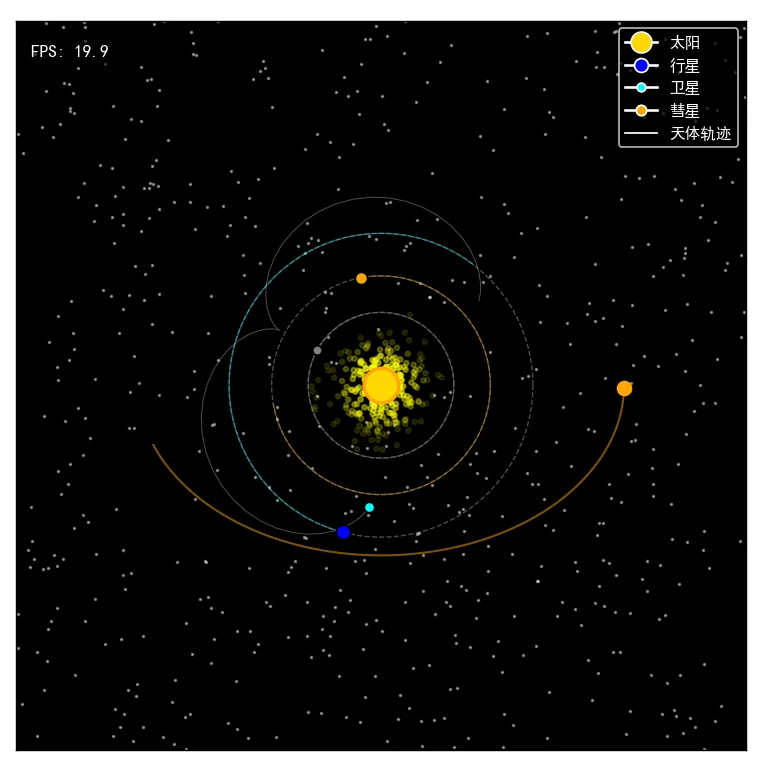
✅ 中文标题 / 标签,彻底解决乱码
✅ 黑色星空背景 + 高斯渐变太阳光晕
✅ 水星、金星、地球(带月球)完整公转
✅ 椭圆轨道彗星漫游,拖尾效果拉满
✅ 动态轨迹拖尾 + 实时 FPS 显示
✅ 专业图例标注(太阳 / 行星 / 卫星 / 彗星 / 轨迹)
✅ 坐标轴标注「天文单位」,科普感拉满
✅ 支持一键导出 GIF 动图
unsetunset📦 一行安装依赖unsetunset
仅需 3 个 Python 库,数值计算 + 可视化 + 统计分布全覆盖:
pip install numpy matplotlib scipy
unsetunset🌟 完整可运行源码(直接复制)unsetunset
优化版代码,注释详细,中文完美显示:
import numpy as npimport matplotlib.pyplot as pltfrom matplotlib.animation import FuncAnimationimport timefrom scipy.stats import multivariate_normalplt.rcParams['font.sans-serif'] = ['SimHei'] # 解决中文显示乱码# ==================== 全局配置 ====================fig, ax = plt.subplots(figsize=(12, 10))ax.set_xlim(-6, 6)ax.set_ylim(-6, 6)ax.set_aspect('equal')ax.set_facecolor('black')# 中文标题+坐标轴ax.set_title("太阳系天体运动模拟", color='white', fontsize=14, pad=20)ax.set_xlabel("距离 (天文单位)", color='white', fontsize=10)ax.set_ylabel("距离 (天文单位)", color='white', fontsize=10)ax.tick_params(colors='white') # 坐标轴刻度颜色# 轨迹长度(每个天体保留最近的点数)TRAIL_LEN = 60# ---------- 星空背景 ----------stars = np.random.rand(600, 2) * 12 - 6ax.scatter(stars[:,0], stars[:,1], s=1, c='white', alpha=0.4, zorder=0)# ==================== 太阳光晕配置 ====================halo_config = {'type': 'gaussian', # 光晕类型:均匀/高斯'n_points': 300, # 光晕粒子数'radius_range': (0.2, 1.3), # 光晕半径范围'sigma': 0.4, # 高斯分布标准差'alpha_range': (0.8, 0.1) # 透明度渐变}# 生成高斯光晕函数defcreate_halo(center=(0,0), config=halo_config):if config['type'] == 'uniform': radii = np.random.uniform(config['radius_range'][0], config['radius_range'][1], config['n_points']) angles = np.random.uniform(0, 2*np.pi, config['n_points']) x = radii * np.cos(angles) + center[0] y = radii * np.sin(angles) + center[1] alpha = np.interp(radii, [config['radius_range'][0], config['radius_range'][1]], [config['alpha_range'][0], config['alpha_range'][1]])elif config['type'] == 'gaussian': cov = [[config['sigma']**2, 0], [0, config['sigma']**2]] points = multivariate_normal.rvs(mean=center, cov=cov, size=config['n_points']) x, y = points[:,0], points[:,1] radii = np.sqrt((x-center[0])**2 + (y-center[1])**2) max_radius = 2*config['sigma'] alpha = np.interp(radii, [0, max_radius], [config['alpha_range'][0], config['alpha_range'][1]])else:raise ValueError("光晕类型只能是 'uniform' 或 'gaussian'")return x, y, alpha# 绘制太阳+光晕halo_x, halo_y, halo_alpha = create_halo()halo_scatter = ax.scatter(halo_x, halo_y, s=8, c='yellow', alpha=halo_alpha, zorder=2)sun = ax.scatter(0, 0, s=400, c='gold', edgecolors='orange', linewidth=2, zorder=3)# ==================== 行星数据 ====================planets = [ {'name': '水星', 'color': 'gray', 'size': 30, 'radius': 1.2, 'speed': 0.12, 'orbit_color': 'white', 'trail_color': 'gray'}, {'name': '金星', 'color': 'orange', 'size': 50, 'radius': 1.8, 'speed': 0.08, 'orbit_color': 'white', 'trail_color': 'orange'}, {'name': '地球', 'color': 'blue', 'size': 70, 'radius': 2.5, 'speed': 0.06, 'orbit_color': 'white', 'trail_color': 'cyan'},]planet_objs = [] # 行星对象planet_trails = [] # 行星轨迹planet_trail_data = [] # 轨迹坐标数据orbit_objs = [] # 静态轨道线angles = [0.0] * len(planets)# 初始化行星、轨道、轨迹for i, p in enumerate(planets): planet, = ax.plot([], [], 'o', markersize=np.sqrt(p['size']), color=p['color'], markeredgecolor='black', zorder=5) planet_objs.append(planet) trail, = ax.plot([], [], '-', color=p['trail_color'], alpha=0.4, linewidth=0.8, zorder=2) planet_trails.append(trail) planet_trail_data.append([[], []])# 绘制圆形轨道 theta = np.linspace(0, 2*np.pi, 200) x_orbit = p['radius'] * np.cos(theta) y_orbit = p['radius'] * np.sin(theta) orbit, = ax.plot(x_orbit, y_orbit, '--', color=p['orbit_color'], alpha=0.3, linewidth=0.8, zorder=1) orbit_objs.append(orbit)# ==================== 卫星数据(月球) ====================satellites = [ {'parent_idx': 2, 'radius': 0.6, 'speed': 0.25, 'color': 'cyan', 'size': 6, 'trail_color': 'lightcyan'},]sat_objs = []sat_trails = []sat_trail_data = []sat_angles = [0.0] * len(satellites)for sat in satellites: sat_obj, = ax.plot([], [], 'o', markersize=sat['size'], color=sat['color'], markeredgecolor='black', zorder=5) sat_objs.append(sat_obj) trail, = ax.plot([], [], '-', color=sat['trail_color'], alpha=0.3, linewidth=0.6, zorder=2) sat_trails.append(trail) sat_trail_data.append([[], []])# ==================== 彗星数据(椭圆轨道) ====================comets = [ {'a': 4.0, 'b': 2.8, 'speed': 0.035, 'color': 'orange', 'trail_len': 80, 'size': 8, 'trail_color': 'orange'},]comet_objs = []comet_trails = []comet_trail_data = []comet_angles = [0.0] * len(comets)for i, com in enumerate(comets): comet, = ax.plot([], [], 'o', markersize=com['size'], color=com['color'], markeredgecolor='orange', zorder=6) comet_objs.append(comet) trail, = ax.plot([], [], '-', color=com['trail_color'], alpha=0.5, linewidth=1.2, zorder=4) comet_trails.append(trail) comet_trail_data.append([[], []])# ==================== 专业图例(静态) ====================sun_patch = plt.Line2D([0], [0], marker='o', color='w', markerfacecolor='gold', markersize=12, label='太阳')planet_patch = plt.Line2D([0], [0], marker='o', color='w', markerfacecolor='blue', markersize=8, label='行星')satellite_patch = plt.Line2D([0], [0], marker='o', color='w', markerfacecolor='cyan', markersize=5, label='卫星')comet_patch = plt.Line2D([0], [0], marker='o', color='w', markerfacecolor='orange', markersize=6, label='彗星')trail_patch = plt.Line2D([0], [0], color='white', linestyle='-', linewidth=1, label='天体轨迹')legend = ax.legend(handles=[sun_patch, planet_patch, satellite_patch, comet_patch, trail_patch], loc='upper right', fontsize=9, facecolor='black', edgecolor='white', labelcolor='white')legend.get_frame().set_alpha(0.7)# ==================== 实时帧率显示 ====================fps_text = ax.text(0.02, 0.95, '', transform=ax.transAxes, color='white', fontsize=10, bbox=dict(facecolor='black', alpha=0.5))last_time = time.time()frame_count = 0# ==================== 轨迹更新函数 ====================defupdate_trail(trail_data, x, y, trail_len): xlist, ylist = trail_data xlist.append(x) ylist.append(y)# 限制轨迹长度if len(xlist) > trail_len: xlist.pop(0) ylist.pop(0)return xlist, ylist# ==================== 动画核心更新函数 ====================defupdate(frame):global last_time, frame_count# 1. 更新行星位置与轨迹for i, p in enumerate(planets): angles[i] += p['speed'] x = p['radius'] * np.cos(angles[i]) y = p['radius'] * np.sin(angles[i]) planet_objs[i].set_data([x], [y]) trail_x, trail_y = update_trail(planet_trail_data[i], x, y, TRAIL_LEN) planet_trails[i].set_data(trail_x, trail_y)# 2. 更新卫星(绕行星旋转)for i, sat in enumerate(satellites): sat_angles[i] += sat['speed'] parent_idx = sat['parent_idx'] parent_angle = angles[parent_idx] parent_r = planets[parent_idx]['radius'] parent_x = parent_r * np.cos(parent_angle) parent_y = parent_r * np.sin(parent_angle) rel_x = sat['radius'] * np.cos(sat_angles[i]) rel_y = sat['radius'] * np.sin(sat_angles[i]) sat_x = parent_x + rel_x sat_y = parent_y + rel_y sat_objs[i].set_data([sat_x], [sat_y]) trail_x, trail_y = update_trail(sat_trail_data[i], sat_x, sat_y, TRAIL_LEN) sat_trails[i].set_data(trail_x, trail_y)# 3. 更新彗星(椭圆轨道)for i, com in enumerate(comets): comet_angles[i] += com['speed'] x = com['a'] * np.cos(comet_angles[i]) y = com['b'] * np.sin(comet_angles[i]) comet_objs[i].set_data([x], [y]) trail_x, trail_y = update_trail(comet_trail_data[i], x, y, com['trail_len']) comet_trails[i].set_data(trail_x, trail_y)# 4. 计算实时FPS current_time = time.time() elapsed = current_time - last_timeif elapsed > 0: fps = frame_count / elapsed fps_text.set_text(f'FPS: {fps:.1f}') frame_count += 1return (planet_objs + planet_trails + sat_objs + sat_trails + comet_objs + comet_trails + [fps_text])# ==================== 启动动画 ====================ani = FuncAnimation(fig, update, frames=2000, interval=30, blit=True)plt.show()# 可选:保存为GIF动图(需安装pillow)# ani.save('solar_system_with_legend.gif', writer='pillow', fps=30)
unsetunset📝 核心升级点解析(对比基础版)unsetunset
1. 中文显示完美修复
添加一行代码,解决 Matplotlib 中文乱码问题,标题、标签全正常显示:
plt.rcParams['font.sans-serif'] = ['SimHei']
2. 专业界面标注
坐标轴 / 刻度改为白色,适配黑色背景,视觉更舒适
3. 高清智能图例
自动生成太阳、行星、卫星、彗星、轨迹的统一图例,无需手动标注,适合教学 / 展示使用。
4. 画布优化
调整为 12×10 比例,预留充足空间展示图例和标题,整体布局更美观。
unsetunset🎨 零基础自定义教程unsetunset
不用改核心逻辑,修改参数就能打造专属太阳系:
添加行星:在 planets 列表中复制字典,修改名称、颜色、轨道半径即可
修改轨迹:调整 TRAIL\_LEN 控制拖尾长短
新增彗星:在 comets 中添加字典,修改 a/b 调整椭圆轨道形状
更换颜色:支持英文颜色 / 十六进制色值,自由搭配
unsetunset🎥 一键保存 GIF 动图unsetunset
取消最后两行注释,即可生成高清动图,发朋友圈 / PPT 超合适:
ani.save('solar_system_with_legend.gif', writer='pillow', fps=30)
💡 保存时动画会后台渲染,等待 10-20 秒即可生成。
unsetunset💡 写在最后unsetunset
这个升级版太阳系模拟,完美兼顾了可视化效果、科普规范性、代码可读性,是 Python 新手学习「数值计算 + 动画可视化」的绝佳练手项目。
从简单的散点星空,到复杂的多天体联动运动,一步步拆解,你会彻底掌握 Matplotlib 动画的核心逻辑~
快运行代码,看看属于你的专属动态太阳系吧!🚀
 10个月宝宝每天需要喝多少奶粉?