Python | ERA5任意经纬度风矢量剖面绘制
摘要
既然做了wrf的风剖面绘制,那么ERA5也一起做了当然还是基于metpy的函数
个人信息
公众号:气python风雨
 Image Name
关注我获取更多学习资料,第一时间收到我的Python学习资料,也可获取我的联系方式沟通合作
导入必要的库
import xarray as xrimport numpy as npimport matplotlib.pyplot as pltimport cartopy.crs as ccrsimport cartopy.feature as cfeaturefrom metpy.interpolate import cross_sectionfrom matplotlib.colors import Normalize
数据读取
# 加载 ERA5 数据file_path = '/home/mw/input/era58091/ERA5-2023-08_pl.nc'ds = xr.open_dataset(file_path)### 定义剖面起点和终点# 定义剖面起点和终点(经纬度)start_point = (45, 100.0) # (lat, lon)end_point = (20, 130.0) # (lat, lon)### 5. 使用 MetPy 提取剖面数据# 取第一个时刻,将数据转换为 MetPy 的 CF 标准格式ds = ds.isel(time=0).metpy.parse_cf()# 使用 MetPy 的 cross_section 函数提取剖面数据cross = cross_section(ds, start_point, end_point)print(cross)
<xarray.Dataset> Size: 210kBDimensions: (level: 37, index: 100)Coordinates: * level (level) int32 148B 1 2 3 5 7 10 20 ... 875 900 925 950 975 1000 time datetime64[ns] 8B 2023-08-02 metpy_crs object 8B Projection: latitude_longitude longitude (index) float64 800B 100.0 100.4 100.8 ... 129.5 129.8 130.0 latitude (index) float64 800B 45.0 44.79 44.59 44.38 ... 20.56 20.28 20.0 * index (index) int64 800B 0 1 2 3 4 5 6 7 8 ... 92 93 94 95 96 97 98 99Data variables: z (level, index) float64 30kB 4.752e+05 4.751e+05 ... 445.0 507.9 r (level, index) float64 30kB -0.0005798 -0.0005798 ... 87.7 89.32 t (level, index) float64 30kB 259.9 259.9 260.1 ... 299.6 299.3 q (level, index) float64 30kB 4.048e-06 4.048e-06 ... 0.01905 0.019 u (level, index) float64 30kB -39.16 -38.9 -38.8 ... 8.306 7.847 v (level, index) float64 30kB 2.141 2.308 2.252 ... 13.12 13.05 w (level, index) float64 30kB -0.00102 -0.001254 ... 0.01719Attributes: Conventions: CF-1.6 history: 2024-01-09 16:38:26 GMT by grib_to_netcdf-2.25.1: /opt/ecmw...
计算切向与法向风
import metpy.calc as mpcalc### 6. 计算沿剖面的风场数据cross['t_wind'], cross['n_wind'] = mpcalc.cross_section_components( cross['u'], cross['v'])
计算W(m/s)
cross['vertical_velocity'] = mpcalc.vertical_velocity( cross['w'], cross['level'], cross['t'])
绘图
import matplotlib.pyplot as pltimport numpy as np# 设置LaTeX字体plt.rcParams['text.usetex'] = Trueplt.rcParams['font.family'] = 'serif'plt.rcParams['font.serif'] = ['Times New Roman'] # 使用Times New Roman字体# 定义图形对象和主坐标轴fig, ax = plt.subplots(1, 1, figsize=(12., 8.), dpi=200)# 绘制相对湿度的等高线图rh_contour = ax.contourf(cross['longitude'], cross['level'], cross['vertical_velocity'], levels=10, cmap='YlGnBu')rh_colorbar = fig.colorbar(rh_contour)rh_colorbar.set_label(r'$\omega$ (m/s)') # 使用LaTeX格式的标签# 绘制风场箭头,使用自定义索引以减少箭头的密度wind_slc_vert = list(range(0, 19, 2)) + list(range(19, 29))wind_slc_horz = slice(5, 100, 5)ax.quiver(cross['longitude'][::2], cross['level'][::2], cross['t_wind'][::2,::2], cross['vertical_velocity'][::2,::2]* 100, color='k')# 设置y轴反向(气压递减)ax.invert_yaxis()# 设置标题和标签ax.set_title(r'Vertical Velocity ($\omega$) and Wind Vectors', fontsize=16)ax.set_ylabel(r'Pressure (hPa)', fontsize=14)ax.set_xlabel(r'Longitude (degrees east)', fontsize=14)# 设置刻度字体大小ax.tick_params(axis='both', which='major', labelsize=12)# 增加网格线ax.grid(True, linestyle='--', alpha=0.6)# 显示图形plt.show()
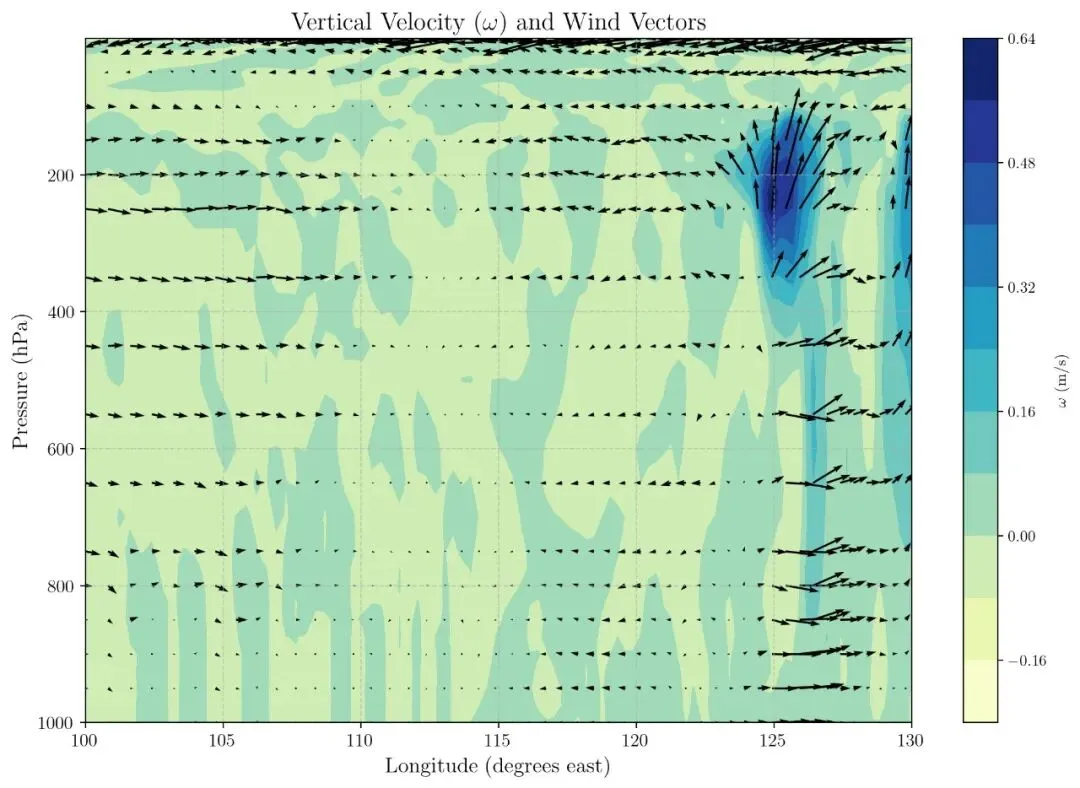
总结
这次的代码没什么难点,主要是涉及单位转换 pa/s 转为 m/s和wrf不同,metpy提供了直接的转换切向法向的函数,非常全面,不过不晓得有没有画错
 10个月宝宝每天需要喝多少奶粉?
