当前位置:首页>Linux>深入分析 Linux 网络丢包问题

深入分析 Linux 网络丢包问题

  • 2026-06-27 23:44:42
深入分析 Linux 网络丢包问题
所谓丢包,是指在网络数据的收发过程中,由于种种原因,数据包还没传输到应用程序中,就被丢弃了。这些被丢弃包的数量,除以总的传输包数,也就是我们常说的丢包率。丢包率是网络性能中最核心的指标之一。丢包通常会带来严重的性能下降,特别是对 TCP 来说,丢包通常意味着网络拥塞和重传,进而还会导致网络延迟增大、吞吐降低。

一、 哪里可能丢包

接下来,我就以最常用的反向代理服务器 Nginx 为例,带你一起看看如何分析网络丢包的问题。执行下面的 hping3 命令,进一步验证 Nginx 是不是可以正常访问。这里我没有使用 ping,是因为 ping 基于 ICMP 协议,而 Nginx 使用的是 TCP 协议。微信搜索公众号:信安黑客技术,回复:黑客 领取资料 。

# -c表示发送10个请求,-S表示使用TCP SYN,-p指定端口为80
hping3 -c 10 -S -p 80 192.168.0.30

HPING 192.168.0.30 (eth0 192.168.0.30): S set, 40 headers + 0 data bytes
len=44 ip=192.168.0.30 ttl=63 DF id=0 sport=80 flags=SA seq=3 win=5120 rtt=7.5 ms
len=44 ip=192.168.0.30 ttl=63 DF id=0 sport=80 flags=SA seq=4 win=5120 rtt=7.4 ms
len=44 ip=192.168.0.30 ttl=63 DF id=0 sport=80 flags=SA seq=5 win=5120 rtt=3.3 ms
len=44 ip=192.168.0.30 ttl=63 DF id=0 sport=80 flags=SA seq=7 win=5120 rtt=3.0 ms
len=44 ip=192.168.0.30 ttl=63 DF id=0 sport=80 flags=SA seq=6 win=5120 rtt=3027.2 ms

--- 192.168.0.30 hping statistic ---
10 packets transmitted, 5 packets received, 50% packet loss
round-trip min/avg/max = 3.0/609.7/3027.2 ms

从 hping3 的输出中,我们可以发现,发送了 10 个请求包,却只收到了 5 个回复,50%的包都丢了。再观察每个请求的 RTT 可以发现,RTT 也有非常大的波动变化,小的时候只有 3ms,而大的时候则有 3s。根据这些输出,我们基本能判断,已经发生了丢包现象。可以猜测,3s 的 RTT ,很可能是因为丢包后重传导致的。

那到底是哪里发生了丢包呢?排查之前,我们可以回忆一下 Linux 的网络收发流程,先从理论上分析,哪里有可能会发生丢包。你不妨拿出手边的笔和纸,边回忆边在纸上梳理,思考清楚再继续下面的内容。在这里,为了帮你理解网络丢包的原理,我画了一张图,你可以保存并打印出来使用

从图中你可以看出,可能发生丢包的位置,实际上贯穿了整个网络协议栈。换句话说,全程都有丢包的可能。

  • 在两台 VM 连接之间,可能会发生传输失败的错误,比如网络拥塞、线路错误等;
  • 在网卡收包后,环形缓冲区可能会因为溢出而丢包;
  • 在链路层,可能会因为网络帧校验失败、QoS 等而丢包;
  • 在 IP 层,可能会因为路由失败、组包大小超过 MTU 等而丢包;
  • 在传输层,可能会因为端口未监听、资源占用超过内核限制等而丢包;
  • 在套接字层,可能会因为套接字缓冲区溢出而丢包;
  • 在应用层,可能会因为应用程序异常而丢包;
  • 此外,如果配置了 iptables 规则,这些网络包也可能因为 iptables 过滤规则而丢包
当然,上面这些问题,还有可能同时发生在通信的两台机器中。不过,由于我们没对 VM2做任何修改,并且 VM2 也只运行了一个最简单的 hping3 命令,这儿不妨假设它是没有问题的。为了简化整个排查过程,我们还可以进一步假设, VM1 的网络和内核配置也没问题。接下来,就可以从协议栈中,逐层排查丢包问题。

二、 链路层

当链路层由于缓冲区溢出等原因导致网卡丢包时,Linux 会在网卡收发数据的统计信息中记录下收发错误的次数。可以通过 ethtool 或者 netstat ,来查看网卡的丢包记录。

netstat -i

Kernel Interface table
Iface      MTU    RX-OK RX-ERR RX-DRP RX-OVR    TX-OK TX-ERR TX-DRP TX-OVR Flg
eth0       100       31      0      0 0             8      0      0      0 BMRU
lo       65536        0      0      0 0             0      0      0      0 LRU

RX-OK、RX-ERR、RX-DRP、RX-OVR ,分别表示接收时的总包数、总错误数、进入 Ring Buffer 后因其他原因(如内存不足)导致的丢包数以及 Ring Buffer 溢出导致的丢包数。

TX-OK、TX-ERR、TX-DRP、TX-OVR 也代表类似的含义,只不过是指发送时对应的各个指标。

这里我们没有发现任何错误,说明虚拟网卡没有丢包。不过要注意,如果用 tc 等工具配置了 QoS,那么 tc 规则导致的丢包,就不会包含在网卡的统计信息中。所以接下来,我们还要检查一下 eth0 上是否配置了 tc 规则,并查看有没有丢包。添加 -s 选项,以输出统计信息:

tc -s qdisc show dev eth0

qdisc netem 800d: root refcnt 2 limit 1000 loss 30%
 Sent 432 bytes 8 pkt (dropped 4, overlimits 0 requeues 0)
 backlog 0b 0p requeues 0

可以看到, eth0 上配置了一个网络模拟排队规则(qdisc netem),并且配置了丢包率为 30%(loss 30%)。再看后面的统计信息,发送了 8 个包,但是丢了 4个。看来应该就是这里导致 Nginx 回复的响应包被 netem 模块给丢了。

既然发现了问题,解决方法也很简单,直接删掉 netem 模块就可以了。执行下面的命令,删除 tc 中的 netem 模块:

tc qdisc del dev eth0 root netem loss 30%

删除后,重新执行之前的 hping3 命令,看看现在还有没有问题:

hping3 -c 10 -S -p 80 192.168.0.30

HPING 192.168.0.30 (eth0 192.168.0.30): S set, 40 headers + 0 data bytes
len=44 ip=192.168.0.30 ttl=63 DF id=0 sport=80 flags=SA seq=0 win=5120 rtt=7.9 ms
len=44 ip=192.168.0.30 ttl=63 DF id=0 sport=80 flags=SA seq=2 win=5120 rtt=1003.8 ms
len=44 ip=192.168.0.30 ttl=63 DF id=0 sport=80 flags=SA seq=5 win=5120 rtt=7.6 ms
len=44 ip=192.168.0.30 ttl=63 DF id=0 sport=80 flags=SA seq=6 win=5120 rtt=7.4 ms
len=44 ip=192.168.0.30 ttl=63 DF id=0 sport=80 flags=SA seq=9 win=5120 rtt=3.0 ms

--- 192.168.0.30 hping statistic ---
10 packets transmitted, 5 packets received, 50% packet loss
round-trip min/avg/max = 3.0/205.9/1003.8 ms
不幸的是,从 hping3 的输出中可以看到还是 50% 的丢包,RTT 的波动也仍旧很大,从 3ms 到 1s。显然,问题还是没解决,丢包还在继续发生。不过,既然链路层已经排查完了,我们就继续向上层分析,看看网络层和传输层有没有问题。

三、 网络层和传输层

在网络层和传输层中,引发丢包的因素非常多。不过,其实想确认是否丢包,是非常简单的事,因为 Linux 已经为我们提供了各个协议的收发汇总情况。执行 netstat -s 命令,可以看到协议的收发汇总,以及错误信息:

netstat -s
#输出
Ip:
    Forwarding: 1          //开启转发
    31 total packets received    //总收包数
    0 forwarded            //转发包数
    0 incoming packets discarded  //接收丢包数
    25 incoming packets delivered  //接收的数据包数
    15 requests sent out      //发出的数据包数
Icmp:
    0 ICMP messages received    //收到的ICMP包数
    0 input ICMP message failed    //收到ICMP失败数
    ICMP input histogram:
    0 ICMP messages sent      //ICMP发送数
    0 ICMP messages failed      //ICMP失败数
    ICMP output histogram:
Tcp:
    0 active connection openings  //主动连接数
    0 passive connection openings  //被动连接数
    11 failed connection attempts  //失败连接尝试数
    0 connection resets received  //接收的连接重置数
    0 connections established    //建立连接数
    25 segments received      //已接收报文数
    21 segments sent out      //已发送报文数
    4 segments retransmitted    //重传报文数
    0 bad segments received      //错误报文数
    0 resets sent          //发出的连接重置数
Udp:
    0 packets received
    ...
TcpExt:
    11 resets received for embryonic SYN_RECV sockets  //半连接重置数
    0 packet headers predicted
    TCPTimeouts: 7    //超时数
    TCPSynRetrans: 4  //SYN重传数
  ...

etstat 汇总了 IP、ICMP、TCP、UDP 等各种协议的收发统计信息。不过,我们的目的是排查丢包问题,所以这里主要观察的是错误数、丢包数以及重传数。可以看到,只有 TCP 协议发生了丢包和重传,分别是:

  • 11 次连接失败重试(11 failed connection attempts)
  • 4 次重传(4 segments retransmitted)
  • 11 次半连接重置(11 resets received for embryonic SYN_RECV sockets)
  • 4 次 SYN 重传(TCPSynRetrans)
  • 7 次超时(TCPTimeouts)
这个结果告诉我们,TCP 协议有多次超时和失败重试,并且主要错误是半连接重置。换句话说,主要的失败,都是三次握手失败。不过,虽然在这儿看到了这么多失败,但具体失败的根源还是无法确定。所以,我们还需要继续顺着协议栈来分析。接下来的几层又该如何分析呢?

四、 iptables

首先,除了网络层和传输层的各种协议,iptables 和内核的连接跟踪机制也可能会导致丢包。所以,这也是发生丢包问题时我们必须要排查的一个因素。

先来看看连接跟踪,要确认是不是连接跟踪导致的问题,只需要对比当前的连接跟踪数和最大连接跟踪数即可。

# 主机终端中查询内核配置
$ sysctl net.netfilter.nf_conntrack_max
net.netfilter.nf_conntrack_max = 262144
$ sysctl net.netfilter.nf_conntrack_count
net.netfilter.nf_conntrack_count = 182

可以看到,连接跟踪数只有 182,而最大连接跟踪数则是 262144。显然,这里的丢包,不可能是连接跟踪导致的。

接着,再来看 iptables。回顾一下 iptables 的原理,它基于 Netfilter 框架,通过一系列的规则,对网络数据包进行过滤(如防火墙)和修改(如 NAT)。这些 iptables 规则,统一管理在一系列的表中,包括 filter、nat、mangle(用于修改分组数据) 和 raw(用于原始数据包)等。而每张表又可以包括一系列的链,用于对 iptables 规则进行分组管理。

对于丢包问题来说,最大的可能就是被 filter 表中的规则给丢弃了。要弄清楚这一点,就需要我们确认,那些目标为 DROP 和 REJECT 等会弃包的规则,有没有被执行到。可以直接查询 DROP 和 REJECT 等规则的统计信息,看看是否为0。如果不是 0 ,再把相关的规则拎出来进行分析。

iptables -t filter -nvL
#输出
Chain INPUT (policy ACCEPT 25 packets, 1000 bytes)
 pkts bytes target     prot opt in     out     source               destination
    6   240 DROP       all  --  *      *       0.0.0.0/0            0.0.0.0/0            statistic mode random probability 0.29999999981

Chain FORWARD (policy ACCEPT 0 packets, 0 bytes)
 pkts bytes target     prot opt in     out     source               destination

Chain OUTPUT (policy ACCEPT 15 packets, 660 bytes)
 pkts bytes target     prot opt in     out     source               destination
    6   264 DROP       all  --  *      *       0.0.0.0/0            0.0.0.0/0            statistic mode random probability 0.29999999981

从 iptables 的输出中,你可以看到,两条 DROP 规则的统计数值不是 0,它们分别在INPUT 和 OUTPUT 链中。这两条规则实际上是一样的,指的是使用 statistic 模块,进行随机 30% 的丢包。0.0.0.0/0 表示匹配所有的源 IP 和目的 IP,也就是会对所有包都进行随机 30% 的丢包。看起来,这应该就是导致部分丢包的“罪魁祸首”了。

执行下面的两条 iptables 命令,删除这两条 DROP 规则。

root@nginx:/# iptables -t filter -D INPUT -m statistic --mode random --probability 0.30 -j DROP
root@nginx:/# iptables -t filter -D OUTPUT -m statistic --mode random --probability 0.30 -j DROP

再次执行刚才的 hping3 命令,看看现在是否正常

hping3 -c 10 -S -p 80 192.168.0.30
#输出
HPING 192.168.0.30 (eth0 192.168.0.30): S set, 40 headers + 0 data bytes
len=44 ip=192.168.0.30 ttl=63 DF id=0 sport=80 flags=SA seq=0 win=5120 rtt=11.9 ms
len=44 ip=192.168.0.30 ttl=63 DF id=0 sport=80 flags=SA seq=1 win=5120 rtt=7.8 ms
...
len=44 ip=192.168.0.30 ttl=63 DF id=0 sport=80 flags=SA seq=9 win=5120 rtt=15.0 ms

--- 192.168.0.30 hping statistic ---
10 packets transmitted, 10 packets received, 0% packet loss
round-trip min/avg/max = 3.3/7.9/15.0 ms

这次输出你可以看到,现在已经没有丢包了,并且延迟的波动变化也很小。看来,丢包问题应该已经解决了。

不过,到目前为止,我们一直使用的 hping3 工具,只能验证案例 Nginx 的 80 端口处于正常监听状态,却还没有访问 Nginx 的 HTTP 服务。所以,不要匆忙下结论结束这次优化,我们还需要进一步确认,Nginx 能不能正常响应 HTTP 请求。我们继续在终端二中,执行如下的 curl 命令,检查 Nginx 对 HTTP 请求的响应:

$ curl --max-time 3 http://192.168.0.30
curl: (28) Operation timed out after 3000 milliseconds with 0 bytes received
奇怪,hping3 的结果显示Nginx 的 80 端口是正常状态,为什么还是不能正常响应 HTTP 请求呢?别忘了,我们还有个大杀器——抓包操作。看来有必要抓包看看了。

五、 tcpdump

执行下面的 tcpdump 命令,抓取 80 端口的包

tcpdump -i eth0 -nn port 80
#输出
tcpdump: verbose output suppressed, use -v or -vv for full protocol decode
listening on eth0, link-type EN10MB (Ethernet), capture size 262144 bytes

然后,切换到终端二中,再次执行前面的 curl 命令:

curl --max-time 3 http://192.168.0.30
curl: (28) Operation timed out after 3000 milliseconds with 0 bytes received

等到 curl 命令结束后,再次切换回终端一,查看 tcpdump 的输出:

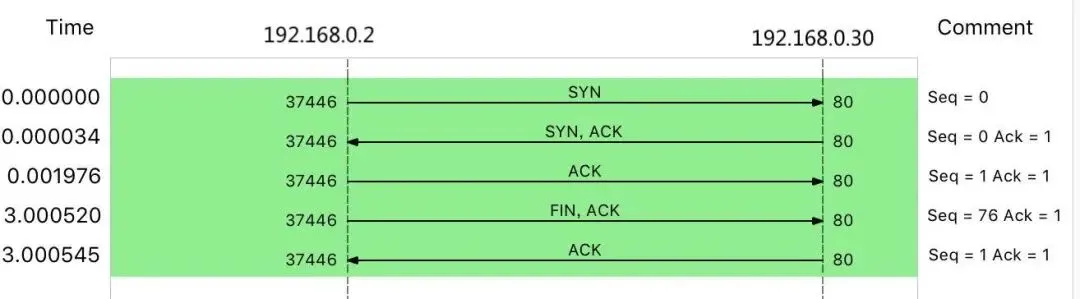
14:40:00.589235 IP 10.255.255.5.39058 > 172.17.0.2.80: Flags [S], seq 332257715, win 29200, options [mss 1418,sackOK,TS val 486800541 ecr 0,nop,wscale 7], length 0
14:40:00.589277 IP 172.17.0.2.80 > 10.255.255.5.39058: Flags [S.], seq 1630206251, ack 332257716, win 4880, options [mss 256,sackOK,TS val 2509376001 ecr 486800541,nop,wscale 7], length 0
14:40:00.589894 IP 10.255.255.5.39058 > 172.17.0.2.80: Flags [.], ack 1, win 229, options [nop,nop,TS val 486800541 ecr 2509376001], length 0
14:40:03.589352 IP 10.255.255.5.39058 > 172.17.0.2.80: Flags [F.], seq 76, ack 1, win 229, options [nop,nop,TS val 486803541 ecr 2509376001], length 0
14:40:03.589417 IP 172.17.0.2.80 > 10.255.255.5.39058: Flags [.], ack 1, win 40, options [nop,nop,TS val 2509379001 ecr 486800541,nop,nop,sack 1 {76:77}], length 0

从 tcpdump 的输出中,我们就可以看到:

  • 前三个包是正常的 TCP 三次握手,这没问题;
  • 但第四个包却是在 3 秒以后了,并且还是客户端(VM2)发送过来的 FIN 包,说明客户端的连接关闭了

根据 curl 设置的 3 秒超时选项,你应该能猜到,这是因为 curl 命令超时后退出了。用 Wireshark 的 Flow Graph 来表示,

你可以更清楚地看到上面这个问题:

这里比较奇怪的是,我们并没有抓取到 curl 发来的 HTTP GET 请求。那究竟是网卡丢包了,还是客户端就没发过来呢?

可以重新执行 netstat -i 命令,确认一下网卡有没有丢包问题:

netstat -i

Kernel Interface table
Iface      MTU    RX-OK RX-ERR RX-DRP RX-OVR    TX-OK TX-ERR TX-DRP TX-OVR Flg
eth0       100      157      0    344 0            94      0      0      0 BMRU
lo       65536        0      0      0 0             0      0      0      0 LRU

从 netstat 的输出中,你可以看到,接收丢包数(RX-DRP)是 344,果然是在网卡接收时丢包了。不过问题也来了,为什么刚才用 hping3 时不丢包,现在换成 GET 就收不到了呢?还是那句话,遇到搞不懂的现象,不妨先去查查工具和方法的原理。我们可以对比一下这两个工具:

  • hping3 实际上只发送了 SYN 包;
  • curl 在发送 SYN 包后,还会发送 HTTP GET 请求。HTTP GET本质上也是一个 TCP 包,但跟 SYN 包相比,它还携带了 HTTP GET 的数据。

通过这个对比,你应该想到了,这可能是 MTU 配置错误导致的。为什么呢?

其实,仔细观察上面 netstat 的输出界面,第二列正是每个网卡的 MTU 值。eth0 的 MTU只有 100,而以太网的 MTU 默认值是 1500,这个 100 就显得太小了。当然,MTU 问题是很好解决的,把它改成 1500 就可以了。

ifconfig eth0 mtu 1500

修改完成后,再切换到终端二中,再次执行 curl 命令,确认问题是否真的解决了:

curl --max-time 3 http://192.168.0.30/
#输出
<!DOCTYPE html>
<html>
...
<p><em>Thank you for using nginx.</em></p>
</body>
</html>

非常不容易呀,这次终于看到了熟悉的 Nginx 响应,说明丢包的问题终于彻底解决了。

来源:twt企业IT社区

-End-
读到这里说明你喜欢本公众号的文章,欢迎 置顶(标星)本公众号 Linux技术迷,这样就可以第一时间获取推送了~

最新文章

随机文章

基本 文件 流程 错误 SQL 调试
  1. 请求信息 : 2026-07-02 23:26:23 HTTP/2.0 GET : https://f.mffb.com.cn/a/499265.html
  2. 运行时间 : 0.316623s [ 吞吐率:3.16req/s ] 内存消耗:4,663.66kb 文件加载:140
  3. 缓存信息 : 0 reads,0 writes
  4. 会话信息 : SESSION_ID=5d5f0eb4134a521bf553acac5e5523ca
  1. /yingpanguazai/ssd/ssd1/www/f.mffb.com.cn/public/index.php ( 0.79 KB )
  2. /yingpanguazai/ssd/ssd1/www/f.mffb.com.cn/vendor/autoload.php ( 0.17 KB )
  3. /yingpanguazai/ssd/ssd1/www/f.mffb.com.cn/vendor/composer/autoload_real.php ( 2.49 KB )
  4. /yingpanguazai/ssd/ssd1/www/f.mffb.com.cn/vendor/composer/platform_check.php ( 0.90 KB )
  5. /yingpanguazai/ssd/ssd1/www/f.mffb.com.cn/vendor/composer/ClassLoader.php ( 14.03 KB )
  6. /yingpanguazai/ssd/ssd1/www/f.mffb.com.cn/vendor/composer/autoload_static.php ( 4.90 KB )
  7. /yingpanguazai/ssd/ssd1/www/f.mffb.com.cn/vendor/topthink/think-helper/src/helper.php ( 8.34 KB )
  8. /yingpanguazai/ssd/ssd1/www/f.mffb.com.cn/vendor/topthink/think-validate/src/helper.php ( 2.19 KB )
  9. /yingpanguazai/ssd/ssd1/www/f.mffb.com.cn/vendor/topthink/think-orm/src/helper.php ( 1.47 KB )
  10. /yingpanguazai/ssd/ssd1/www/f.mffb.com.cn/vendor/topthink/think-orm/stubs/load_stubs.php ( 0.16 KB )
  11. /yingpanguazai/ssd/ssd1/www/f.mffb.com.cn/vendor/topthink/framework/src/think/Exception.php ( 1.69 KB )
  12. /yingpanguazai/ssd/ssd1/www/f.mffb.com.cn/vendor/topthink/think-container/src/Facade.php ( 2.71 KB )
  13. /yingpanguazai/ssd/ssd1/www/f.mffb.com.cn/vendor/symfony/deprecation-contracts/function.php ( 0.99 KB )
  14. /yingpanguazai/ssd/ssd1/www/f.mffb.com.cn/vendor/symfony/polyfill-mbstring/bootstrap.php ( 8.26 KB )
  15. /yingpanguazai/ssd/ssd1/www/f.mffb.com.cn/vendor/symfony/polyfill-mbstring/bootstrap80.php ( 9.78 KB )
  16. /yingpanguazai/ssd/ssd1/www/f.mffb.com.cn/vendor/symfony/var-dumper/Resources/functions/dump.php ( 1.49 KB )
  17. /yingpanguazai/ssd/ssd1/www/f.mffb.com.cn/vendor/topthink/think-dumper/src/helper.php ( 0.18 KB )
  18. /yingpanguazai/ssd/ssd1/www/f.mffb.com.cn/vendor/symfony/var-dumper/VarDumper.php ( 4.30 KB )
  19. /yingpanguazai/ssd/ssd1/www/f.mffb.com.cn/vendor/topthink/framework/src/think/App.php ( 15.30 KB )
  20. /yingpanguazai/ssd/ssd1/www/f.mffb.com.cn/vendor/topthink/think-container/src/Container.php ( 15.76 KB )
  21. /yingpanguazai/ssd/ssd1/www/f.mffb.com.cn/vendor/psr/container/src/ContainerInterface.php ( 1.02 KB )
  22. /yingpanguazai/ssd/ssd1/www/f.mffb.com.cn/app/provider.php ( 0.19 KB )
  23. /yingpanguazai/ssd/ssd1/www/f.mffb.com.cn/vendor/topthink/framework/src/think/Http.php ( 6.04 KB )
  24. /yingpanguazai/ssd/ssd1/www/f.mffb.com.cn/vendor/topthink/think-helper/src/helper/Str.php ( 7.29 KB )
  25. /yingpanguazai/ssd/ssd1/www/f.mffb.com.cn/vendor/topthink/framework/src/think/Env.php ( 4.68 KB )
  26. /yingpanguazai/ssd/ssd1/www/f.mffb.com.cn/app/common.php ( 0.03 KB )
  27. /yingpanguazai/ssd/ssd1/www/f.mffb.com.cn/vendor/topthink/framework/src/helper.php ( 18.78 KB )
  28. /yingpanguazai/ssd/ssd1/www/f.mffb.com.cn/vendor/topthink/framework/src/think/Config.php ( 5.54 KB )
  29. /yingpanguazai/ssd/ssd1/www/f.mffb.com.cn/config/app.php ( 0.95 KB )
  30. /yingpanguazai/ssd/ssd1/www/f.mffb.com.cn/config/cache.php ( 0.78 KB )
  31. /yingpanguazai/ssd/ssd1/www/f.mffb.com.cn/config/console.php ( 0.23 KB )
  32. /yingpanguazai/ssd/ssd1/www/f.mffb.com.cn/config/cookie.php ( 0.56 KB )
  33. /yingpanguazai/ssd/ssd1/www/f.mffb.com.cn/config/database.php ( 2.48 KB )
  34. /yingpanguazai/ssd/ssd1/www/f.mffb.com.cn/vendor/topthink/framework/src/think/facade/Env.php ( 1.67 KB )
  35. /yingpanguazai/ssd/ssd1/www/f.mffb.com.cn/config/filesystem.php ( 0.61 KB )
  36. /yingpanguazai/ssd/ssd1/www/f.mffb.com.cn/config/lang.php ( 0.91 KB )
  37. /yingpanguazai/ssd/ssd1/www/f.mffb.com.cn/config/log.php ( 1.35 KB )
  38. /yingpanguazai/ssd/ssd1/www/f.mffb.com.cn/config/middleware.php ( 0.19 KB )
  39. /yingpanguazai/ssd/ssd1/www/f.mffb.com.cn/config/route.php ( 1.89 KB )
  40. /yingpanguazai/ssd/ssd1/www/f.mffb.com.cn/config/session.php ( 0.57 KB )
  41. /yingpanguazai/ssd/ssd1/www/f.mffb.com.cn/config/trace.php ( 0.34 KB )
  42. /yingpanguazai/ssd/ssd1/www/f.mffb.com.cn/config/view.php ( 0.82 KB )
  43. /yingpanguazai/ssd/ssd1/www/f.mffb.com.cn/app/event.php ( 0.25 KB )
  44. /yingpanguazai/ssd/ssd1/www/f.mffb.com.cn/vendor/topthink/framework/src/think/Event.php ( 7.67 KB )
  45. /yingpanguazai/ssd/ssd1/www/f.mffb.com.cn/app/service.php ( 0.13 KB )
  46. /yingpanguazai/ssd/ssd1/www/f.mffb.com.cn/app/AppService.php ( 0.26 KB )
  47. /yingpanguazai/ssd/ssd1/www/f.mffb.com.cn/vendor/topthink/framework/src/think/Service.php ( 1.64 KB )
  48. /yingpanguazai/ssd/ssd1/www/f.mffb.com.cn/vendor/topthink/framework/src/think/Lang.php ( 7.35 KB )
  49. /yingpanguazai/ssd/ssd1/www/f.mffb.com.cn/vendor/topthink/framework/src/lang/zh-cn.php ( 13.70 KB )
  50. /yingpanguazai/ssd/ssd1/www/f.mffb.com.cn/vendor/topthink/framework/src/think/initializer/Error.php ( 3.31 KB )
  51. /yingpanguazai/ssd/ssd1/www/f.mffb.com.cn/vendor/topthink/framework/src/think/initializer/RegisterService.php ( 1.33 KB )
  52. /yingpanguazai/ssd/ssd1/www/f.mffb.com.cn/vendor/services.php ( 0.14 KB )
  53. /yingpanguazai/ssd/ssd1/www/f.mffb.com.cn/vendor/topthink/framework/src/think/service/PaginatorService.php ( 1.52 KB )
  54. /yingpanguazai/ssd/ssd1/www/f.mffb.com.cn/vendor/topthink/framework/src/think/service/ValidateService.php ( 0.99 KB )
  55. /yingpanguazai/ssd/ssd1/www/f.mffb.com.cn/vendor/topthink/framework/src/think/service/ModelService.php ( 2.04 KB )
  56. /yingpanguazai/ssd/ssd1/www/f.mffb.com.cn/vendor/topthink/think-trace/src/Service.php ( 0.77 KB )
  57. /yingpanguazai/ssd/ssd1/www/f.mffb.com.cn/vendor/topthink/framework/src/think/Middleware.php ( 6.72 KB )
  58. /yingpanguazai/ssd/ssd1/www/f.mffb.com.cn/vendor/topthink/framework/src/think/initializer/BootService.php ( 0.77 KB )
  59. /yingpanguazai/ssd/ssd1/www/f.mffb.com.cn/vendor/topthink/think-orm/src/Paginator.php ( 11.86 KB )
  60. /yingpanguazai/ssd/ssd1/www/f.mffb.com.cn/vendor/topthink/think-validate/src/Validate.php ( 63.20 KB )
  61. /yingpanguazai/ssd/ssd1/www/f.mffb.com.cn/vendor/topthink/think-orm/src/Model.php ( 23.55 KB )
  62. /yingpanguazai/ssd/ssd1/www/f.mffb.com.cn/vendor/topthink/think-orm/src/model/concern/Attribute.php ( 21.05 KB )
  63. /yingpanguazai/ssd/ssd1/www/f.mffb.com.cn/vendor/topthink/think-orm/src/model/concern/AutoWriteData.php ( 4.21 KB )
  64. /yingpanguazai/ssd/ssd1/www/f.mffb.com.cn/vendor/topthink/think-orm/src/model/concern/Conversion.php ( 6.44 KB )
  65. /yingpanguazai/ssd/ssd1/www/f.mffb.com.cn/vendor/topthink/think-orm/src/model/concern/DbConnect.php ( 5.16 KB )
  66. /yingpanguazai/ssd/ssd1/www/f.mffb.com.cn/vendor/topthink/think-orm/src/model/concern/ModelEvent.php ( 2.33 KB )
  67. /yingpanguazai/ssd/ssd1/www/f.mffb.com.cn/vendor/topthink/think-orm/src/model/concern/RelationShip.php ( 28.29 KB )
  68. /yingpanguazai/ssd/ssd1/www/f.mffb.com.cn/vendor/topthink/think-helper/src/contract/Arrayable.php ( 0.09 KB )
  69. /yingpanguazai/ssd/ssd1/www/f.mffb.com.cn/vendor/topthink/think-helper/src/contract/Jsonable.php ( 0.13 KB )
  70. /yingpanguazai/ssd/ssd1/www/f.mffb.com.cn/vendor/topthink/think-orm/src/model/contract/Modelable.php ( 0.09 KB )
  71. /yingpanguazai/ssd/ssd1/www/f.mffb.com.cn/vendor/topthink/framework/src/think/Db.php ( 2.88 KB )
  72. /yingpanguazai/ssd/ssd1/www/f.mffb.com.cn/vendor/topthink/think-orm/src/DbManager.php ( 8.52 KB )
  73. /yingpanguazai/ssd/ssd1/www/f.mffb.com.cn/vendor/topthink/framework/src/think/Log.php ( 6.28 KB )
  74. /yingpanguazai/ssd/ssd1/www/f.mffb.com.cn/vendor/topthink/framework/src/think/Manager.php ( 3.92 KB )
  75. /yingpanguazai/ssd/ssd1/www/f.mffb.com.cn/vendor/psr/log/src/LoggerTrait.php ( 2.69 KB )
  76. /yingpanguazai/ssd/ssd1/www/f.mffb.com.cn/vendor/psr/log/src/LoggerInterface.php ( 2.71 KB )
  77. /yingpanguazai/ssd/ssd1/www/f.mffb.com.cn/vendor/topthink/framework/src/think/Cache.php ( 4.92 KB )
  78. /yingpanguazai/ssd/ssd1/www/f.mffb.com.cn/vendor/psr/simple-cache/src/CacheInterface.php ( 4.71 KB )
  79. /yingpanguazai/ssd/ssd1/www/f.mffb.com.cn/vendor/topthink/think-helper/src/helper/Arr.php ( 16.63 KB )
  80. /yingpanguazai/ssd/ssd1/www/f.mffb.com.cn/vendor/topthink/framework/src/think/cache/driver/File.php ( 7.84 KB )
  81. /yingpanguazai/ssd/ssd1/www/f.mffb.com.cn/vendor/topthink/framework/src/think/cache/Driver.php ( 9.03 KB )
  82. /yingpanguazai/ssd/ssd1/www/f.mffb.com.cn/vendor/topthink/framework/src/think/contract/CacheHandlerInterface.php ( 1.99 KB )
  83. /yingpanguazai/ssd/ssd1/www/f.mffb.com.cn/app/Request.php ( 0.09 KB )
  84. /yingpanguazai/ssd/ssd1/www/f.mffb.com.cn/vendor/topthink/framework/src/think/Request.php ( 55.78 KB )
  85. /yingpanguazai/ssd/ssd1/www/f.mffb.com.cn/app/middleware.php ( 0.25 KB )
  86. /yingpanguazai/ssd/ssd1/www/f.mffb.com.cn/vendor/topthink/framework/src/think/Pipeline.php ( 2.61 KB )
  87. /yingpanguazai/ssd/ssd1/www/f.mffb.com.cn/vendor/topthink/think-trace/src/TraceDebug.php ( 3.40 KB )
  88. /yingpanguazai/ssd/ssd1/www/f.mffb.com.cn/vendor/topthink/framework/src/think/middleware/SessionInit.php ( 1.94 KB )
  89. /yingpanguazai/ssd/ssd1/www/f.mffb.com.cn/vendor/topthink/framework/src/think/Session.php ( 1.80 KB )
  90. /yingpanguazai/ssd/ssd1/www/f.mffb.com.cn/vendor/topthink/framework/src/think/session/driver/File.php ( 6.27 KB )
  91. /yingpanguazai/ssd/ssd1/www/f.mffb.com.cn/vendor/topthink/framework/src/think/contract/SessionHandlerInterface.php ( 0.87 KB )
  92. /yingpanguazai/ssd/ssd1/www/f.mffb.com.cn/vendor/topthink/framework/src/think/session/Store.php ( 7.12 KB )
  93. /yingpanguazai/ssd/ssd1/www/f.mffb.com.cn/vendor/topthink/framework/src/think/Route.php ( 23.73 KB )
  94. /yingpanguazai/ssd/ssd1/www/f.mffb.com.cn/vendor/topthink/framework/src/think/route/RuleName.php ( 5.75 KB )
  95. /yingpanguazai/ssd/ssd1/www/f.mffb.com.cn/vendor/topthink/framework/src/think/route/Domain.php ( 2.53 KB )
  96. /yingpanguazai/ssd/ssd1/www/f.mffb.com.cn/vendor/topthink/framework/src/think/route/RuleGroup.php ( 22.43 KB )
  97. /yingpanguazai/ssd/ssd1/www/f.mffb.com.cn/vendor/topthink/framework/src/think/route/Rule.php ( 26.95 KB )
  98. /yingpanguazai/ssd/ssd1/www/f.mffb.com.cn/vendor/topthink/framework/src/think/route/RuleItem.php ( 9.78 KB )
  99. /yingpanguazai/ssd/ssd1/www/f.mffb.com.cn/route/app.php ( 1.72 KB )
  100. /yingpanguazai/ssd/ssd1/www/f.mffb.com.cn/vendor/topthink/framework/src/think/facade/Route.php ( 4.70 KB )
  101. /yingpanguazai/ssd/ssd1/www/f.mffb.com.cn/vendor/topthink/framework/src/think/route/dispatch/Controller.php ( 4.74 KB )
  102. /yingpanguazai/ssd/ssd1/www/f.mffb.com.cn/vendor/topthink/framework/src/think/route/Dispatch.php ( 10.44 KB )
  103. /yingpanguazai/ssd/ssd1/www/f.mffb.com.cn/app/controller/Index.php ( 4.81 KB )
  104. /yingpanguazai/ssd/ssd1/www/f.mffb.com.cn/app/BaseController.php ( 2.05 KB )
  105. /yingpanguazai/ssd/ssd1/www/f.mffb.com.cn/vendor/topthink/think-orm/src/facade/Db.php ( 0.93 KB )
  106. /yingpanguazai/ssd/ssd1/www/f.mffb.com.cn/vendor/topthink/think-orm/src/db/connector/Mysql.php ( 5.44 KB )
  107. /yingpanguazai/ssd/ssd1/www/f.mffb.com.cn/vendor/topthink/think-orm/src/db/PDOConnection.php ( 52.47 KB )
  108. /yingpanguazai/ssd/ssd1/www/f.mffb.com.cn/vendor/topthink/think-orm/src/db/Connection.php ( 8.39 KB )
  109. /yingpanguazai/ssd/ssd1/www/f.mffb.com.cn/vendor/topthink/think-orm/src/db/ConnectionInterface.php ( 4.57 KB )
  110. /yingpanguazai/ssd/ssd1/www/f.mffb.com.cn/vendor/topthink/think-orm/src/db/builder/Mysql.php ( 16.58 KB )
  111. /yingpanguazai/ssd/ssd1/www/f.mffb.com.cn/vendor/topthink/think-orm/src/db/Builder.php ( 24.06 KB )
  112. /yingpanguazai/ssd/ssd1/www/f.mffb.com.cn/vendor/topthink/think-orm/src/db/BaseBuilder.php ( 27.50 KB )
  113. /yingpanguazai/ssd/ssd1/www/f.mffb.com.cn/vendor/topthink/think-orm/src/db/Query.php ( 15.71 KB )
  114. /yingpanguazai/ssd/ssd1/www/f.mffb.com.cn/vendor/topthink/think-orm/src/db/BaseQuery.php ( 45.13 KB )
  115. /yingpanguazai/ssd/ssd1/www/f.mffb.com.cn/vendor/topthink/think-orm/src/db/concern/TimeFieldQuery.php ( 7.43 KB )
  116. /yingpanguazai/ssd/ssd1/www/f.mffb.com.cn/vendor/topthink/think-orm/src/db/concern/AggregateQuery.php ( 3.26 KB )
  117. /yingpanguazai/ssd/ssd1/www/f.mffb.com.cn/vendor/topthink/think-orm/src/db/concern/ModelRelationQuery.php ( 20.07 KB )
  118. /yingpanguazai/ssd/ssd1/www/f.mffb.com.cn/vendor/topthink/think-orm/src/db/concern/ParamsBind.php ( 3.66 KB )
  119. /yingpanguazai/ssd/ssd1/www/f.mffb.com.cn/vendor/topthink/think-orm/src/db/concern/ResultOperation.php ( 7.01 KB )
  120. /yingpanguazai/ssd/ssd1/www/f.mffb.com.cn/vendor/topthink/think-orm/src/db/concern/WhereQuery.php ( 19.37 KB )
  121. /yingpanguazai/ssd/ssd1/www/f.mffb.com.cn/vendor/topthink/think-orm/src/db/concern/JoinAndViewQuery.php ( 7.11 KB )
  122. /yingpanguazai/ssd/ssd1/www/f.mffb.com.cn/vendor/topthink/think-orm/src/db/concern/TableFieldInfo.php ( 2.63 KB )
  123. /yingpanguazai/ssd/ssd1/www/f.mffb.com.cn/vendor/topthink/think-orm/src/db/concern/Transaction.php ( 2.77 KB )
  124. /yingpanguazai/ssd/ssd1/www/f.mffb.com.cn/vendor/topthink/framework/src/think/log/driver/File.php ( 5.96 KB )
  125. /yingpanguazai/ssd/ssd1/www/f.mffb.com.cn/vendor/topthink/framework/src/think/contract/LogHandlerInterface.php ( 0.86 KB )
  126. /yingpanguazai/ssd/ssd1/www/f.mffb.com.cn/vendor/topthink/framework/src/think/log/Channel.php ( 3.89 KB )
  127. /yingpanguazai/ssd/ssd1/www/f.mffb.com.cn/vendor/topthink/framework/src/think/event/LogRecord.php ( 1.02 KB )
  128. /yingpanguazai/ssd/ssd1/www/f.mffb.com.cn/vendor/topthink/think-helper/src/Collection.php ( 16.47 KB )
  129. /yingpanguazai/ssd/ssd1/www/f.mffb.com.cn/vendor/topthink/framework/src/think/facade/View.php ( 1.70 KB )
  130. /yingpanguazai/ssd/ssd1/www/f.mffb.com.cn/vendor/topthink/framework/src/think/View.php ( 4.39 KB )
  131. /yingpanguazai/ssd/ssd1/www/f.mffb.com.cn/vendor/topthink/framework/src/think/Response.php ( 8.81 KB )
  132. /yingpanguazai/ssd/ssd1/www/f.mffb.com.cn/vendor/topthink/framework/src/think/response/View.php ( 3.29 KB )
  133. /yingpanguazai/ssd/ssd1/www/f.mffb.com.cn/vendor/topthink/framework/src/think/Cookie.php ( 6.06 KB )
  134. /yingpanguazai/ssd/ssd1/www/f.mffb.com.cn/vendor/topthink/think-view/src/Think.php ( 8.38 KB )
  135. /yingpanguazai/ssd/ssd1/www/f.mffb.com.cn/vendor/topthink/framework/src/think/contract/TemplateHandlerInterface.php ( 1.60 KB )
  136. /yingpanguazai/ssd/ssd1/www/f.mffb.com.cn/vendor/topthink/think-template/src/Template.php ( 46.61 KB )
  137. /yingpanguazai/ssd/ssd1/www/f.mffb.com.cn/vendor/topthink/think-template/src/template/driver/File.php ( 2.41 KB )
  138. /yingpanguazai/ssd/ssd1/www/f.mffb.com.cn/vendor/topthink/think-template/src/template/contract/DriverInterface.php ( 0.86 KB )
  139. /yingpanguazai/ssd/ssd1/www/f.mffb.com.cn/runtime/temp/067d451b9a0c665040f3f1bdd3293d68.php ( 11.98 KB )
  140. /yingpanguazai/ssd/ssd1/www/f.mffb.com.cn/vendor/topthink/think-trace/src/Html.php ( 4.42 KB )
  1. CONNECT:[ UseTime:0.000566s ] mysql:host=127.0.0.1;port=3306;dbname=f_mffb;charset=utf8mb4
  2. SHOW FULL COLUMNS FROM `fenlei` [ RunTime:0.000916s ]
  3. SELECT * FROM `fenlei` WHERE `fid` = 0 [ RunTime:0.019750s ]
  4. SELECT * FROM `fenlei` WHERE `fid` = 63 [ RunTime:0.001018s ]
  5. SHOW FULL COLUMNS FROM `set` [ RunTime:0.000584s ]
  6. SELECT * FROM `set` [ RunTime:0.010071s ]
  7. SHOW FULL COLUMNS FROM `article` [ RunTime:0.000676s ]
  8. SELECT * FROM `article` WHERE `id` = 499265 LIMIT 1 [ RunTime:0.004761s ]
  9. UPDATE `article` SET `lasttime` = 1783005983 WHERE `id` = 499265 [ RunTime:0.031838s ]
  10. SELECT * FROM `fenlei` WHERE `id` = 67 LIMIT 1 [ RunTime:0.000794s ]
  11. SELECT * FROM `article` WHERE `id` < 499265 ORDER BY `id` DESC LIMIT 1 [ RunTime:0.001711s ]
  12. SELECT * FROM `article` WHERE `id` > 499265 ORDER BY `id` ASC LIMIT 1 [ RunTime:0.013058s ]
  13. SELECT * FROM `article` WHERE `id` < 499265 ORDER BY `id` DESC LIMIT 10 [ RunTime:0.079992s ]
  14. SELECT * FROM `article` WHERE `id` < 499265 ORDER BY `id` DESC LIMIT 10,10 [ RunTime:0.062318s ]
  15. SELECT * FROM `article` WHERE `id` < 499265 ORDER BY `id` DESC LIMIT 20,10 [ RunTime:0.015868s ]
0.318289s