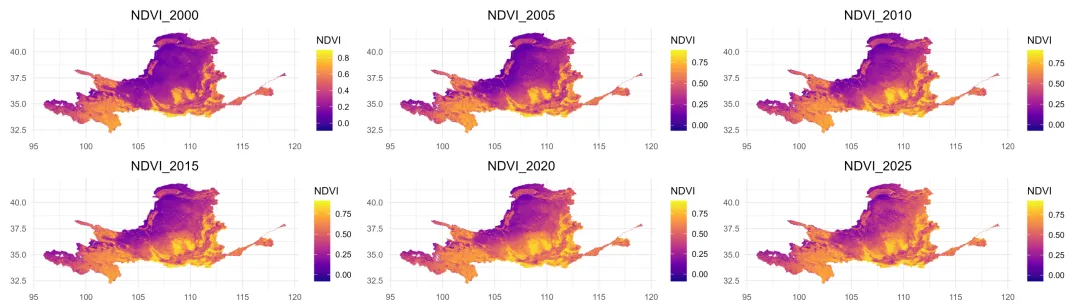
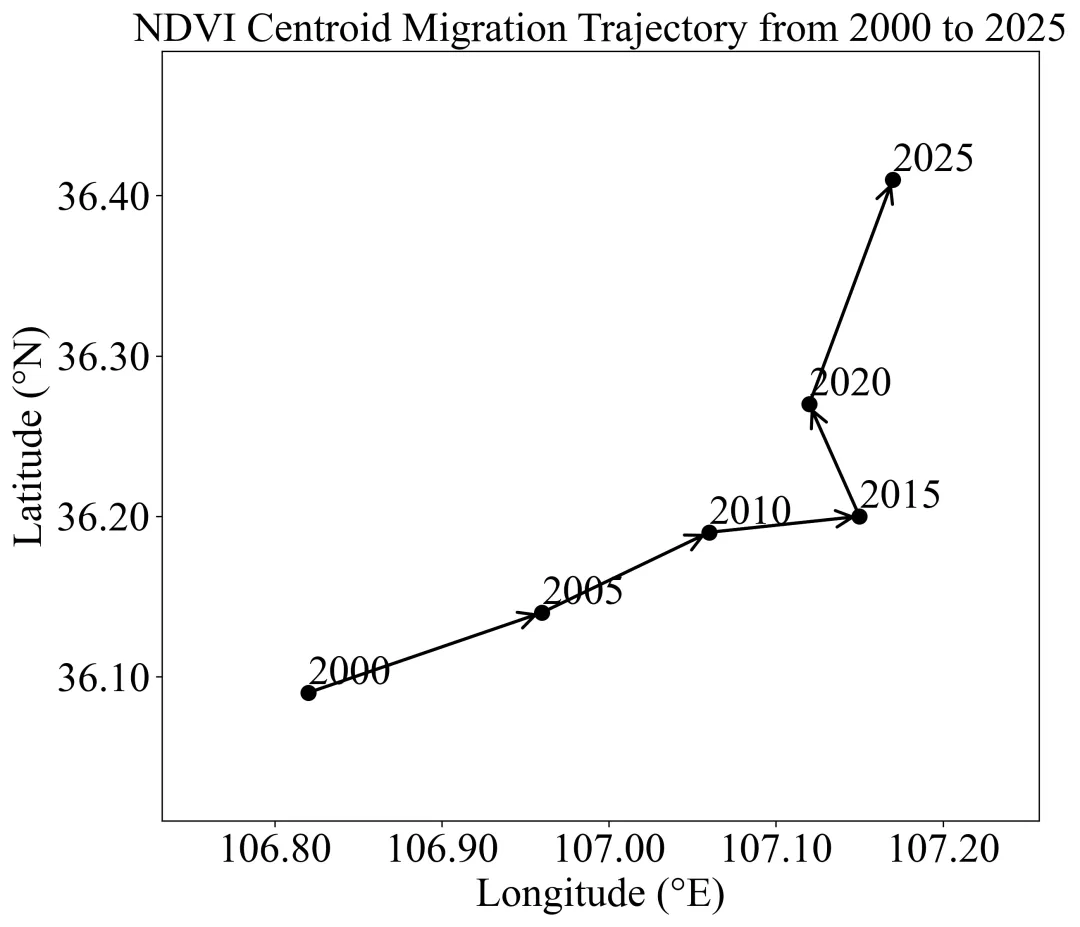
import osimport numpy as npimport pandas as pdimport rasterioimport matplotlib.pyplot as pltimport geopandas as gpdfrom shapely.geometry import Point, LineStringfrom pyproj import Transformer, Geod, CRSfrom matplotlib.ticker import FormatStrFormatterfolder = r"C:\Users\Yu\Pictures\NDVI"tif_items = [ {"year": 2000, "file": "NDVI_2000.tif"}, {"year": 2005, "file": "NDVI_2005.tif"}, {"year": 2010, "file": "NDVI_2010.tif"}, {"year": 2015, "file": "NDVI_2015.tif"}, {"year": 2020, "file": "NDVI_2020.tif"}, {"year": 2025, "file": "NDVI_2025.tif"},]out_dir = os.path.join(folder, "NDVI_centroid_result")os.makedirs(out_dir, exist_ok=True)out_csv = os.path.join(out_dir, "NDVI_centroid_lonlat.csv")out_point_shp = os.path.join(out_dir, "NDVI_centroid_points.shp")out_segment_shp = os.path.join(out_dir, "NDVI_centroid_segments.shp")out_trajectory_shp = os.path.join(out_dir, "NDVI_centroid_trajectory.shp")out_png = os.path.join(out_dir, "NDVI_centroid_trajectory.png")assume_crs_if_missing = Nonedef calc_ndvi_centroid(tif_path): with rasterio.open(tif_path) as src: transform = src.transform nodata = src.nodata src_crs = src.crs if src_crs is None: if assume_crs_if_missing is None: raise ValueError(f"{tif_path} has no CRS. Please define its CRS first.") src_crs = CRS.from_user_input(assume_crs_if_missing) sum_w = 0.0 sum_x = 0.0 sum_y = 0.0 for _, window in src.block_windows(1): arr = src.read(1, window=window).astype("float64") mask = np.isfinite(arr) if nodata is not None: mask &= arr != nodata mask &= (arr >= -1) & (arr <= 1) mask &= arr > 0 if not np.any(mask): continue weights = arr rows, cols = np.indices(arr.shape) rows = rows + window.row_off cols = cols + window.col_off rows_valid = rows[mask] cols_valid = cols[mask] w_valid = weights[mask] xs, ys = transform * (cols_valid + 0.5, rows_valid + 0.5) sum_w += np.sum(w_valid) sum_x += np.sum(xs * w_valid) sum_y += np.sum(ys * w_valid) if sum_w == 0: return np.nan, np.nan, src_crs centroid_x = sum_x / sum_w centroid_y = sum_y / sum_w return centroid_x, centroid_y, src_crsrecords = []for item in tif_items: year = item["year"] tif_path = os.path.join(folder, item["file"]) if not os.path.exists(tif_path): print(f"Missing file: {tif_path}") continue x_src, y_src, src_crs = calc_ndvi_centroid(tif_path) transformer = Transformer.from_crs(src_crs, "EPSG:4326", always_xy=True) lon, lat = transformer.transform(x_src, y_src) records.append({ "year": year, "lon": lon, "lat": lat, "x_src": x_src, "y_src": y_src })df = pd.DataFrame(records)df = df.dropna()df = df.sort_values("year").reset_index(drop=True)df["lon"] = df["lon"].round(2)df["lat"] = df["lat"].round(2)df.to_csv(out_csv, index=False, encoding="utf-8-sig")point_gdf = gpd.GeoDataFrame( df.copy(), geometry=[Point(lon, lat) for lon, lat in zip(df["lon"], df["lat"])], crs="EPSG:4326")point_gdf.to_file(out_point_shp, driver="ESRI Shapefile", encoding="utf-8")geod = Geod(ellps="WGS84")segment_records = []for i in range(len(df) - 1): row1 = df.iloc[i] row2 = df.iloc[i + 1] lon1 = row1["lon"] lat1 = row1["lat"] lon2 = row2["lon"] lat2 = row2["lat"] azimuth, back_azimuth, distance_m = geod.inv(lon1, lat1, lon2, lat2) segment_records.append({ "from_yr": int(row1["year"]), "to_yr": int(row2["year"]), "lon_st": round(lon1, 2), "lat_st": round(lat1, 2), "lon_end": round(lon2, 2), "lat_end": round(lat2, 2), "dist_km": round(distance_m / 1000, 2), "azimuth": round(azimuth % 360, 2), "geometry": LineString([(lon1, lat1), (lon2, lat2)]) })segment_gdf = gpd.GeoDataFrame(segment_records, crs="EPSG:4326")segment_gdf.to_file(out_segment_shp, driver="ESRI Shapefile", encoding="utf-8")trajectory_gdf = gpd.GeoDataFrame( [{ "start_yr": int(df.iloc[0]["year"]), "end_yr": int(df.iloc[-1]["year"]), "geometry": LineString(list(zip(df["lon"], df["lat"]))) }], crs="EPSG:4326")trajectory_gdf.to_file(out_trajectory_shp, driver="ESRI Shapefile", encoding="utf-8")plt.rcParams["font.family"] = "Times New Roman"plt.rcParams["font.size"] = 24plt.rcParams["axes.titlesize"] = 24plt.rcParams["axes.labelsize"] = 24plt.rcParams["xtick.labelsize"] = 24plt.rcParams["ytick.labelsize"] = 24plt.rcParams["legend.fontsize"] = 24fig, ax = plt.subplots(figsize=(9, 8), dpi=300)for i in range(len(df) - 1): x1 = df.loc[i, "lon"] y1 = df.loc[i, "lat"] x2 = df.loc[i + 1, "lon"] y2 = df.loc[i + 1, "lat"] ax.plot( [x1, x2], [y1, y2], color="black", linewidth=1.8, zorder=2 ) ax.annotate( "", xy=(x2, y2), xytext=(x1, y1), arrowprops=dict( arrowstyle="->", color="black", lw=1.8 ), zorder=3 )ax.scatter( df["lon"], df["lat"], s=70, color="black", zorder=4)for _, row in df.iterrows(): ax.text( row["lon"], row["lat"], str(int(row["year"])), fontsize=24, ha="left", va="bottom", color="black", zorder=5 )ax.set_title("NDVI Centroid Migration Trajectory from 2000 to 2025")ax.set_xlabel("Longitude (°E)", fontsize=24)ax.set_ylabel("Latitude (°N)", fontsize=24)ax.xaxis.set_major_formatter(FormatStrFormatter("%.2f"))ax.yaxis.set_major_formatter(FormatStrFormatter("%.2f"))xmin, xmax = df["lon"].min(), df["lon"].max()ymin, ymax = df["lat"].min(), df["lat"].max()x_pad = (xmax - xmin) * 0.25 if xmax > xmin else 0.01y_pad = (ymax - ymin) * 0.25 if ymax > ymin else 0.01ax.set_xlim(xmin - x_pad, xmax + x_pad)ax.set_ylim(ymin - y_pad, ymax + y_pad)ax.grid(False)plt.tight_layout()plt.savefig(out_png, dpi=300, bbox_inches="tight")plt.show()print(df)print(f"CSV saved: {out_csv}")print(f"Point SHP saved: {out_point_shp}")print(f"Segment SHP saved: {out_segment_shp}")print(f"Trajectory SHP saved: {out_trajectory_shp}")print(f"Figure saved: {out_png}")

 10个月宝宝每天需要喝多少奶粉?
