期刊图片复现|Python绘制配对云雨图
- 2026-06-29 16:41:19
期刊图片复现|Python绘制配对云雨图

论文:Informative data visualization with raincloud plots in JASP 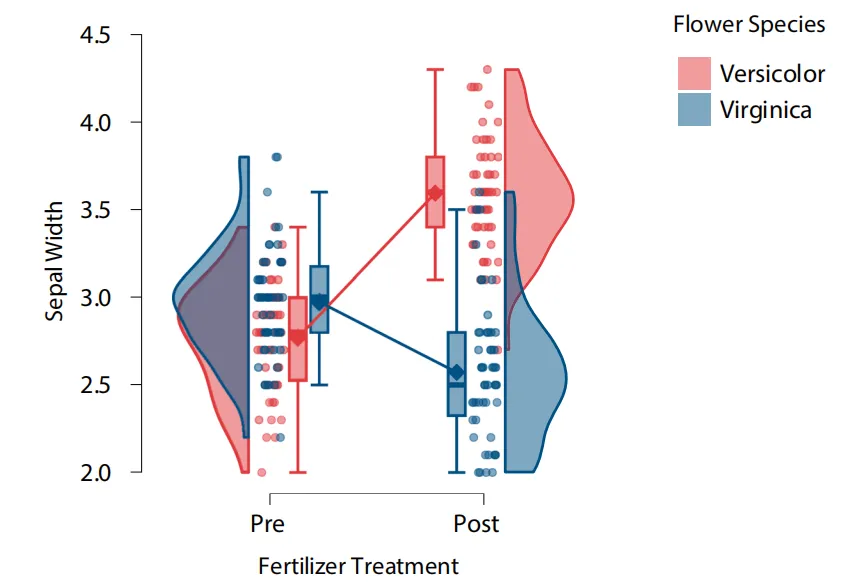
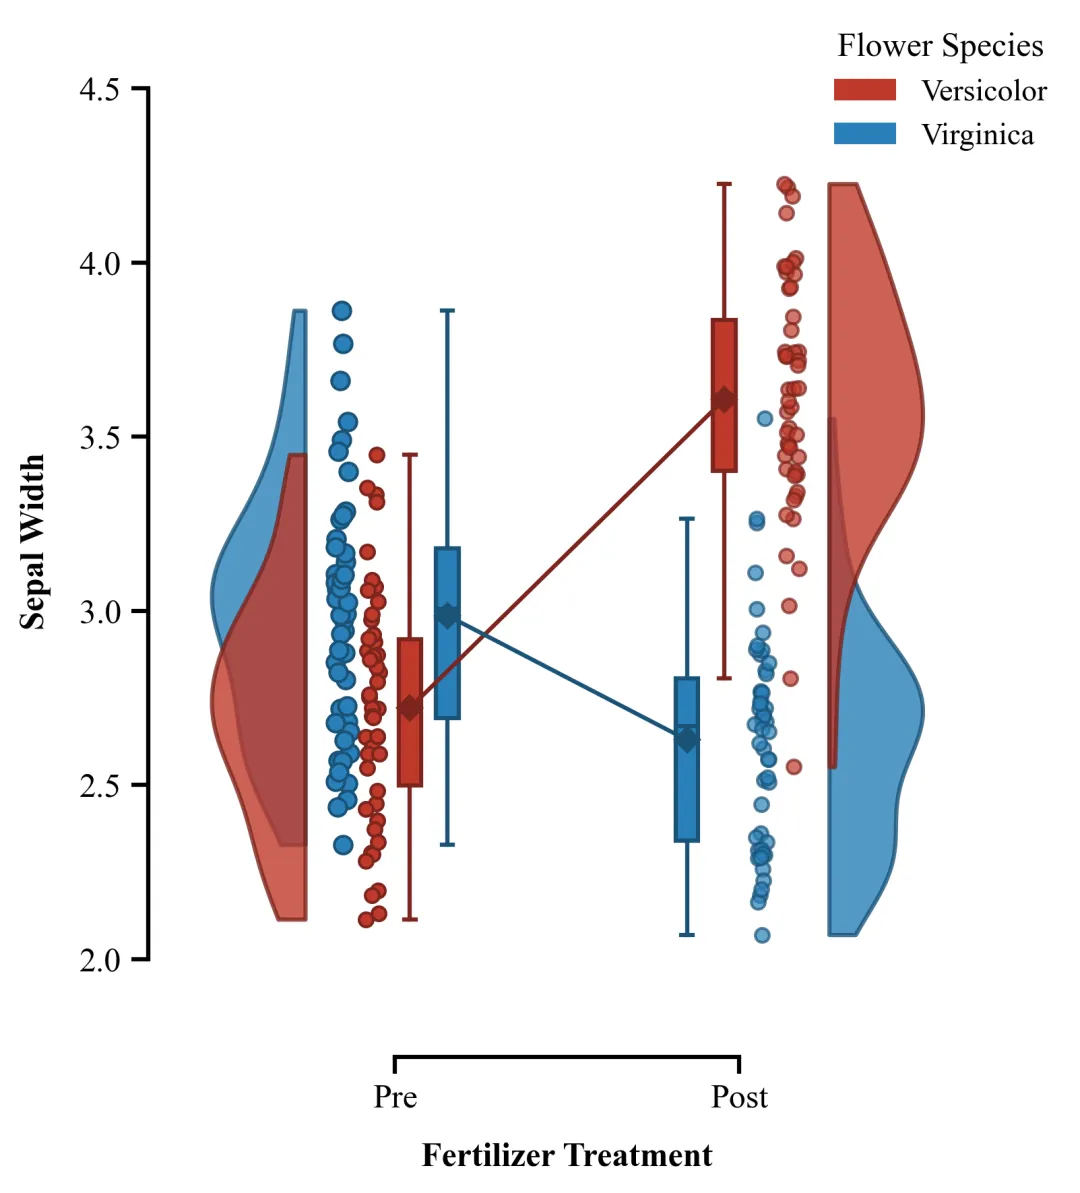
论文原图 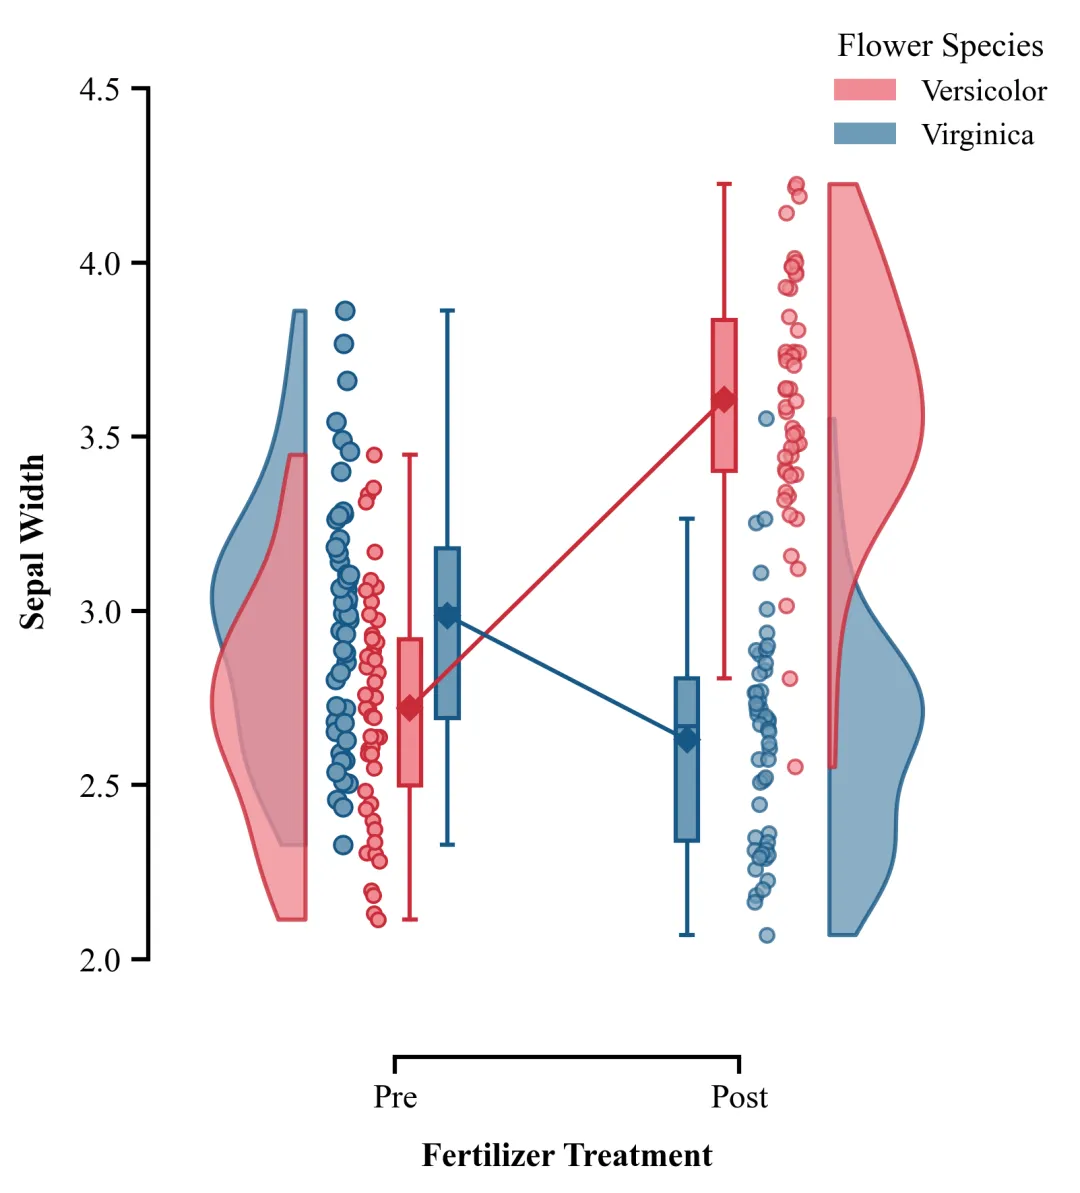
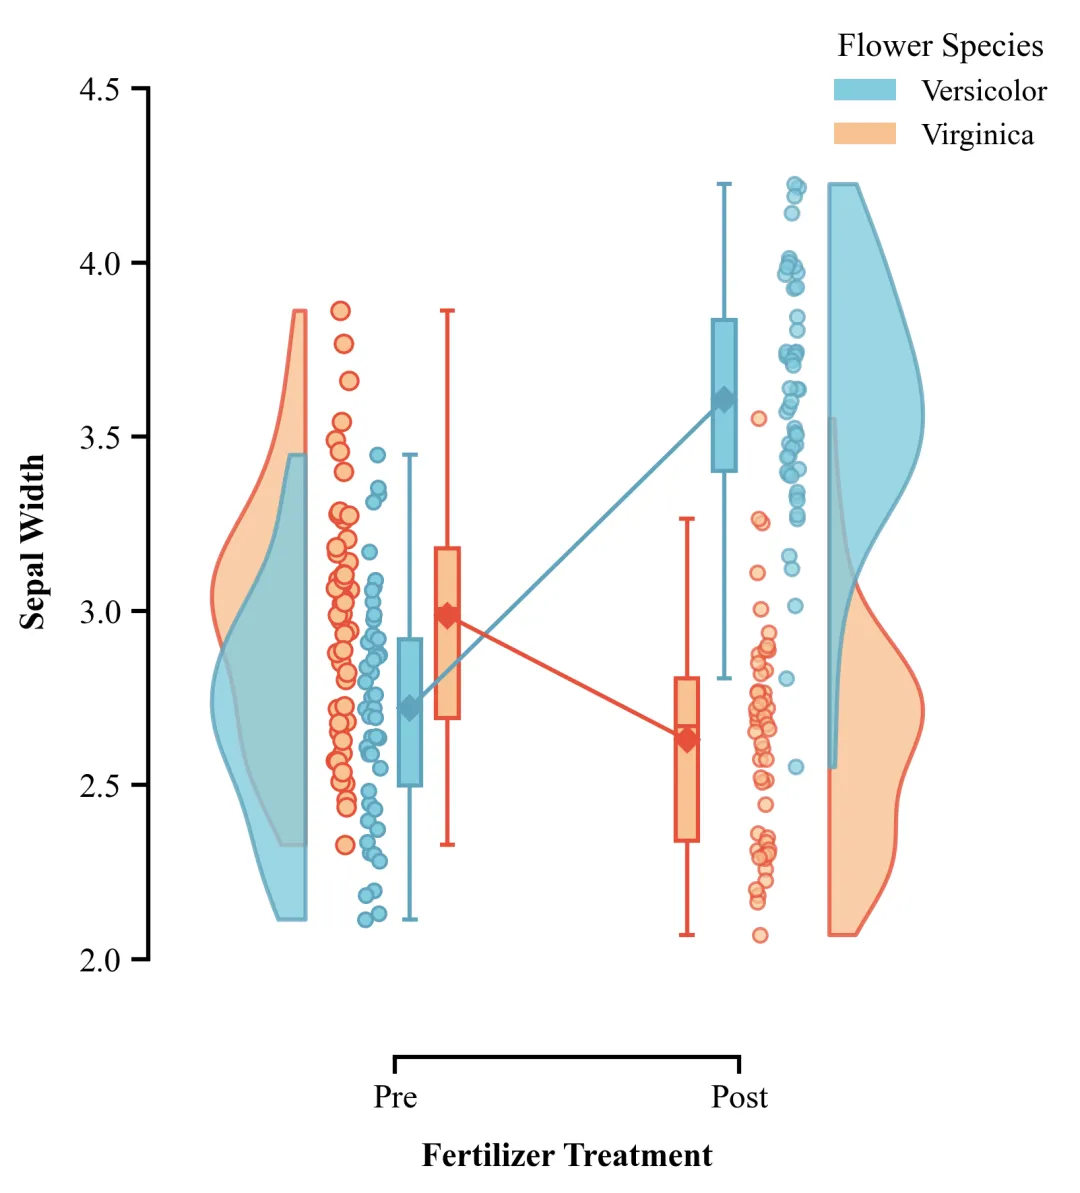
仿图 这张配对云雨图主要用于展示不同组别在两个不同条件或时间点下数据的分布特征、集中趋势以及原始观测值。图中不同颜色代表Versicolor和Virginica组数据,最外侧半边小提琴图表达了数据的概率密度,形状越宽阔说明该数值区间的样本越集中、越密集;中间散点呈现了每一个真实的原始样本数据,能看到具体的样本量和离散程度;箱线图箱体展示出了数据的四分位数间距,箱体内的短横线代表中位数,上下延伸的直线则标示了正常数据的分布极值范围;菱形标记和直线连接的线段是均值趋势线,揭示了经过处理后,Versicolor均值和Virginica的均值的变化趋势。 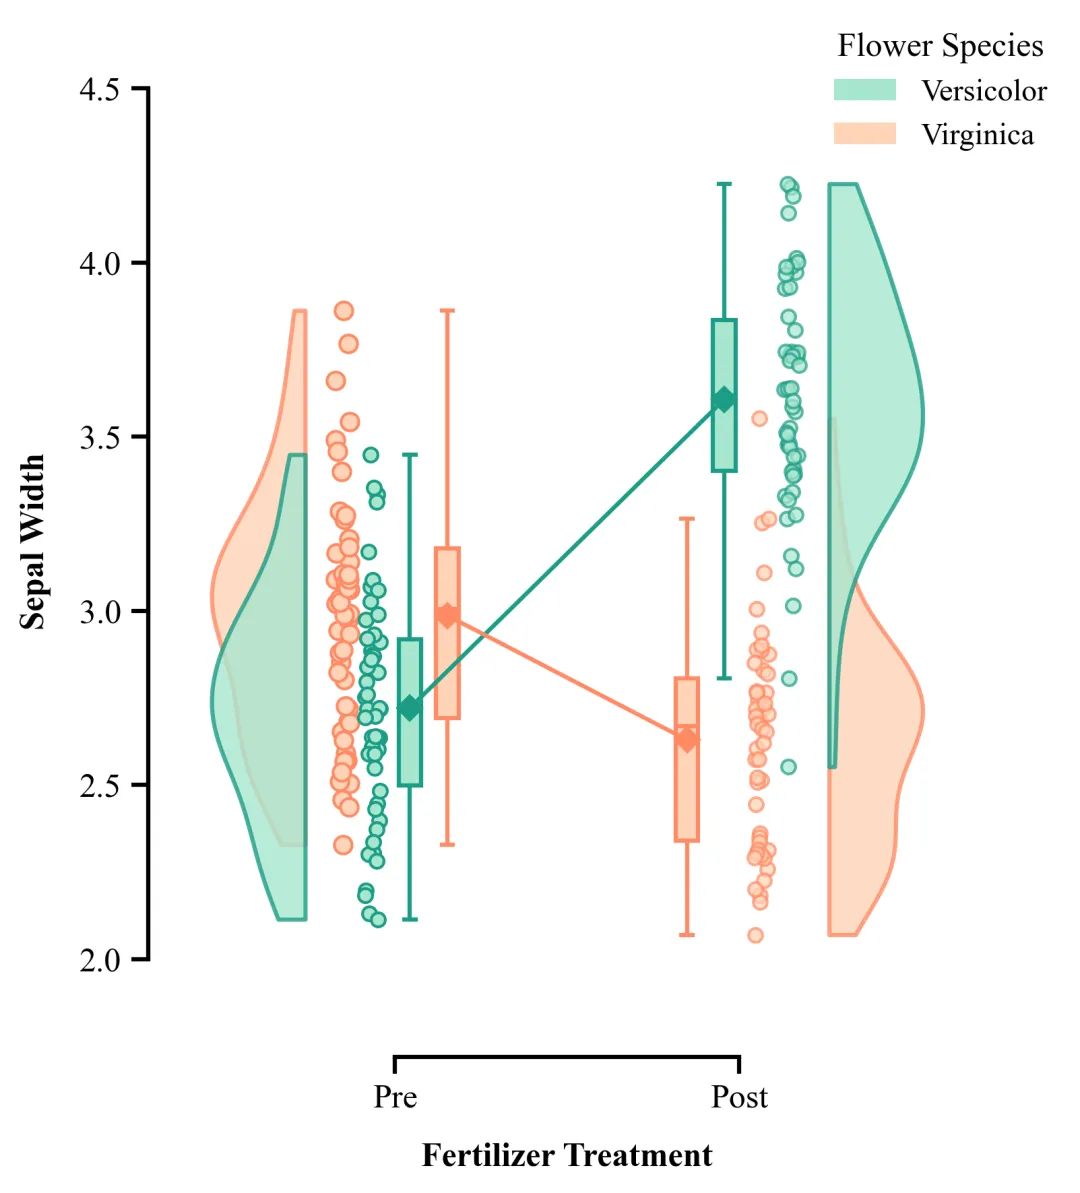
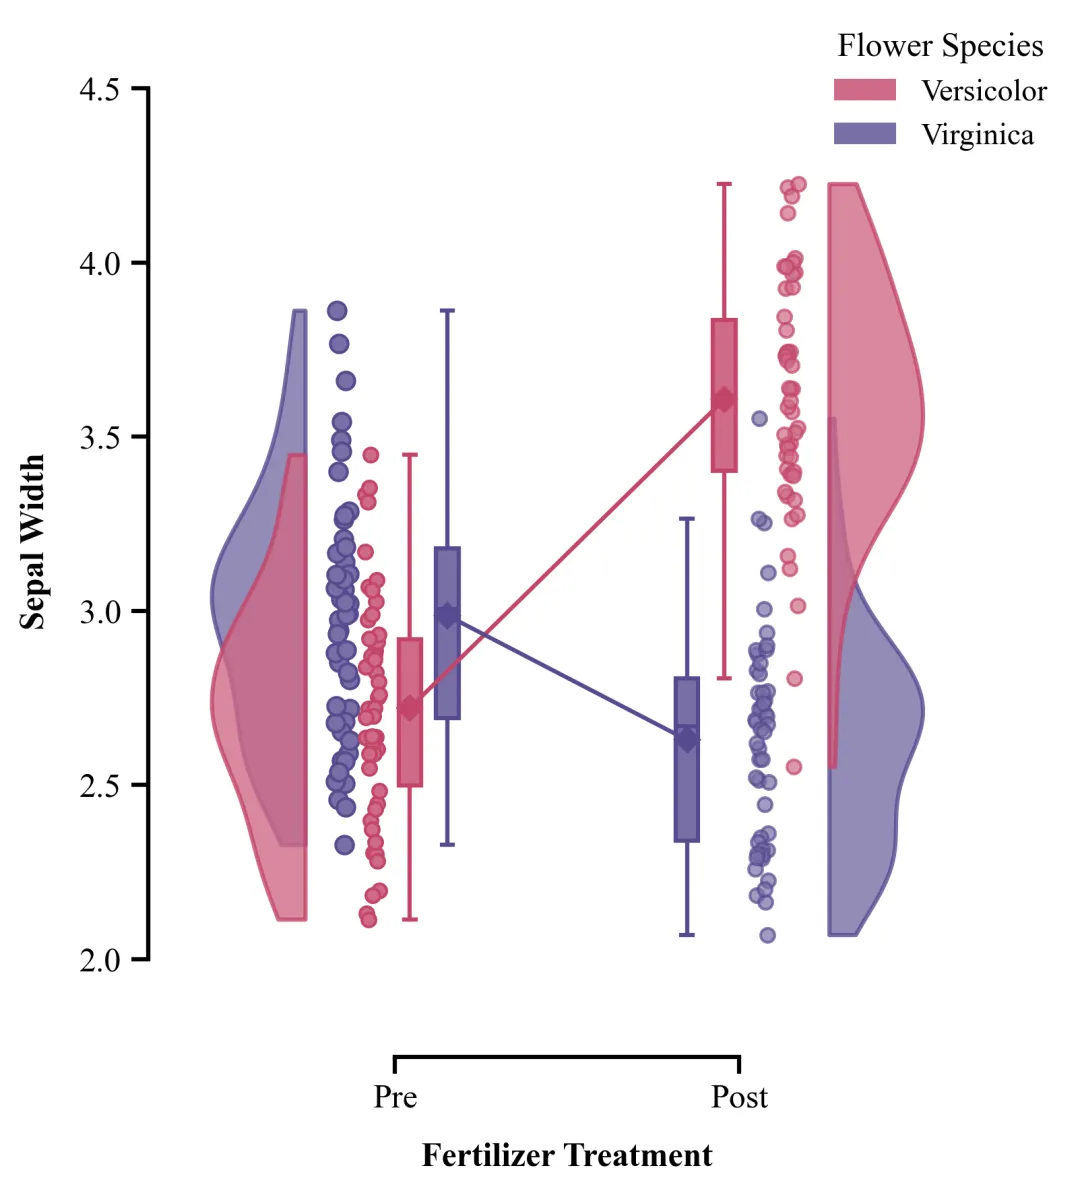

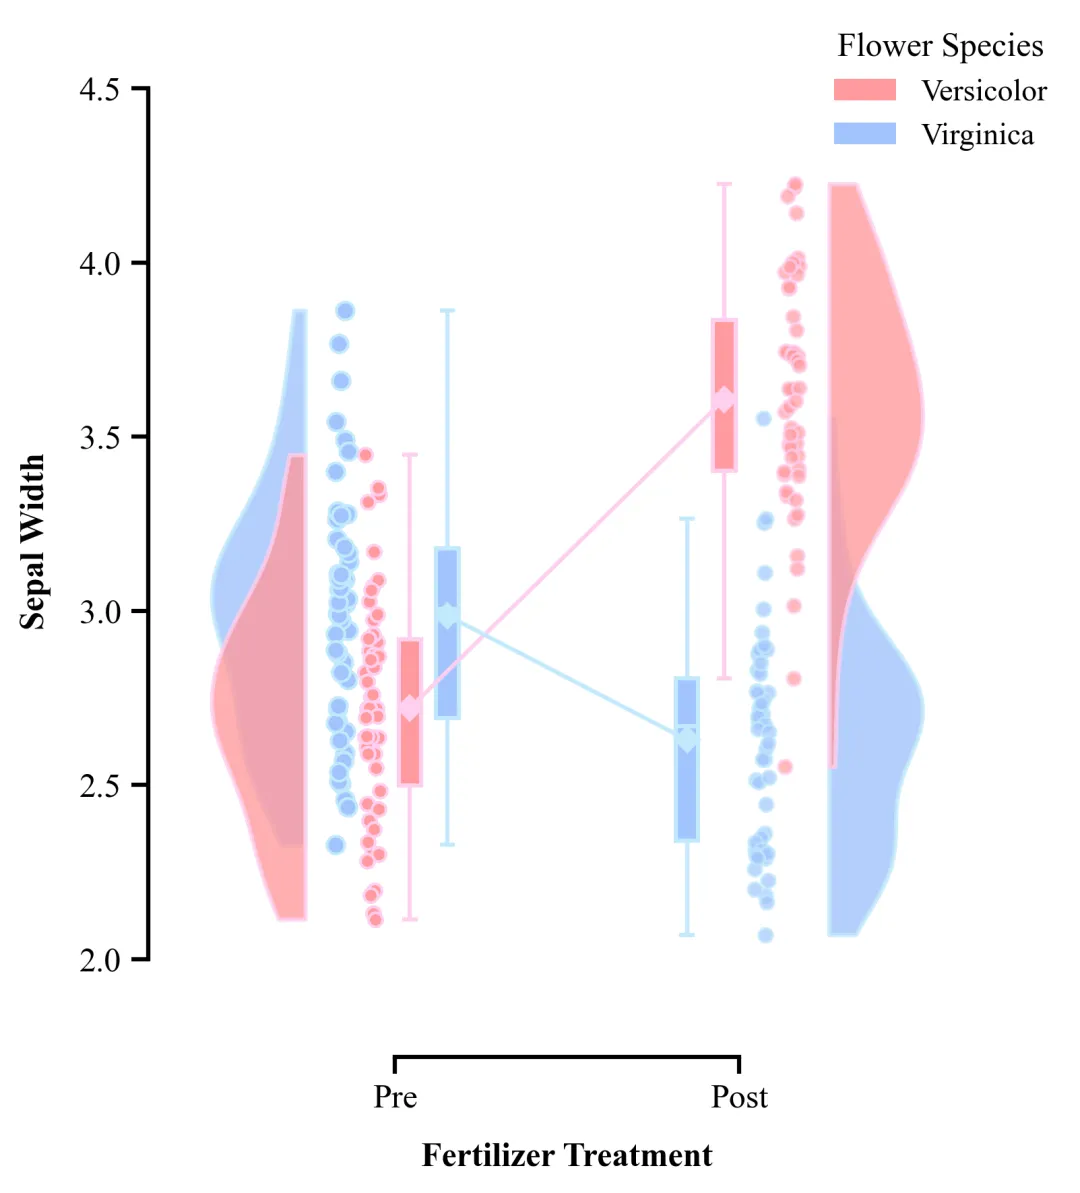
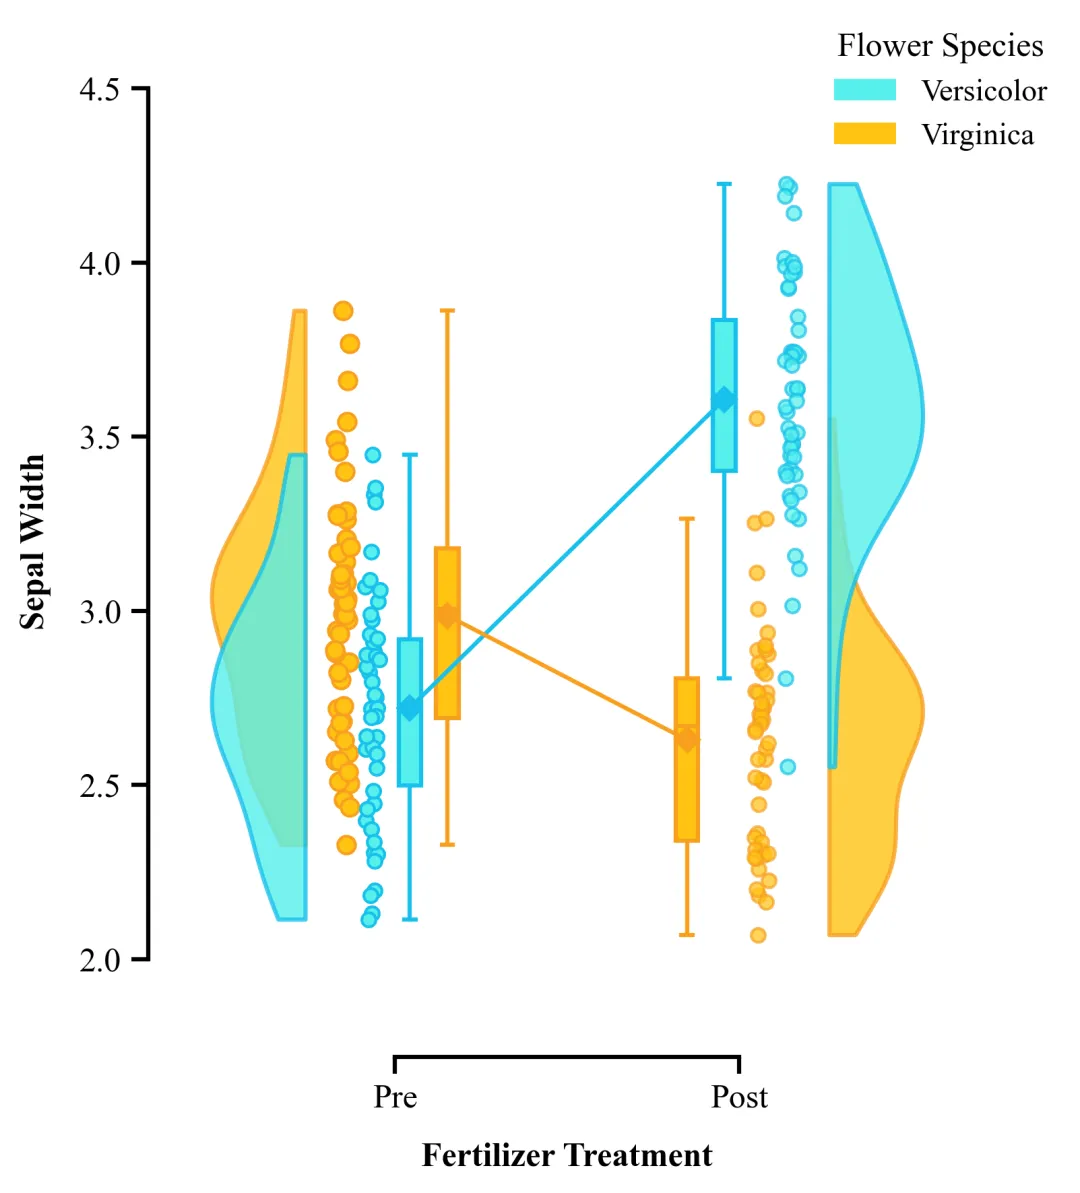
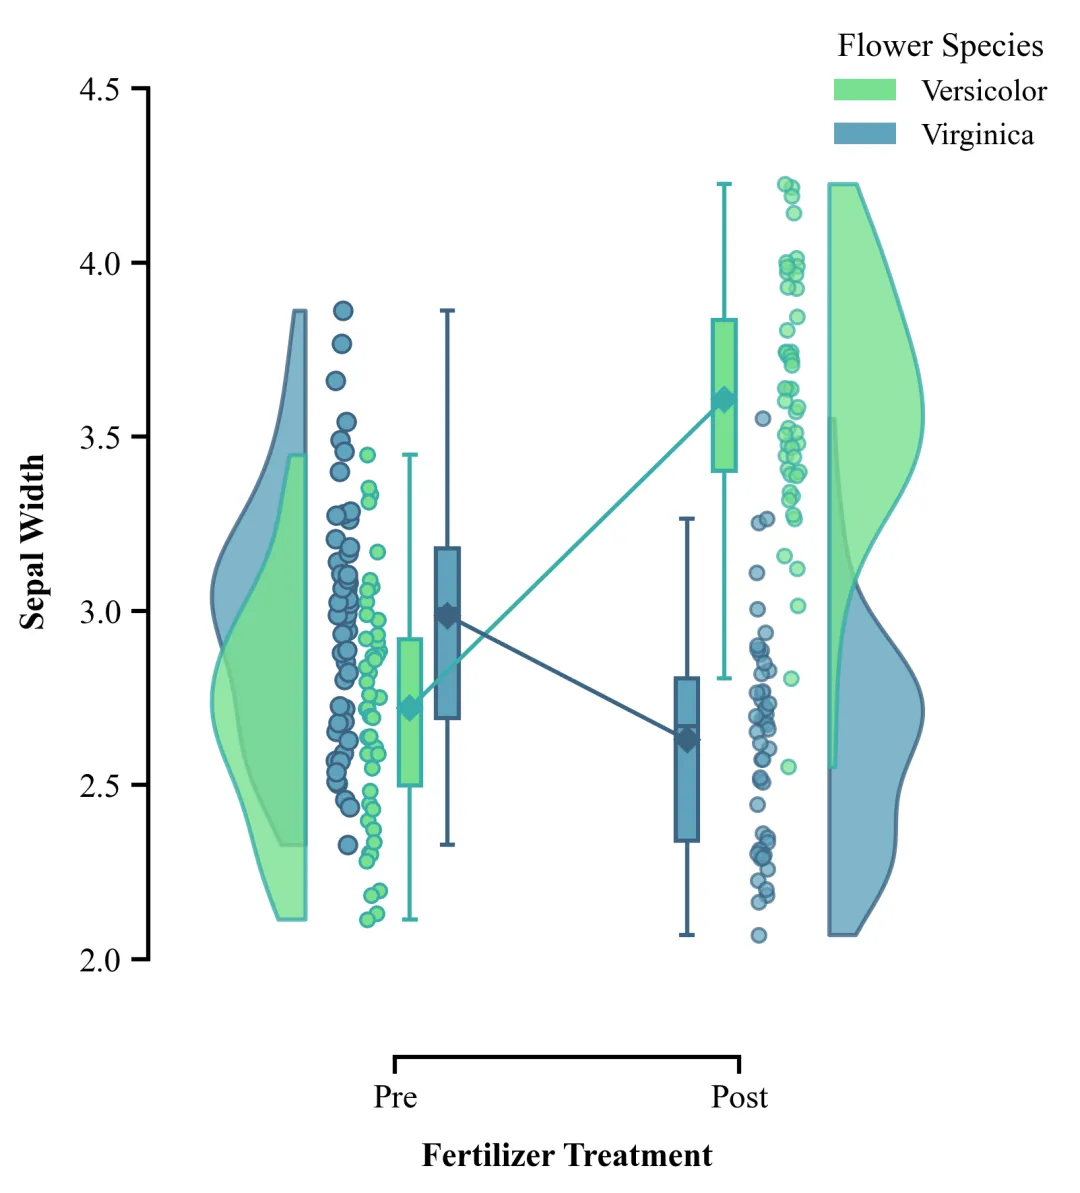
多种配色 


库的导入以及字体设置 

设置颜色库 

半小提琴图绘制函数 

箱线图样式设置辅助函数 

主绘图函数:数据准备与画布初始化 

主绘图函数:绘制左侧图形元素 

主绘图函数:绘制右侧图形元素 

主绘图函数:绘制配对连接线 

主绘图函数:坐标轴和边框设置 

主绘图函数:图例绘制以及绘图结果保存 

执行部分 


期刊图片复现|Python绘制二维偏依赖PDP图 期刊复现|python绘制基于SHAP分析和GAM模型拟合的单特征依赖图 期刊图片复现|python绘制带有渐变颜色shap特征重要性组合图(条形图+蜂巢图) 期刊复现|用Python绘制SHAP特征重要性总览图、依赖图、双特征交互效应SHAP图,解锁XGBoost模型的终极奥秘 期刊图片复现|Python绘制shap重要性蜂巢图+单特征依赖图+交互效应强度气泡图+交互效应依赖图(回归+二分类+分类) 

公众号中的所有所有的免费代码都已经下架了,都并入到付费部分里了,付费合集代码和数据的购买通道已经开通,全部合集100元,后续将会持续更新,决定购买请后台私信我,注意只会分享练习数据和代码文件,不会提供答疑服务,代码文件中已经包含了每行代码的完整注释,购买前请确保真的需要!!!
代码绘制成果展示
代码解释
第一部分
# =========================================================================================# ====================================== 1. 环境设置 =======================================# =========================================================================================import numpy as npimport pandas as pdimport matplotlib.pyplot as pltfrom matplotlib.patches import Patch
第二部分
# =========================================================================================# ======================================2.颜色库=======================================# =========================================================================================COLOR_SCHEMES = {1: ['#F08B94', '#C92B38', '#6E9AB7', '#165785'],}
第三部分
# =========================================================================================# ======================================3.小提琴图绘制函数=======================================# =========================================================================================def plot_half_violin(ax, #坐标轴data,#数据pos, #位置side='left', #方向color_fill='blue',#填充颜色color_edge='blue'): #边缘颜色#设定保留左半侧if side == 'left':vertices[:, 0] = np.clip(vertices[:, 0], -np.inf, pos) #将顶点X轴坐标限制在负无穷到中心位置之间else:vertices[:, 0] = np.clip(vertices[:, 0], pos, np.inf)
第四部分
# =========================================================================================# ======================================4.箱线图样式设置辅助函数=======================================# =========================================================================================def style_boxplot(bp, edge_color, fill_color): #箱线图对象、边缘颜色和填充颜色# 遍历箱线图须线、帽线和中位线for element in ['whiskers', 'caps', 'medians']:box.set(color=edge_color, #边缘颜色linewidth=1.5) #边缘线粗细box.set(facecolor=fill_color) #填充颜色
第五部分
# =========================================================================================# ======================================5.主绘图函数=======================================# =========================================================================================def plot_raincloud_chart(df, scheme_id):colors = COLOR_SCHEMES[scheme_id] #提取配色方案for spine in ax.spines.values():spine.set_linewidth(1.5)#配置坐标轴刻度ax.tick_params(axis='both', #x、ywhich='major', #主刻度length=6, #长width=1.5, #宽labelsize=12) #字体大小
第六部分
base_pre = 1.0 #左侧图x轴基准位置#调用小提琴图绘制函数plot_half_violin(ax,virginica_pre,pos=base_pre - 0.2,side='left',color_fill=color_virgi_fill,color_edge=color_virgi_edge)ax.scatter(jitter_versi_pre, #xversicolor_pre, #yfacecolors=color_versi_fill, #填充颜色edgecolors=color_versi_edge, #边缘颜色linewidths=1, #边缘线宽alpha=1, #透明度s=40, #大小zorder=2) #层# 样式调整style_boxplot(bp2,color_virgi_edge,color_virgi_fill)
第七部分
base_post = 2.0 #右侧图x轴基准位置#Virginica右侧箱线图x位置pos_box_virgi_post = base_post - 0.18#Versicolor右侧箱线图x位置pos_box_versi_post = base_post - 0.08#绘制箱线图bp4 = ax.boxplot([versicolor_post], #数据positions=[pos_box_versi_post], #xwidths=0.06, #宽patch_artist=True, #颜色填充showfliers=False) #离群值plot_half_violin(ax,virginica_post,pos=base_post + 0.2,side='right', color_fill=color_virgi_fill,color_edge=color_virgi_edge)#Versicolor右侧小提琴图plot_half_violin(ax,versicolor_post,pos=base_post + 0.2,side='right',color_fill=color_versi_fill,color_edge=color_versi_edge)
第八部分
#Versicolor数据均值mean_versi_pre, mean_versi_post = np.mean(versicolor_pre), np.mean(versicolor_post)ax.plot([pos_box_virgi_pre, pos_box_virgi_post], #x[mean_virgi_pre, mean_virgi_post],#ycolor=color_virgi_edge, #颜色marker='D', #均值点形状markersize=6, #点大小linewidth=1.5, #线宽zorder=3) #层
第九部分
#X轴刻度线位置ax.set_xticks([(base_pre + 0.04), (base_post - 0.04)])# X轴刻度标注ax.set_xticklabels(['Pre', 'Post'], #文本fontsize=12, #字体大小fontweight='bold') #加粗ax.spines['top'].set_visible(False) #隐藏ax.spines['right'].set_visible(False)ax.spines['left'].set_position(('outward', 10)) #移动ax.spines['bottom'].set_position(('outward', 10))ax.spines['bottom'].set_bounds((base_pre + 0.04), (base_post - 0.04)) #范围ax.spines['left'].set_bounds(2.0, 4.5)
第十部分
#实例化图例legend_elements = [#绘制图例ax.legend(handles=legend_elements, #句柄title='Flower Species', #标题loc='upper right', #位置bbox_to_anchor=(1.15, 1.05), #坐标frameon=False, #边框title_fontsize=12, #标题大小fontsize=11) #文本大
第十一部分
# =========================================================================================# ======================================2.颜色库=======================================# =========================================================================================if __name__ == '__main__':excel_filename = r"data.xlsx"#原始数据df_real = pd.read_excel(excel_filename)#读取plot_all = True#是否批量绘图if plot_all:for scheme_id in COLOR_SCHEMES.keys():selected_hex_colors = COLOR_SCHEMES[scheme_id]print(f'正在绘制并保存配色方案:{scheme_id}')plot_raincloud_chart(df_real, scheme_id)else:scheme_id = 1selected_hex_colors = COLOR_SCHEMES[scheme_id]print(f'正在绘制并保存方案:{scheme_id}')plot_raincloud_chart(df_real, scheme_id)
如何应用到你自己的数据
1.设置原始数据的保存路径,执行部分:
excel_filename = r"F:\公众号素材\20260612-配对云雨图\simulated_iris_data.xlsx"#原始数据2.设置是否进行批量绘图,执行部分:
plot_all = True#是否批量绘图3.设置要读取的数据列名,执行部分:
versicolor_pre = df['Versicolor_Pre'].dropna().valuesversicolor_post = df['Versicolor_Post'].dropna().valuesvirginica_pre = df['Virginica_Pre'].dropna().valuesvirginica_post = df['Virginica_Post'].dropna().values
4.设置绘图结果的保存地址,执行部分:
plt.savefig(fr"raincloud_plot_scheme_{scheme_id}.pdf", bbox_inches='tight')推荐
获取方式
本文来自网友投稿或网络内容,如有侵犯您的权益请联系我们删除,联系邮箱:wyl860211@qq.com 。
随机文章
-
 10个月宝宝每天需要喝多少奶粉?
- 案例解读(3):PyControl-让 Python 成为你的油藏模拟超级大脑
- Python高手之路: 简易MIDI播放器
- [上海] Linux Systems Engineer
- Python数据分析可视化连载05:散点图+直方图入门,相关性与分布分析
- Python零基础入门|18 页保姆级速成笔记
- Linux服务器CPU高怎么办?从快速诊断到应急处理,一篇讲透
- 字节跳动都在用的《Python知识手册》高清PDF流出,770页干货,免费领!
- IPv4告急!Linux运维的IPv6转型全攻略,从配置到排障
- 大语言模型与Python实证量化特训营
- 2026最新AI-Python机器学习、深度学习核心技术与前沿应用及OpenClaw、Hermes自动化编程高级研应用
