期刊图片复现|Python绘制顶刊文章高颜值桑基图
- 2026-06-28 22:37:11
期刊图片复现|Python绘制顶刊文章高颜值桑基图

论文:Public transport accessibility in villages in and around major Chinese cities 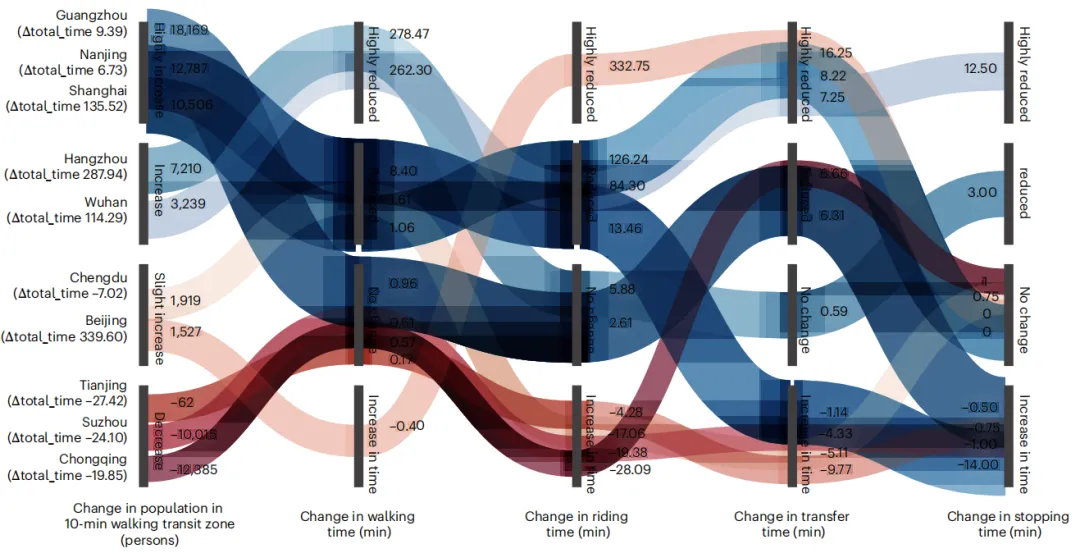
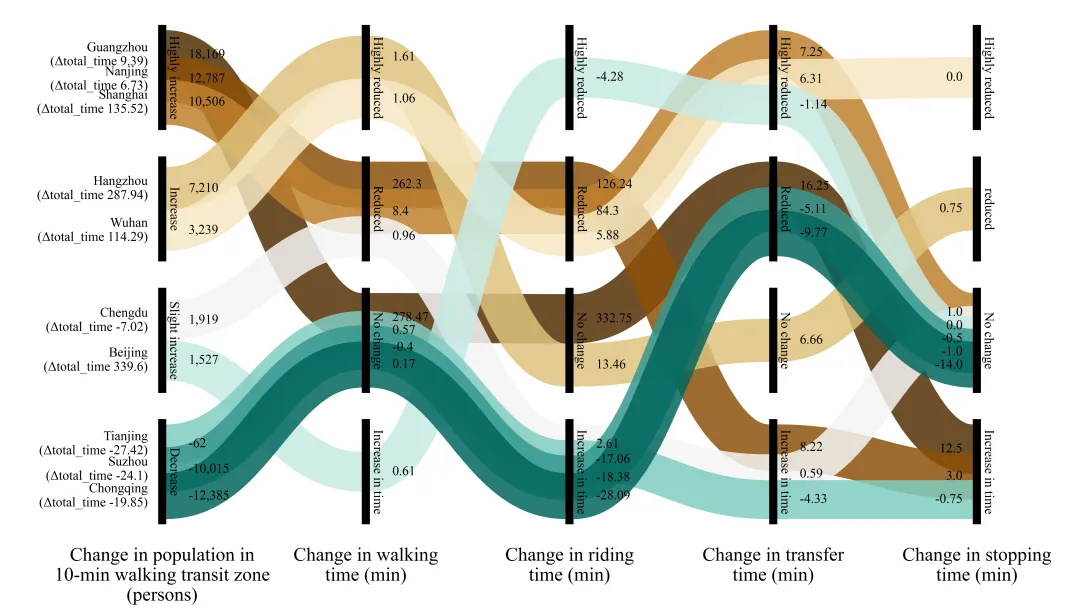
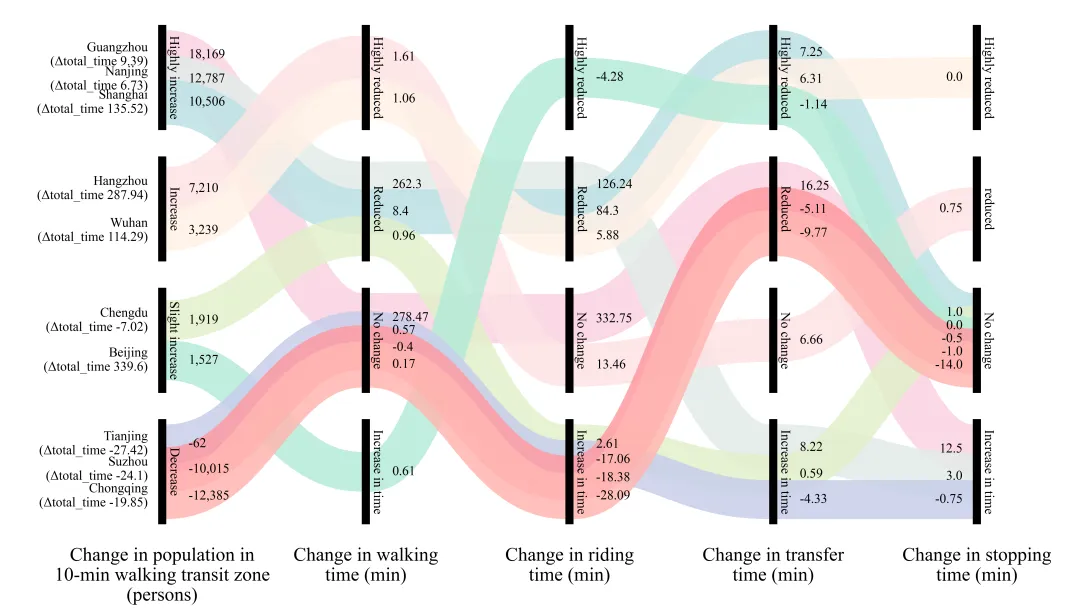
论文原图 这张桑基图由左至右通过多列垂直节点和蜿蜒交错的彩色流带,详细解构了2017年至2023年间中国十个主要城市在城郊公交出行各项指标上的变化细节。最左侧标注了十个城市的名称,其下方括号内的文本代表该市总出行时间(包含步行、乘车、换乘和等待的停靠时间)的中位数减少量,正值表示时间缩短(即情况改善),负值表示时间增加(即情况恶化),并且图中各城市的上下位置是严格依据其“10分钟步行公交覆盖区内人口变化量”由高到低进行降序排列的。紧随其后的第一列节点代表“10分钟步行公交覆盖区内的人口变化(人数)”,图表根据数值将其分为了“大幅增加(Highly increase)”、“增加(Increase)”、“轻微增加(Slight increase)”和“减少(Decrease)”四个层级,并在节点旁边标注了具体的增减人数。向右展开的第二、三、四、五列则分别追踪了总行程中四个具体环节的分钟数变化:步行时间变化(Change in walking time)、乘车时间变化(Change in riding time)、换乘时间变化(Change in transfer time)以及停靠时间变化(Change in stopping time)。在这些时间维度的列中,如果时间变长了则归为负值区域(Increase in time);而对于时间缩短的正值区域,图表利用四分位数进一步将其划分为“无变化(No change)”、“减少(Reduced)”和“大幅减少(Highly reduced)”三个等级,并在彩色流带上标明了具体的分钟数差值。贯穿全图的彩色流动条带从第一列的人口变化颜色类别发端,直观地连接并追踪了各个城市在后续四个出行时间环节上所处的等级路径,使得人口动态与各项时间成本变化的对应轨迹一目了然。 
仿图 
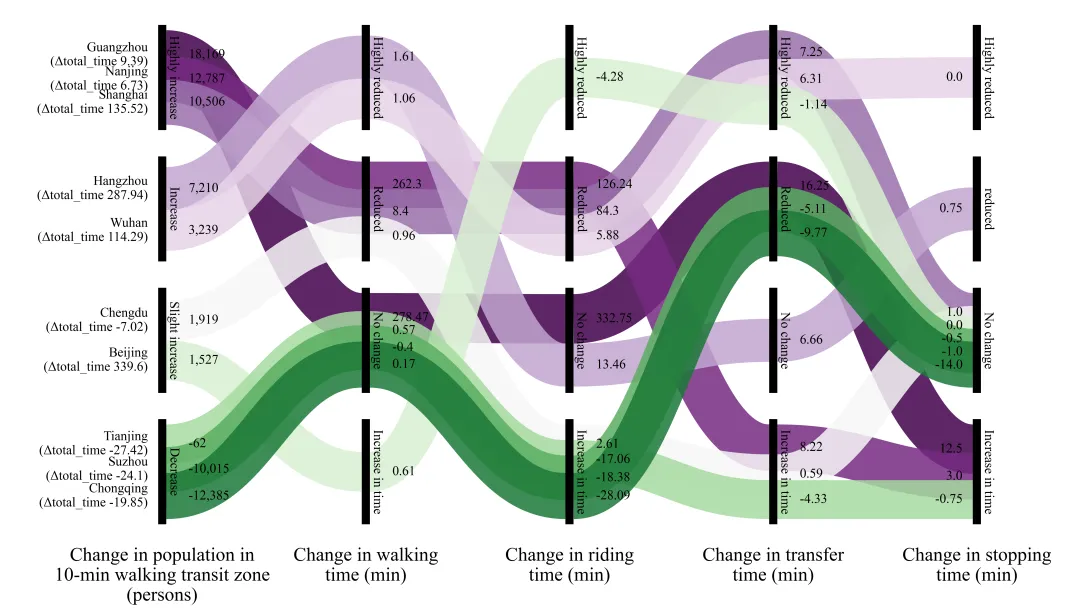
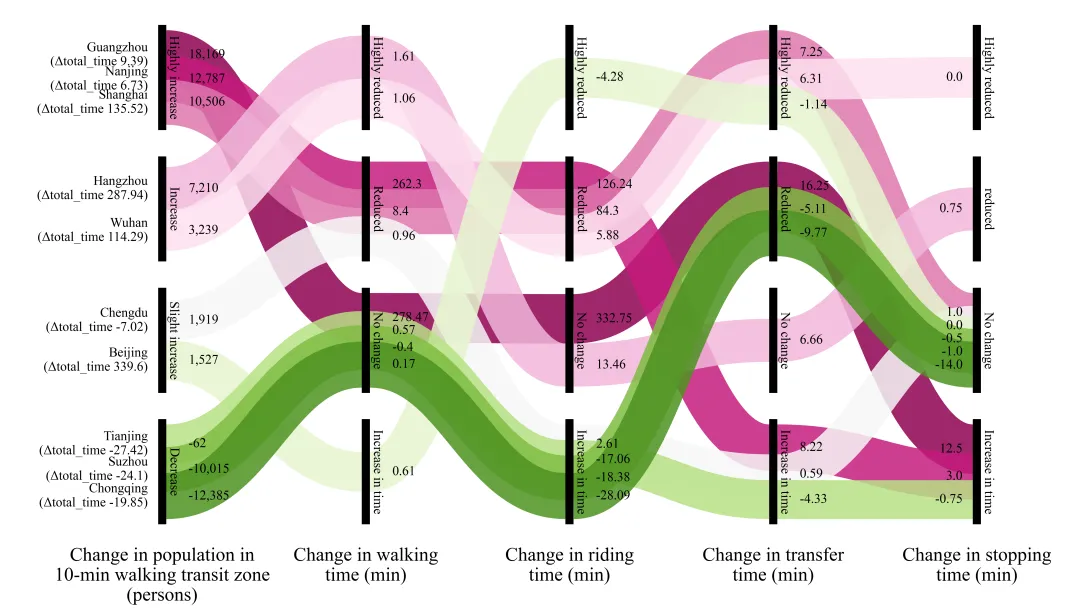
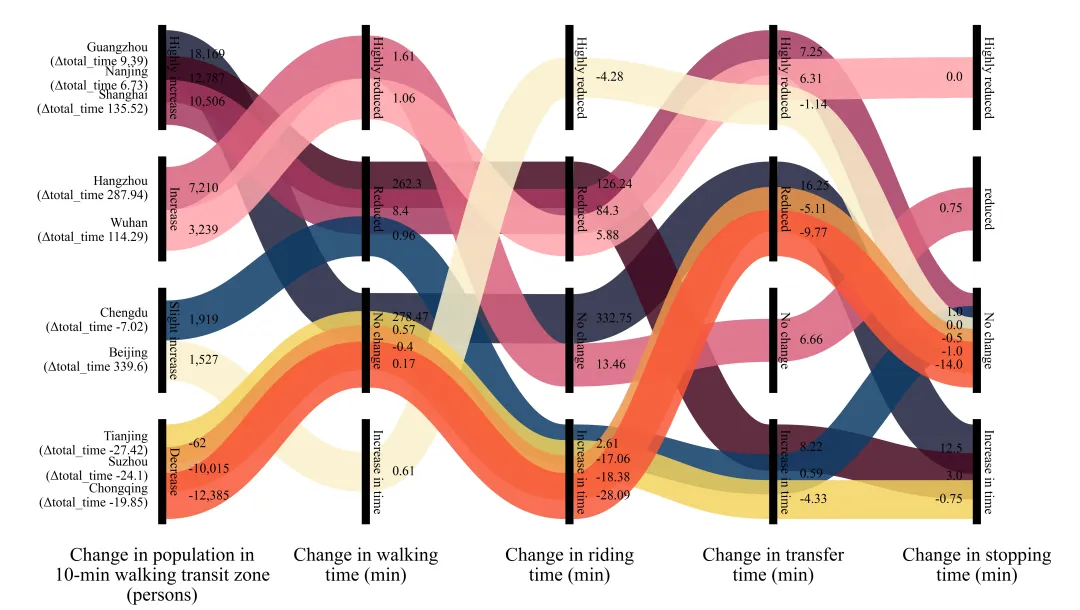
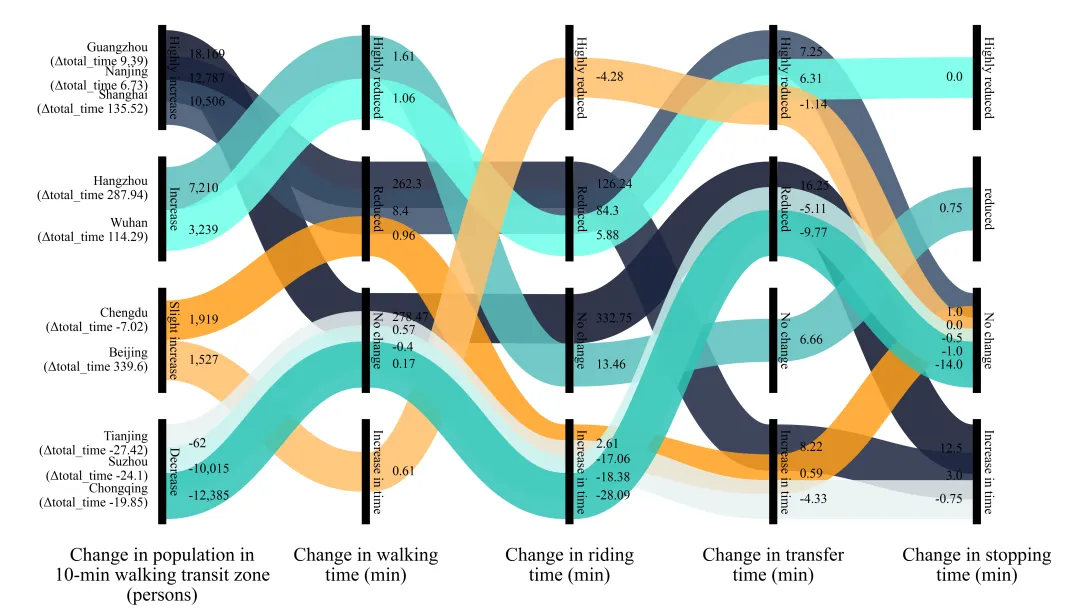
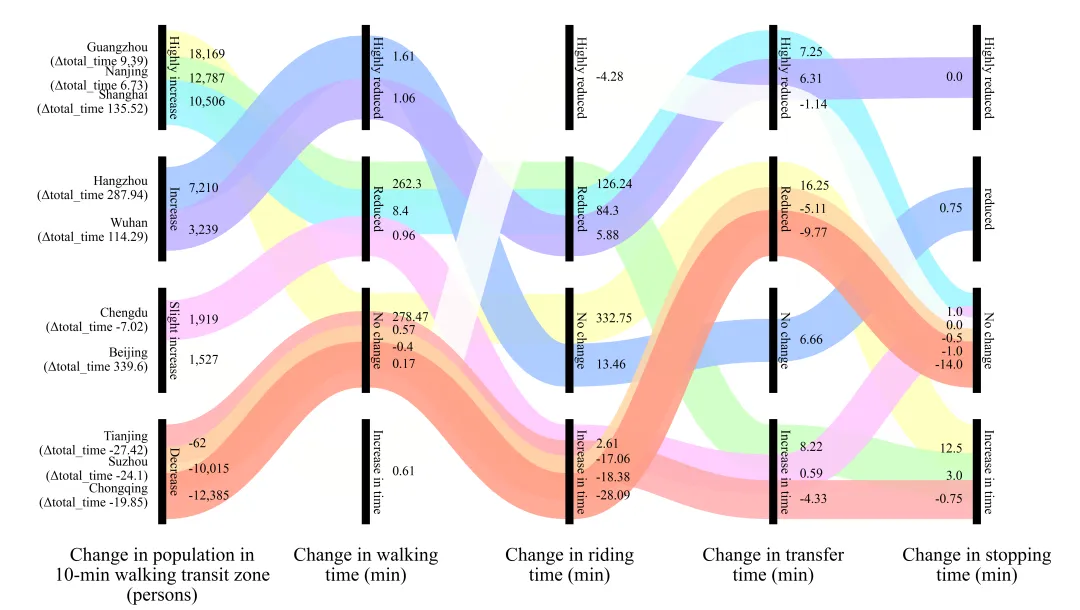
多种配色 


库的导入以及字体设置 

设置颜色库 

彩色流动带绘制函数 

绘图函数:数据提取以及每个黑色柱子节点定义 

绘图函数:画布创建,坐标系设定与带状高度初始化 

绘图函数:计算坐标、每个带的厚度,处理每一个柱子内流经数据的堆叠问题 

绘图函数:绘制彩色流动带 

绘图函数:绘制黑色柱子与标签文本 

绘图函数:绘制最左侧的起始处文本标注 

绘图函数:绘制每一个柱子处的数值文本标注 

绘图函数:绘制每一列的标题以及绘图结果保存 

执行部分 


期刊图片复现|Python绘制二维偏依赖PDP图 期刊复现|python绘制基于SHAP分析和GAM模型拟合的单特征依赖图 期刊图片复现|python绘制带有渐变颜色shap特征重要性组合图(条形图+蜂巢图) 期刊复现|用Python绘制SHAP特征重要性总览图、依赖图、双特征交互效应SHAP图,解锁XGBoost模型的终极奥秘 期刊图片复现|Python绘制shap重要性蜂巢图+单特征依赖图+交互效应强度气泡图+交互效应依赖图(回归+二分类+分类) 

公众号中的所有所有的免费代码都已经下架了,都并入到付费部分里了,付费合集代码和数据的购买通道已经开通,全部合集100元,后续将会持续更新,决定购买请后台私信我,注意只会分享练习数据和代码文件,不会提供答疑服务,代码文件中已经包含了每行代码的完整注释,购买前请确保真的需要!!!
代码绘制成果展示
代码解释
第一部分
# =========================================================================================# ====================================== 1. 环境设置 =======================================# =========================================================================================import matplotlib.pyplot as pltimport matplotlib.patches as patchesimport matplotlib as mplimport pandas as pd
第二部分
# =========================================================================================# ======================================2.颜色库=======================================# =========================================================================================COLOR_SCHEMES = {1: ['#B6CBDD', '#5B85A8', '#25557E', '#B5D2E5', '#3E2D53', '#F0DDD1', '#D79691', '#A4545B', '#92323C', '#6E2332', '#8C8C8C'],}
第三部分
# =========================================================================================# ======================================3.彩色流动带绘制函数=======================================# =========================================================================================def draw_ribbon(ax, x0, y0_mid, x1, y1_mid, color, thickness_data, points_per_y_unit):#控制点在X轴上的偏移量dx = (x1 - x0) * 0.45patch = patches.PathPatch(path, #路径对象facecolor='none', #填充色edgecolor=color, #边缘颜色linewidth=linewidth_points, #宽alpha=0.85, #透明度capstyle='butt', #线条端点的样式zorder=2) #层ax.add_patch(patch) #添加到轴中
第四部分
# =========================================================================================# ======================================4.桑基图绘制函数=======================================# =========================================================================================def plot_advanced_forest_chart(df, scheme_id):#需要展示的具体数值字符串列表display_vals = [str(row['Pop_Val']),str(row['Walk_Val']),str(row['Ride_Val']),str(row['Trans_Val']),str(row['Stop_Val'])]#列名称col_labels = ["Change in population in\n10-min walking transit zone\n(persons)","Change in walking\ntime (min)","Change in riding\ntime (min)","Change in transfer\ntime (min)","Change in stopping\ntime (min)"]
第五部分
#创建画布fig, ax = plt.subplots(figsize=(26, 14))PILLAR_HEIGHT = 16.0 #柱子总高度PILLAR_WIDTH = 0.32 #柱子宽度ROW_SPACING = 20 #柱子间隔常数COL_SPACING = 8.0 #列间隔常数#每一层柱子中心Y坐标Y_CENTERS = [ROW_SPACING * 1.5,ROW_SPACING * 0.5,-ROW_SPACING * 0.5,-ROW_SPACING * 1.5]ratio = 0.48c['render_w'] = PILLAR_HEIGHT * ratio #高度值
第六部分
#遍历列for col in range(5):#遍历行for row in range(4):cities_in_node = [c for c in cities if c['nodes'][col] == row] #筛选出数据raw_total_h = sum(c['render_w'] for c in cities_in_node) #改柱子的所有带的总高度current_y_top = Y_CENTERS[row] + total_span / 2 #当前色带堆叠最顶端的初始y坐标# 遍历属于当前节点层级的所有城市for c in cities_in_node:allocated_h = c['render_w'] # 高度值c.setdefault('pos', {})[col] = (current_y_top, current_y_top - allocated_h) #记录当前列该城市色带的上边界与下边界Y坐标step = allocated_h * scale_factor #利用缩放因子计算下一个城市应当下降的坐标跨度current_y_top -= step #更新最顶端Y坐标的位置
第七部分
#遍历每个城市的数据对象for city in cities:for col in range(4): #遍历间隔开始绘制带x0 = X_COLS[col] + PILLAR_WIDTH #起点x坐标x1 = X_COLS[col + 1] #终点x坐标draw_ribbon(ax, #轴对象x0, #起点x坐标y0_mid, #起点y坐标中心点x1, #终点x坐标y1_mid, #终点y坐标中心点city['color'], #颜色thickness, #厚度points_per_y_unit) #转换系数
第八部分
#遍历列for col in range(5):#遍历行for row in range(4):y_bottom = Y_CENTERS[row] - PILLAR_HEIGHT / 2 #根据节点中心计算柱子的底边y坐标ax.text(text_x, #xY_CENTERS[row], #yCATEGORY_LEVELS[col][row], #文本rotation=-90, #旋转ha='center', #水平va='center', #垂直fontsize=18, #大小zorder=6) #层
第九部分
#用于收集最左侧用来标注城市名称的初始y坐标集合left_label_y_raw = []#遍历城市信息for city in cities:y_top, y_bot = city['pos'][0] #提取城市经过第1列时所占的最上和最下位置ax.text(X_COLS[0] - 0.4, #xadjusted_left_y[i], #ylabel, #文本ha='right', #水平va='center', #垂直fontsize=18) #大小
第十部分
#遍历添加数值标注for col inrange(5):val_y_raw = [] #用于存放当前所遍历到的这一列下各数值的原始y坐标#遍历for city in cities:y_top, y_bot = city['pos'][col] #边界数据val_y_raw.append((y_top + y_bot) / 2) #中心位置#其他列else:val_x = X_COLS[col] + 1.2 #x坐标ax.text(val_x, #xadjusted_val_y[i], #ycity['vals'][col], #数值ha='left', #水平va='center',#垂直fontsize=18,#大小zorder=6)#层
第十一部分
#遍历加列标题for col inrange(5):bottom_y = Y_CENTERS[-1] - PILLAR_HEIGHT / 2 - 3.5 #yax.text(X_COLS[col] + PILLAR_WIDTH / 2, #xbottom_y, #ycol_labels[col], #文本ha='center', #水平
第十二部分
# =========================================================================================# ======================================5.执行部分=======================================# =========================================================================================if __name__ == "__main__":df = pd.read_excel(r'data.xlsx')#原始数据print(df.head())else:scheme_id = 1print('正在绘制并保存方案:', scheme_id)plot_advanced_forest_chart(df, scheme_id)
如何应用到你自己的数据
1.设置原始数据的保存路径,执行部分:
df = pd.read_excel(r'data.xlsx')#原始数据2.设置是否要进行批量绘图,执行部分:
plot_all =True#是否批量绘图3.设置每个柱子的文本标注,绘图函数部分:
CATEGORY_LEVELS = [['Highly increase', 'Increase', 'Slight increase', 'Decrease'],['Highly reduced', 'Reduced', 'No change', 'Increase in time'],['Highly reduced', 'Reduced', 'No change', 'Increase in time'],['Highly reduced', 'Reduced', 'No change', 'Increase in time'],['Highly reduced', 'reduced', 'No change', 'Increase in time']]
4.提取数据,绘图函数部分:
for index, row in df.iterrows(): #提取当前城市各项数据在各个节点索引位置node_indices = [CATEGORY_LEVELS[0].index(row['Pop_Cat']),CATEGORY_LEVELS[1].index(row['Walk_Cat']),CATEGORY_LEVELS[2].index(row['Ride_Cat']),CATEGORY_LEVELS[3].index(row['Trans_Cat']),CATEGORY_LEVELS[4].index(row['Stop_Cat']) ]
5.设置每一列柱子的名称,绘图函数部分:
col_labels = ["Change in population in\n10-min walking transit zone\n(persons)","Change in walking\ntime (min)","Change in riding\ntime (min)","Change in transfer\ntime (min)","Change in stopping\ntime (min)"]
6.设置绘图结果的保存地址,绘图函数部分:
plt.savefig(fr'\{scheme_id}.png', dpi=300, bbox_inches='tight')推荐
获取方式
本文来自网友投稿或网络内容,如有侵犯您的权益请联系我们删除,联系邮箱:wyl860211@qq.com 。

