期刊图片复现|Python绘制SHAP特征依赖图+PDP+数据分布直方图复合图
- 2026-10-11 06:29:54
期刊图片复现|Python绘制SHAP特征依赖图+PDP+数据分布直方图复合图

论文:Nonlinear impacts of extreme climate on ecosystem health along China's terrestrial Borders: Threshold effects and multi-pathway transmission mechanisms 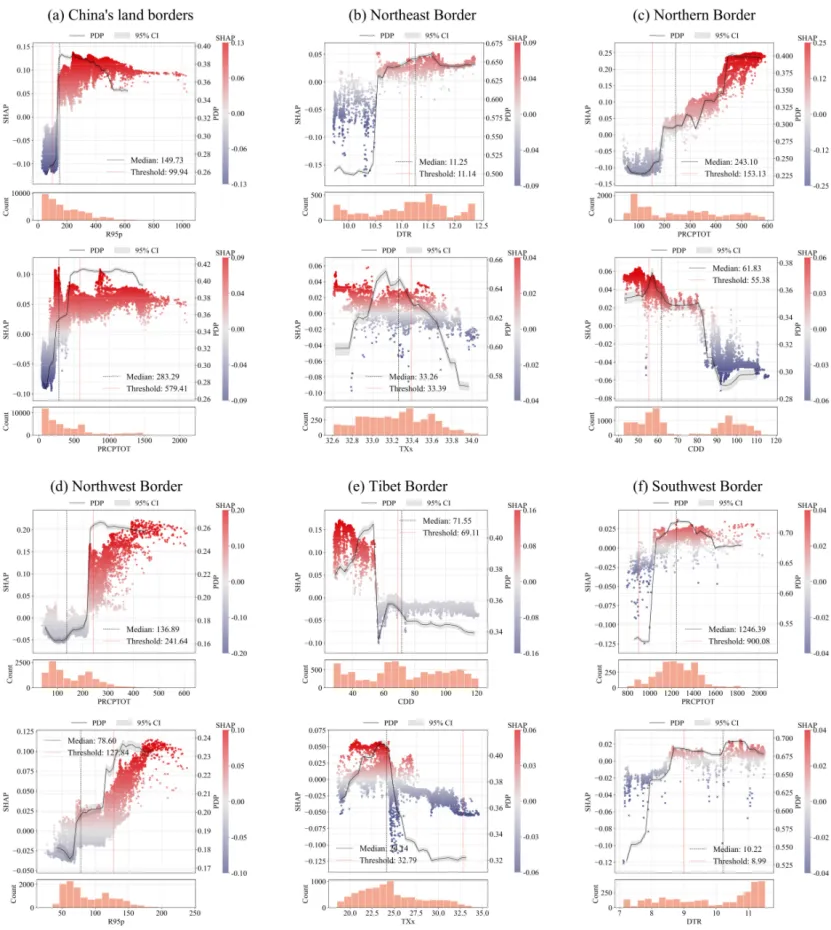
论文原图 此图通过将机器学习模型的SHAP值、PDP结果以及原始数据结合绘制而成。图中的子图分别展示了不同特征对模型预测结果的综合影响:在每个子图的上半部分,左侧的Y轴和散点代表SHAP值,散点的横坐标是特征的实际值,其颜色直观地反映了该特征在当前取值下对预测结果是正向还是负向贡献;右侧的Y轴则对应图中深灰色的实线,即部分依赖图(PDP),它揭示了该特征在全局样本中的平均边际效应趋势,而其周围的浅灰色阴影带代表了该趋势的95%置信区间;此外,上半图中还包含两条垂直参考线,其中灰色虚线标示了该特征数据的中位数位置,红色虚线则标记了特征影响发生显著改变的关键阈值,阈值的计算方法是对当前特征的SHAP散点应用LOWESS算法拟合出一条平滑趋势线,随后提取该趋势线首次跨越SHAP值为0的过零点,若无零点则寻找一阶导数变号的极值点,若是都没有取中位数。每个子图的下半部分是一个直方图,它的X轴与上半图的主体散点图严格对齐,Y轴表示数据频数,用于直观展示该特征在不同取值区间内的数据样本分布密度,从而帮助判断在数据稀疏或密集区域SHAP散点与PDP曲线解释的可靠程度。 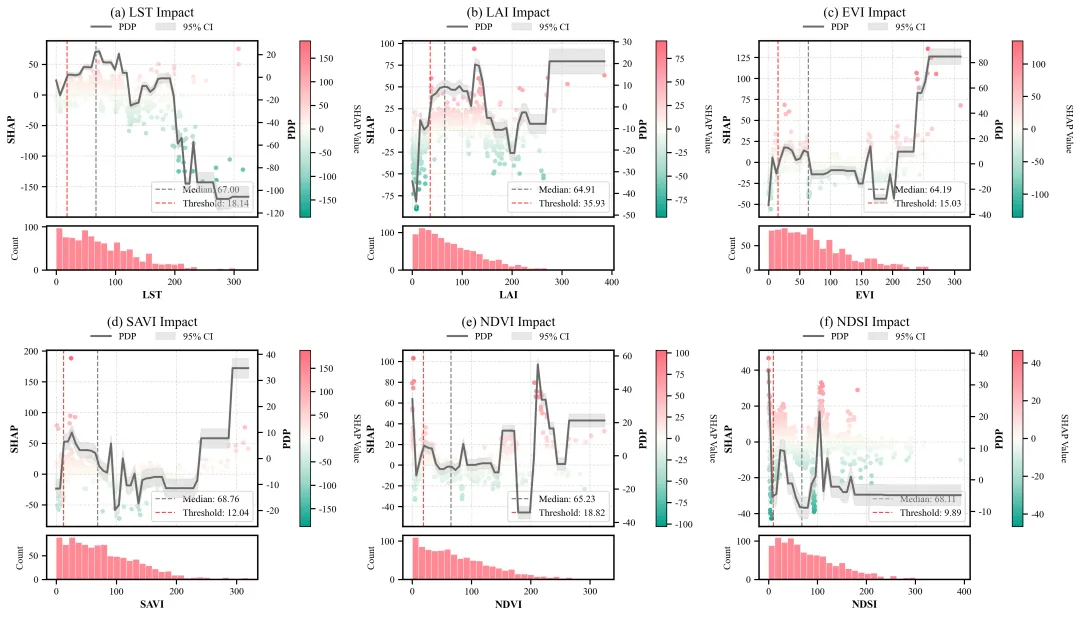
仿图 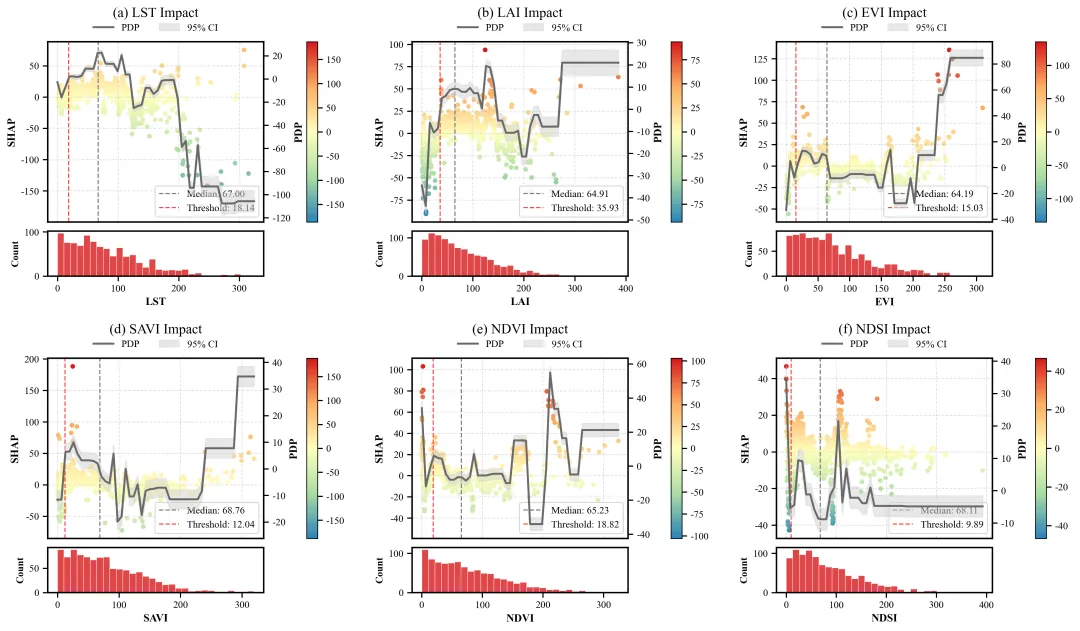
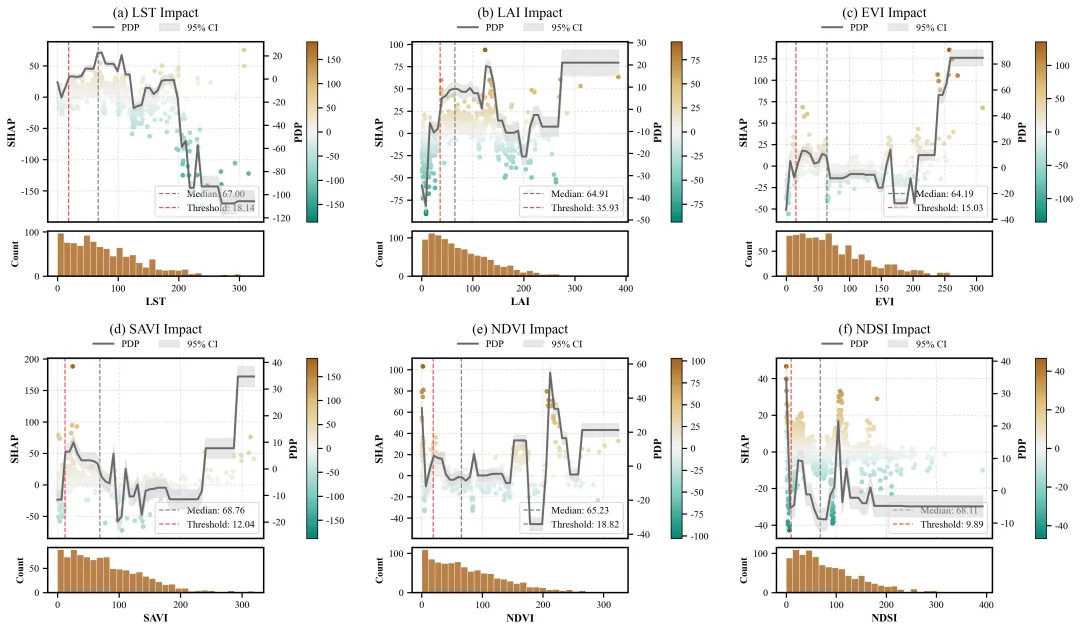
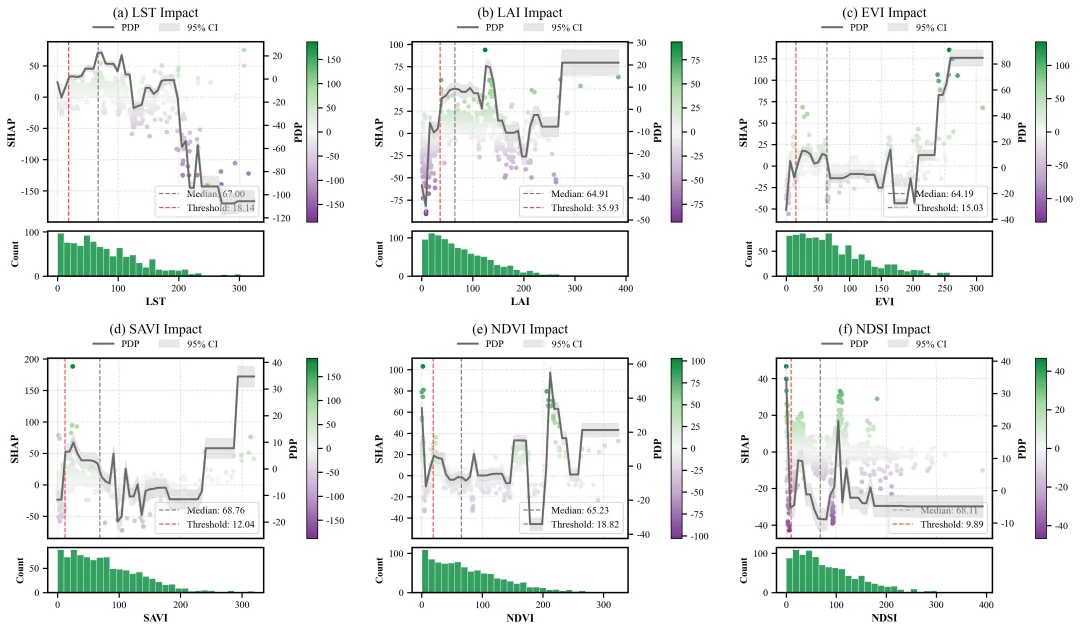
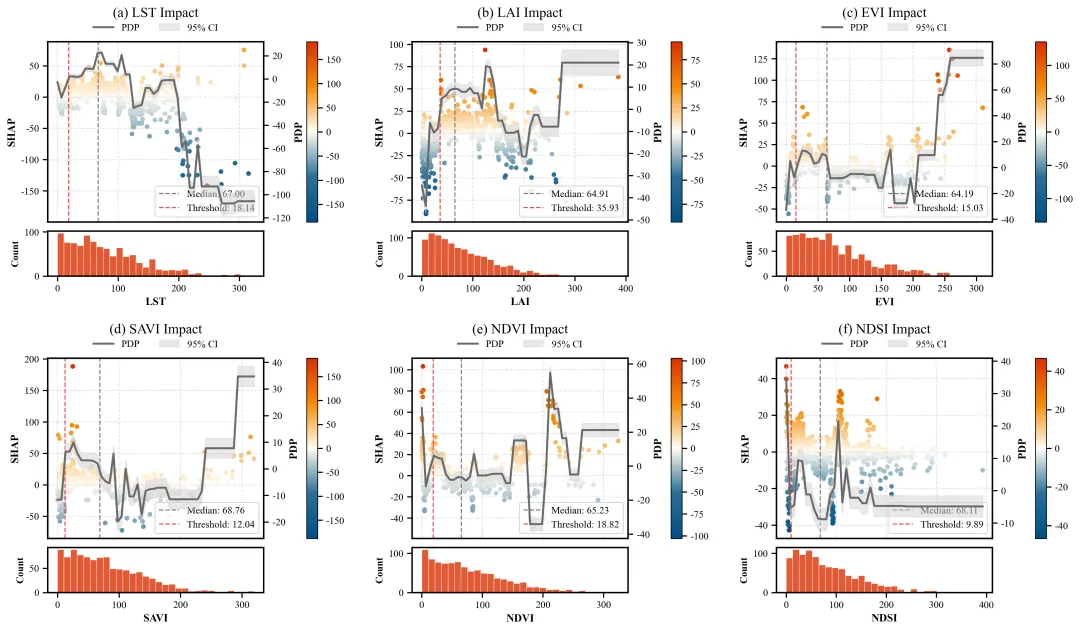
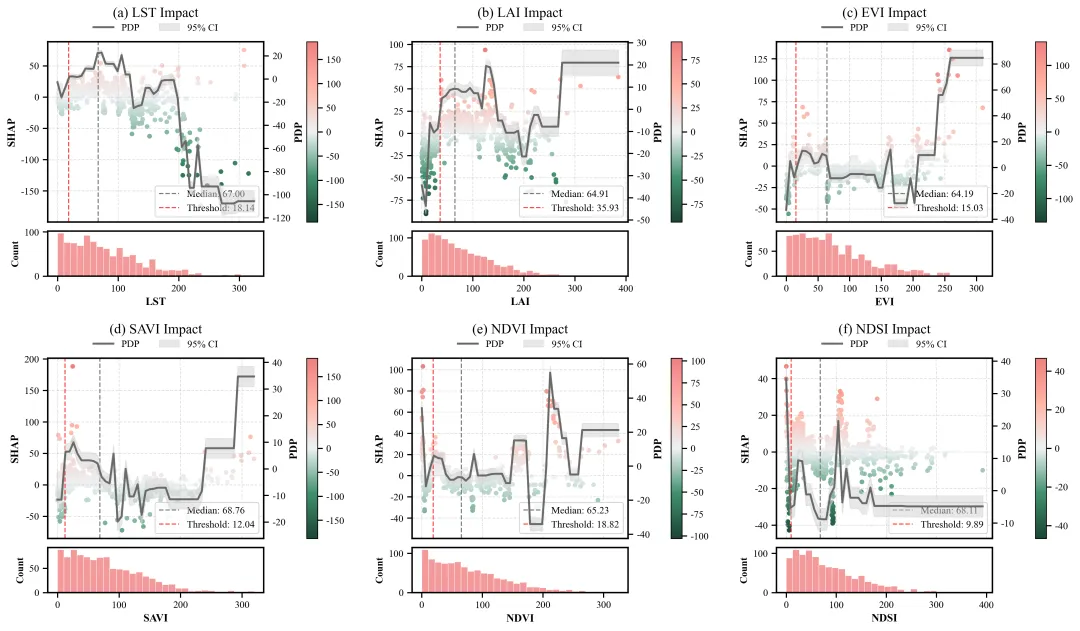
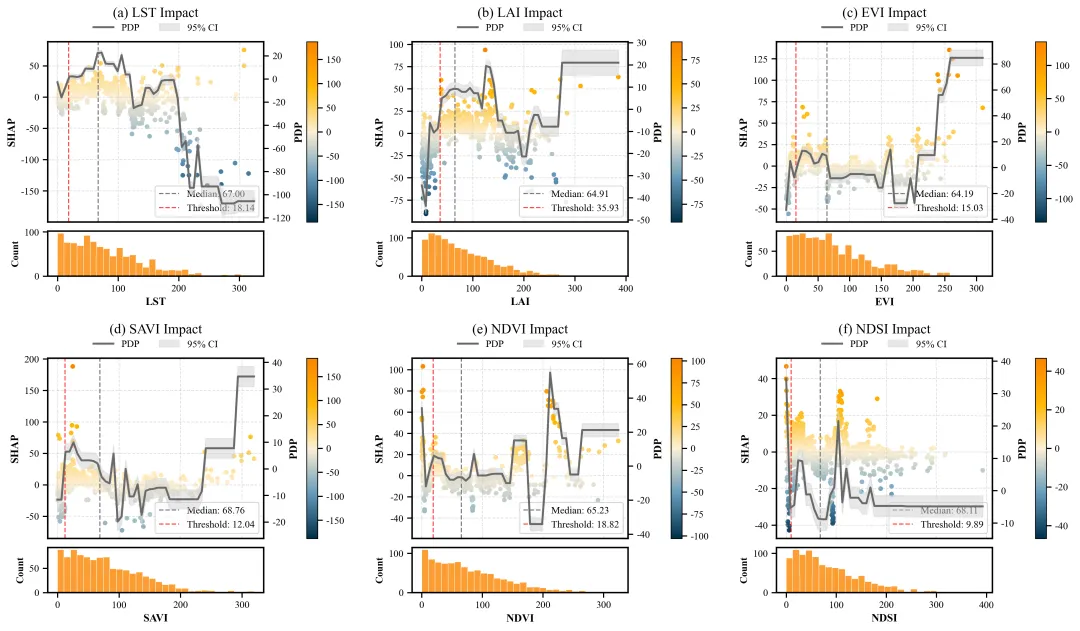
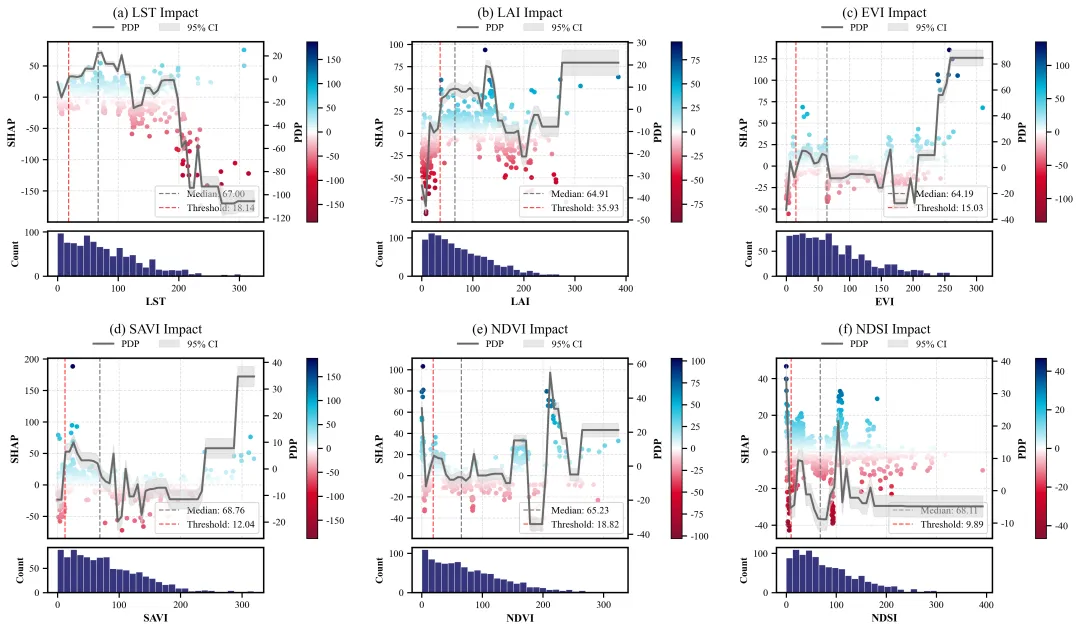
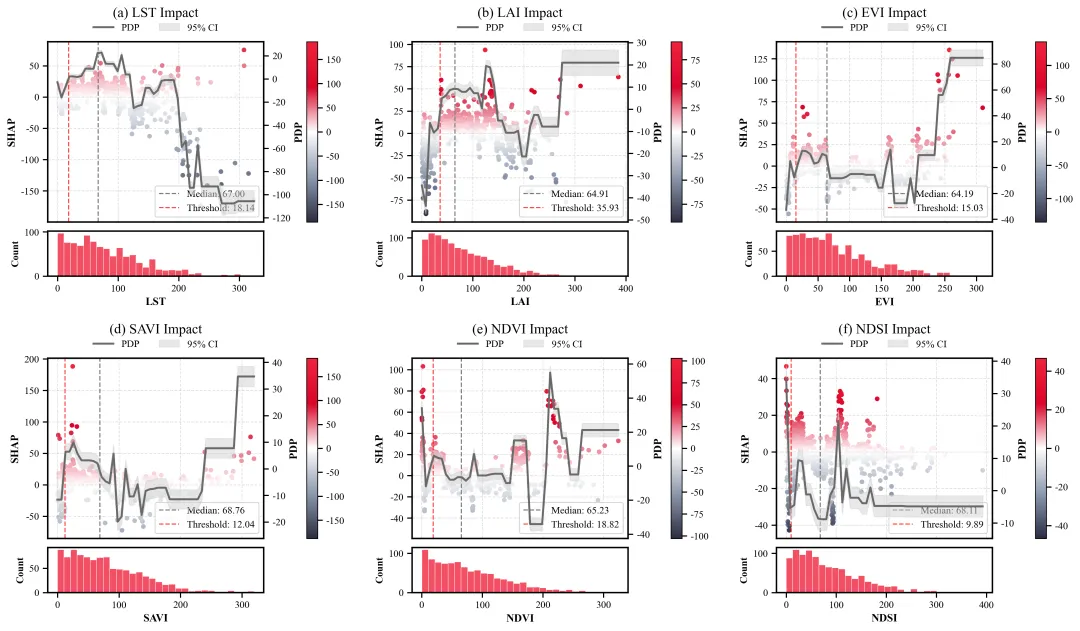
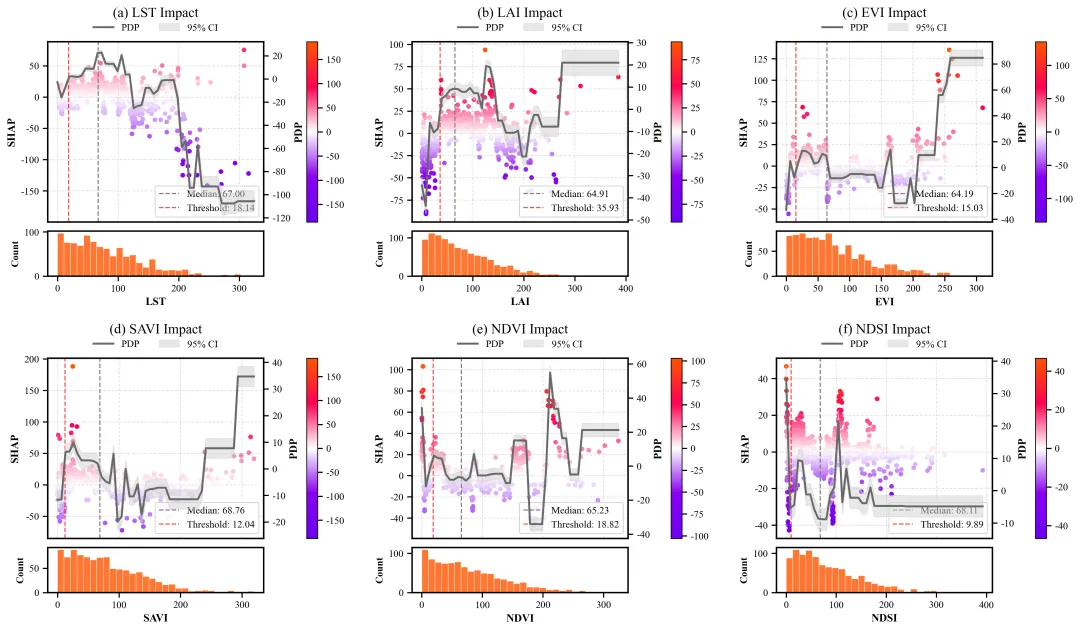
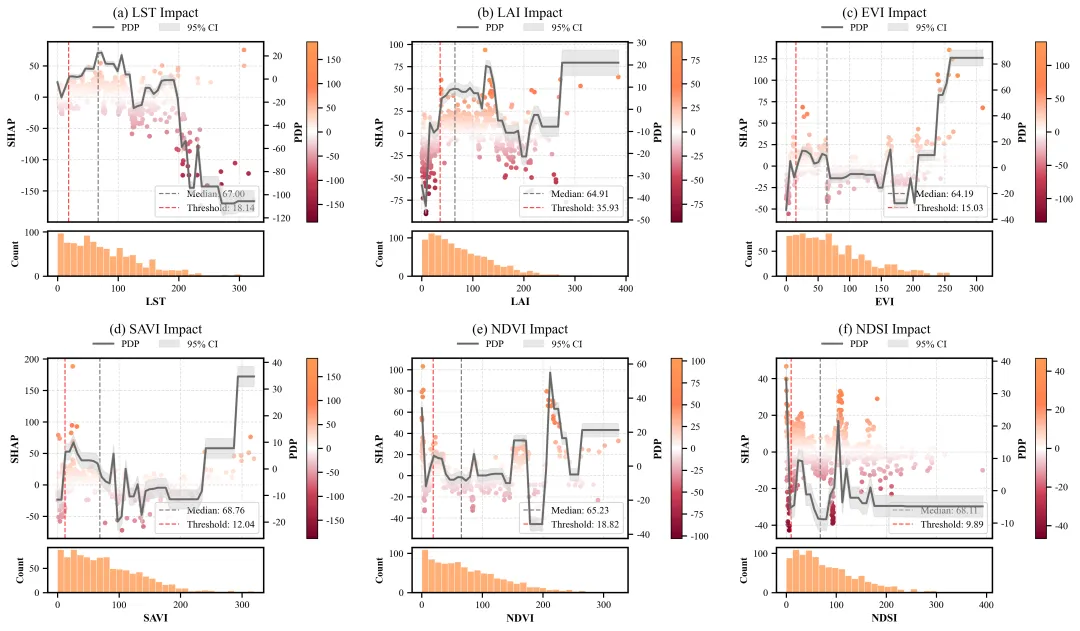
多种配色 



库的导入以及字体设置 

设置颜色库 

绘图函数:数据准备与画布初始化 

绘图函数:遍历特征与子图网格构建 

绘图函数:绘制上半部分主散点图与辅助线 

绘图函数:绘制上半部分双Y轴上的PDP曲线及图例配置 

绘图函数:绘制下半部分数据分布直方图 

执行部分:数据读取与划分 

执行部分:模型构建 

执行部分:结果分析 

执行部分:执行绘图 



期刊图片复现|Python绘制二维偏依赖PDP图 期刊复现|python绘制基于SHAP分析和GAM模型拟合的单特征依赖图 期刊图片复现|python绘制带有渐变颜色shap特征重要性组合图(条形图+蜂巢图) 期刊复现|用Python绘制SHAP特征重要性总览图、依赖图、双特征交互效应SHAP图,解锁XGBoost模型的终极奥秘 期刊图片复现|Python绘制shap重要性蜂巢图+单特征依赖图+交互效应强度气泡图+交互效应依赖图(回归+二分类+分类) 

公众号中的所有所有的免费代码都已经下架了,都并入到付费部分里了,付费合集代码和数据的购买通道已经开通,全部合集100元,后续将会持续更新,决定购买请后台私信我,注意只会分享练习数据和代码文件,不会提供答疑服务,代码文件中已经包含了每行代码的完整注释,购买前请确保真的需要!!!
代码绘制成果展示
代码解释
第一部分
# =========================================================================================# ====================================== 1. 环境设置 =======================================# =========================================================================================import osimport numpy as npimport pandas as pdimport matplotlib.pyplot as pltfrom matplotlib.gridspec import GridSpec, GridSpecFromSubplotSpecfrom matplotlib.colors import LinearSegmentedColormap
第二部分
# =========================================================================================# ======================================2.颜色库=======================================# =========================================================================================COLOR_SCHEMES = {1: ['#00A08A', '#9BD8C9', '#FDFDF5', '#FFB3B9', '#FF6B7A'],}
第三部分
# =========================================================================================# ======================================3.绘图函数=======================================# =========================================================================================def plot_advanced_forest_chart(data_bundle, scheme_id):df_X = data_bundle['X'] #特征数据#网格布局outer_gs = GridSpec(2, #行3, #列wspace=0.35, #行间距hspace=0.35) #列间距titles = ["(a)", "(b)", "(c)", "(d)", "(e)", "(f)"] #子图编号
第四部分
#遍历特征for i in range(len(features)):feature_name = features[i] #特征名x_data = df_X[feature_name].values #特征数据s_data = shap_vals[:, i] #SHAP值#子图布局inner_grid = GridSpecFromSubplotSpec(2, #行1, #列subplot_spec=outer_gs[i], #位置height_ratios=[4, 1], #高度比hspace=0.08) #层高间距
第五部分
ax_main = fig.add_subplot(inner_grid[0]) #主图#遍历边框for spine in ax_main.spines.values():spine.set_linewidth(1.5) #边框粗细#绘制中位数线ax_main.axvline(median_val, #xcolor='gray', #颜色linestyle='--', #虚线linewidth=1.2, #粗细label=f'Median: {median_val:.2f}') #文本标注#阈值线ax_main.axvline(threshold_val, #xcolor='red', #颜色linestyle='--', #虚线linewidth=1.2, #粗细alpha=0.7, #透明度label=f'Threshold: {threshold_val:.2f}') #文本标注
第六部分
#双Y轴ax_pdp = ax_main.twinx()ax_pdp.plot(pdp_x, #xpdp_y, #ycolor='dimgray', #颜色linewidth=2, #粗细label='PDP') #图例名lines2, labels2 = ax_pdp.get_legend_handles_labels() #获取副图例#副图例ax_pdp.legend(lines2, #副图例项labels2, #副图例标签loc='upper center', #位置bbox_to_anchor=(0.5, 1.15), #坐标ncol=2, #列frameon=False) #无边框
第七部分
ax_hist = fig.add_subplot(inner_grid[1], sharex=ax_main) #加直方图共用X轴#遍历直方图边框for spine in ax_hist.spines.values():spine.set_linewidth(1.5) #粗细hist_cax = hist_divider.append_axes("right",size="5%",pad=0.6)hist_cax.axis('off') #去掉占位轴
第八部分
# =========================================================================================# ======================================4.执行部分=======================================# =========================================================================================if __name__ == "__main__":df_full = pd.read_excel(r"data.xlsx") #读取原始数据df_X = df_full.iloc[:, :-1] #xdf_y = df_full.iloc[:, -1] #yfeature_names = df_X.columns.tolist() #特征名X_train, X_test, y_train, y_test = train_test_split(df_X, df_y, test_size=0.2, random_state=42) #划分数据
第九部分
xgb_model = XGBRegressor(random_state=42) #初始化模型#超参数param_grid = {'n_estimators': [5, 10,20,30],'max_depth': [3, 5,]}grid_search = GridSearchCV(estimator=xgb_model, param_grid=param_grid, cv=3, scoring='r2', n_jobs=-1) #网格搜索grid_search.fit(X_train, y_train) #拟合best_model = grid_search.best_estimator_ #最佳模型
第十部分
explainer = shap.TreeExplainer(best_model) #SHAP解释器shap_values = explainer.shap_values(df_X) #SHAP值mean_abs_shap = np.abs(shap_values).mean(axis=0) #SHAP绝对值均值print("-" * 40)
第十一部分
# 打包绘图数据df_real = {'X': df_X,'shap': sorted_shap,'pdp': pdp_results,'features': sorted_features}scheme_id = 1plot_advanced_forest_chart(df_real, scheme_id)print(f'正在绘制并保存配色方案:{scheme_id}')
如何应用到你自己的数据
1.设置原始数据的保存路径,执行部分:
df_full = pd.read_excel(r"data.xlsx")2.提取特征数据和目标数据,执行部分:
df_X = df_full.iloc[:, :-1]df_y = df_full.iloc[:, -1]
3.设置超参数网格,执行部分:
param_grid = {'n_estimators': [20,80,100],'max_depth': [3, 5,]}
4.设置是否要进行批量绘图,执行部分:
plot_all = False5.设置绘图结果的保存地址,绘图函数部分:
fig.savefig(fr"Scheme_{scheme_id}.png",dpi=300, bbox_inches='tight')推荐
获取方式
本文来自网友投稿或网络内容,如有侵犯您的权益请联系我们删除,联系邮箱:596563534@qq.com 。
