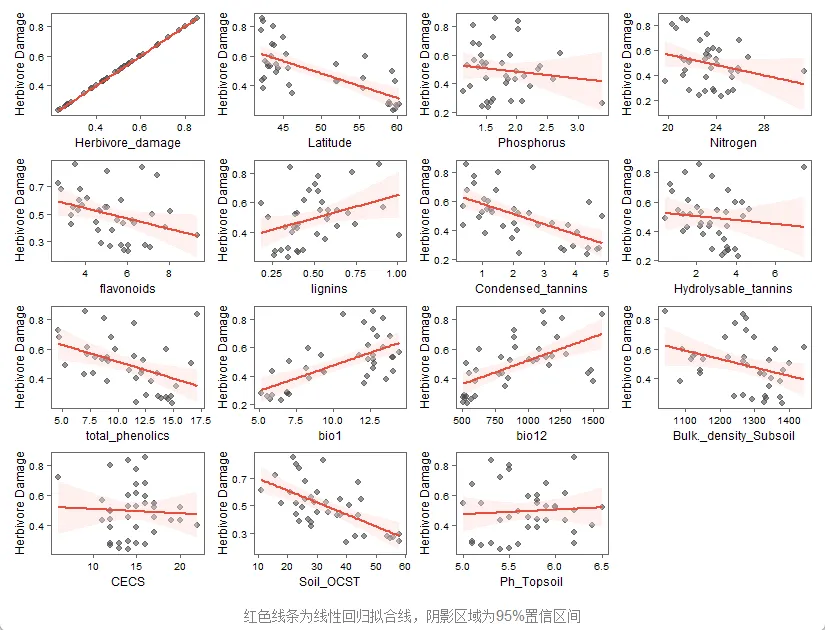
library(ggplot2)library(dplyr)library(tidyr)dat <- read.csv("C:/r-workspace/data/260106data.csv", header = TRUE,sep = ",")str(dat)summary(dat)dim(dat)plot_list <- lapply(names(dat), function(var) { ggplot(dat, aes(x = .data[[var]], y = Herbivore_damage)) + geom_point(color = "grey30", alpha = 0.7, size = 1.5) + geom_smooth(method = "lm", se = TRUE, color = "#e74c3c", fill = "#fadbd8", linewidth = 0.8) + labs(x = var, y = "Herbivore Damage") + theme_classic() + theme( panel.border = element_rect(color = "gray40", linewidth = 0.6, fill = NA), axis.line = element_line(color = "gray40", linewidth = 0.4), axis.ticks = element_line(color = "gray40", linewidth = 0.4), axis.title = element_text(size = 8), axis.text = element_text(size = 7), plot.margin = margin(4, 4, 4, 4, "pt") )})combined_plot <- wrap_plots(plot_list, ncol = 4) + plot_annotation( caption = "红色线条为线性回归拟合线,阴影区域为95%置信区间", theme = theme( plot.title = element_text(hjust = 0.5, size = 16, face = "bold", margin = margin(b = 10)), plot.subtitle = element_text(hjust = 0.5, size = 12, color = "gray40", margin = margin(b = 15)), plot.caption = element_text(hjust = 0.5, size = 10, color = "gray50", margin = margin(t = 10)), plot.background = element_rect(fill = "white", color = NA) ) )print(combined_plot)