实战 | 用Python+QMT打造A股盘中"深V反转"实时狙击系统
- 2026-07-03 16:33:03
1. 为什么要做这个系统?
做过短线的朋友都知道,盘中深V反转是最经典的抄底形态之一。

它的特点是:
📉 快速下跌:短时间内价格急挫 📈 强势反弹:跌到位后迅速拉升 📊 放量确认:反弹时成交量明显放大
如果能在V的底部第一时间发现信号,及时介入,往往能吃到一波不错的反弹利润。
但问题是——
盯盘太累了!特别是同时监控多只股票的分时图,人眼根本看不过来。
于是,我花了一周时间,用Python搭建了一套全自动的深V反转识别系统:
✅ 基于QMT接口实时获取tick数据✅ 自动聚合成1/5分钟K线✅ 机器学习模型实时识别反转形态✅ 信息推送提醒
下面把完整的实现思路和代码分享给大家。
2. 深V反转的数学定义
在写代码之前,我们需要先把"深V反转"这个感性认识量化成可计算的规则。
我定义的深V反转需要满足以下条件:
条件1:当前点是局部最低点条件2:之前N根K线内,有明显下跌(≥1.5%)条件3:从最低点开始,已有明显反弹(≥1%)条件4(加分项):反弹时成交量放大(量比≥1.3)
用图来表示:
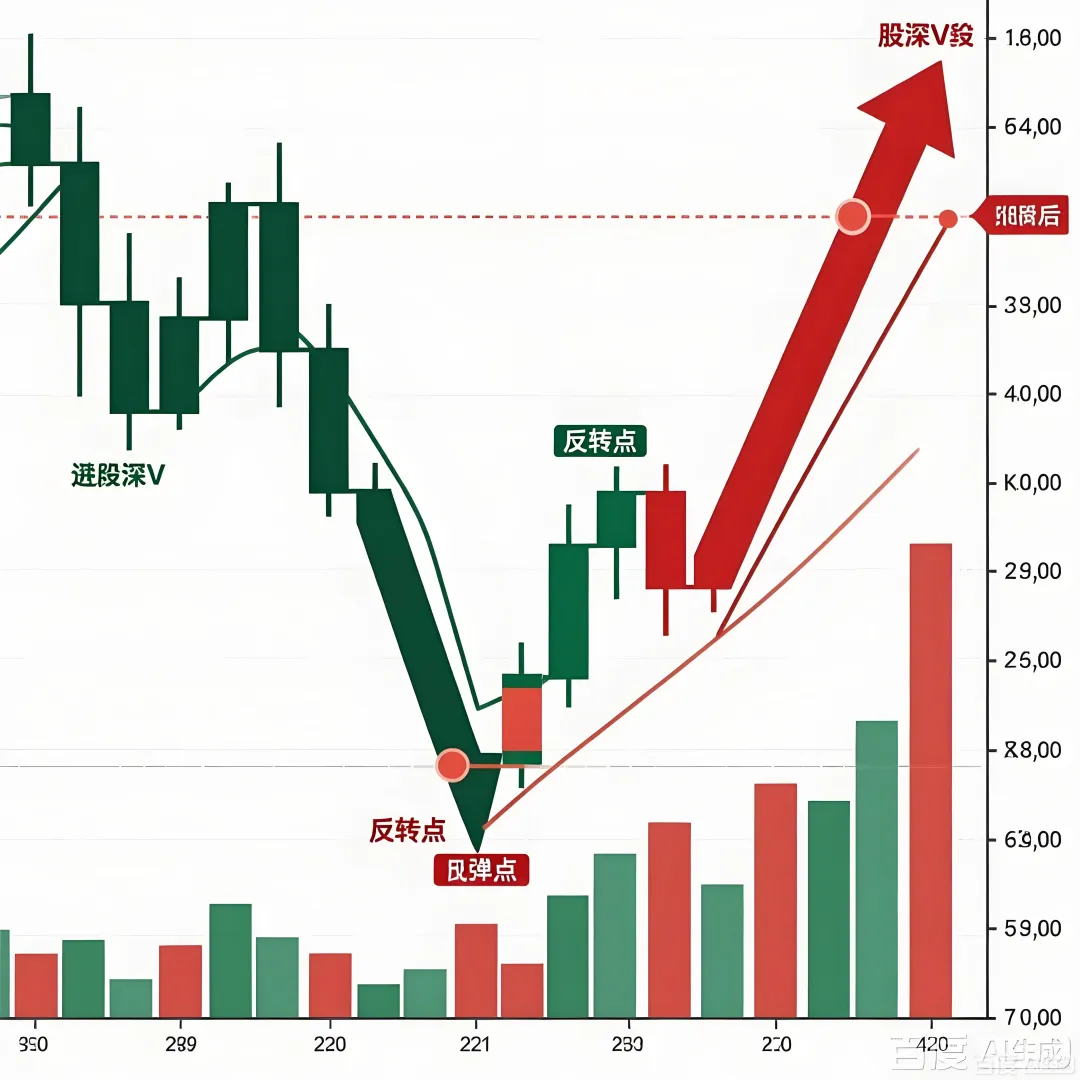
↑ ↑ 下跌段 反弹段
3. 系统架构设计
整个系统分为5个核心模块:
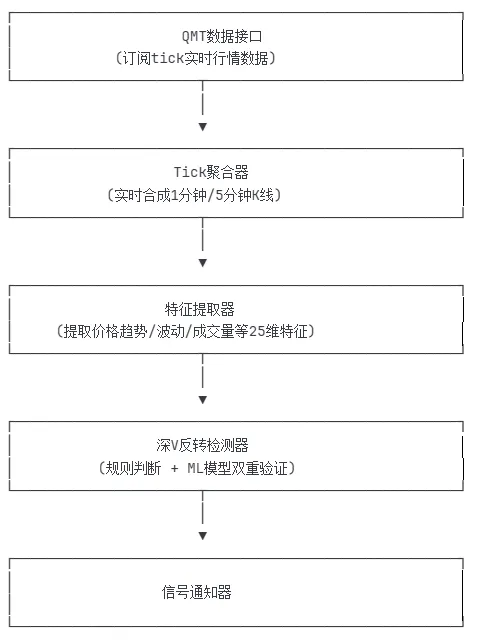
4. 核心代码实现
4.1 Tick数据聚合成K线
QMT推送的是逐笔tick数据,我们需要把它聚合成K线:
class TickAggregator:"""Tick数据聚合器:将tick合成K线"""def __init__(self, period_minutes: int = 1):self.period = period_minutesself.current_bars = {} # 当前未完成的K线self.completed_bars = defaultdict(list) # 已完成的K线def update(self, tick: TickData) -> Optional[KLineBar]:"""更新tick数据,返回完成的K线"""code = tick.stock_codebar_time = self._get_bar_time(tick.timestamp)if code not in self.current_bars:# 创建新K线self.current_bars[code] = KLineBar(stock_code=code,datetime=bar_time,open=tick.price,high=tick.price,low=tick.price,close=tick.price,volume=tick.volume)return Nonecurrent_bar = self.current_bars[code]# 检查是否进入新周期if bar_time > current_bar.datetime:# 保存已完成的K线completed = current_barself.completed_bars[code].append(completed)# 创建新K线self.current_bars[code] = KLineBar(...)return completedelse:# 更新当前K线的OHLCcurrent_bar.high = max(current_bar.high, tick.price)current_bar.low = min(current_bar.low, tick.price)current_bar.close = tick.pricecurrent_bar.volume += tick.volumereturn None
4.2 深V特征提取
我设计了25维特征向量来描述K线形态:
def extract_features(self, df: pd.DataFrame) -> np.ndarray:"""提取深V特征向量"""close = df['close'].valuesvolume = df['volume'].valuesfeatures = []# ====== 价格趋势特征 ======# 整体涨跌幅total_return = (close[-1] - close[0]) / close[0]features.append(total_return)# 前半段、后半段收益(深V的核心:前跌后涨)mid = len(close) // 2first_half = (close[mid] - close[0]) / close[0] # 前半段second_half = (close[-1] - close[mid]) / close[mid] # 后半段features.extend([first_half, second_half])# 深V特征分数 = 后半段涨幅 - 前半段跌幅deep_v_score = second_half - first_halffeatures.append(deep_v_score) # 这个值越大,越像深V# ====== 极值特征 ======min_idx = np.argmin(close) # 最低点位置# 下跌幅度max_before = np.max(close[:min_idx+1])drop_pct = (max_before - close[min_idx]) / max_beforefeatures.append(drop_pct)# 反弹幅度max_after = np.max(close[min_idx:])rise_pct = (max_after - close[min_idx]) / close[min_idx]features.append(rise_pct)# ====== 成交量特征 ======# 反弹时是否放量vol_before = np.mean(volume[:min_idx])vol_after = np.mean(volume[min_idx:])vol_ratio = vol_after / vol_before # 量比features.append(vol_ratio)# ... 更多特征(共25维)return np.array(features)
4.3 实时检测逻辑
class RealtimeDeepVDetector:"""实时深V检测器"""def detect(self, stock_code: str, df: pd.DataFrame) -> Optional[Signal]:"""检测深V反转信号"""# 检查冷却期(避免重复发信号)if self._check_cooldown(stock_code):return Noneclose = df['close'].values[-self.window_size:]volume = df['volume'].values[-self.window_size:]# 找最低点min_idx = np.argmin(close)min_price = close[min_idx]# ===== 条件1:最低点位置合理 =====# 不能太靠前(没下跌空间),不能太靠后(没反弹确认)if not (0.3 < min_idx/len(close) < 0.85):return None# ===== 条件2:之前有明显下跌 =====max_before = np.max(close[:min_idx+1])drop_pct = (max_before - min_price) / max_beforeif drop_pct < 0.015: # 至少下跌1.5%return None# ===== 条件3:已有反弹 =====current_price = close[-1]rise_pct = (current_price - min_price) / min_priceif rise_pct < 0.01: # 至少反弹1%return None# ===== 条件4:计算信号概率 =====prob = 0.4prob += min(drop_pct / 0.03, 0.2) # 跌得越多,概率越高prob += min(rise_pct / 0.02, 0.2) # 弹得越多,概率越高# 放量加分vol_ratio = np.mean(volume[min_idx:]) / np.mean(volume[:min_idx])if vol_ratio > 1.3:prob += 0.15# ===== 触发信号 =====if prob >= self.signal_threshold:return Signal(stock_code=stock_code,probability=prob,price=current_price,message=f"下跌{drop_pct:.1%}, 反弹{rise_pct:.1%}, 量比{vol_ratio:.1f}")return None
5个特征通道的设计:
5. 使用指南
5.1 环境准备
# 1. 安装QMT客户端并登录# 2. 安装Python依赖pip install xtquant numpy pandas scikit-learn
5.2 启动监控
from qmt_deep_v_realtime import DeepVMonitor# 要监控的股票stocks = ['000001.SZ', # 平安银行'600519.SH', # 贵州茅台'300750.SZ', # 宁德时代]# 创建监控器monitor = DeepVMonitor(stock_codes=stocks,kline_period=1, # 1分钟K线window_size=20, # 观察窗口20根K线min_drop_pct=0.015, # 最小下跌1.5%min_rise_pct=0.01, # 最小反弹1%signal_threshold=0.55, # 信号阈值cooldown_seconds=180 # 同一股票3分钟内不重复报警)# 开启声音和弹窗提醒monitor.notifier.enable_sound = Truemonitor.notifier.enable_popup = True# 启动!monitor.start()
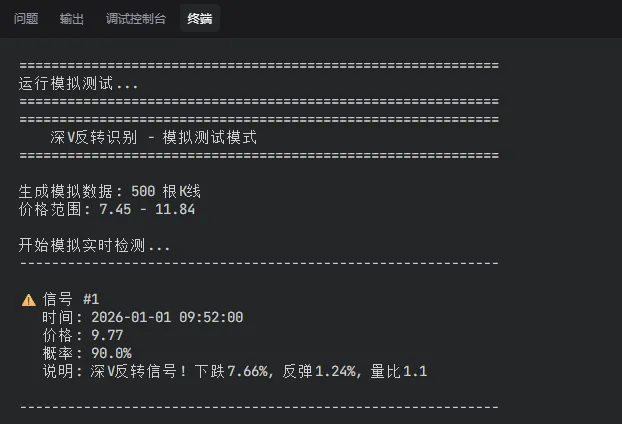
5.3 信号效果
运行后,当检测到深V反转时,会收到这样的提醒:
6. 参数调优建议
不同交易风格,参数设置不同:
几个实战经验:
- 波动大的股票
(如创业板、科创板),把 min_drop_pct调高到2%-3%,否则假信号太多 - 大盘股
(如银行、保险),可以把阈值调低到0.5,因为它们波动本来就小 - 快速行情时
建议用tick聚合K线( use_tick=True),比直接订阅K线更及时
写在最后
本系统只是辅助参考,不能作为唯一的投资依据。
深V反转不是100%有效,可能是"假突破" 建议结合大盘环境、板块热度、个股基本面综合判断 严格设置止损,控制仓位
免责声明: 本文所提及的算法,股票代码和数据均为测试数据,不构成任何具体的投资建议。市场有风险,投资需谨慎。请您基于自身的独立判断进行决策。
本次研究的Python源码已经放到星球了,需要的自取。近期有粉丝加入星球,但优惠券已过期,应粉丝要求,现发放新的优惠券给大家,请领取使用。
终极量化数据实验室星球,已经运行半年多,现对外开放,前50名成员可领取下方优惠券加入。
星球向您提供六大服务:python基础,数据分析,量化编程,策略实现,模拟回测指导,软件解决方案指导,代码和数据在星球全部开源。

往期文章精选
高胜率机会!一套完整的A股“跳空缺口回补”策略+附源码
高盛预警:中国股市赚钱逻辑彻底变了——量化视角下的投资范式转移

