使用 Python 和 Dash 构建一个圣诞老人追踪仪表盘—附完整代码!
- 2026-06-28 07:40:09
今天在网上看到一个很有意思的应用,用 Python 和 Dash 构建一个圣诞老人追踪仪表板,不仅可以巩固自己的技术经验,还能给你家的孩子展示一个环球旅行的圣诞老人。今天我将实现过程分享给你,包括完整代码实现。
Python 爱好者们 ——想在圣诞节给孩子们带来惊喜吗?平安夜启动这个圣诞老人追踪仪表盘,看看他们的眼睛会不会闪闪发光。它由 Python 和 Dash 构建,巧妙地利用国际空间站 (ISS) 的实时遥测数据,模拟圣诞老人的环球魔法之旅。
国际空间站就像那位和蔼可亲的老精灵一样,掠过地球的大片区域。它大约每90分钟绕地球一周,每次的飞行路线都略有不同,这意味着它最终会飞越大多数国家。不过需要注意的是:它的航线无法到达极北地区——所以如果你身处挪威、瑞典或阿拉斯加,最好还是对这部分内容保密,除非你准备好回答孩子们提出的各种棘手问题。
我稍后会向你展示如何使用该程序。首先,我们来回顾一下它的功能。
仪表盘功能
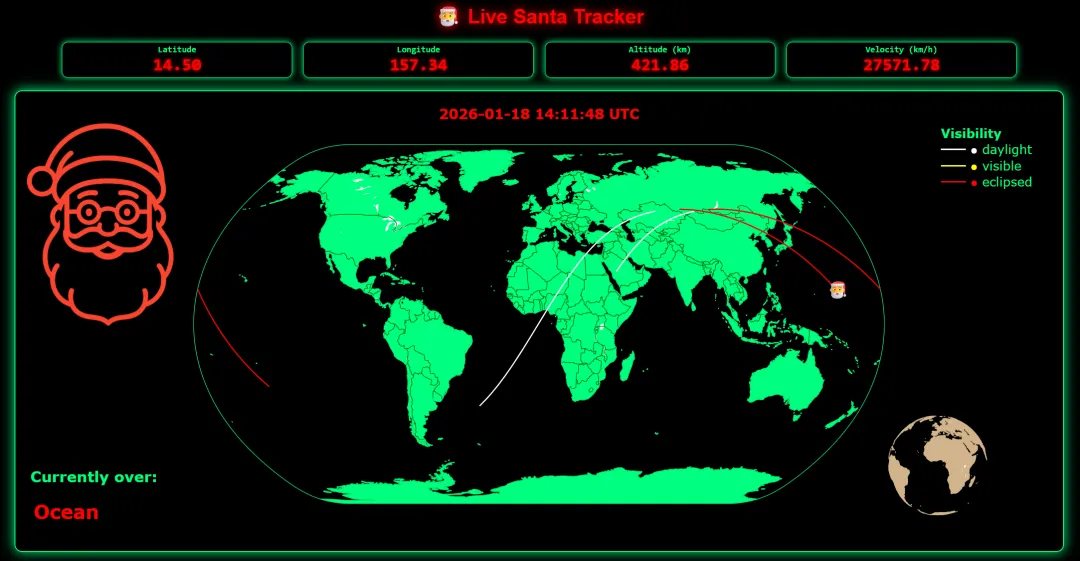
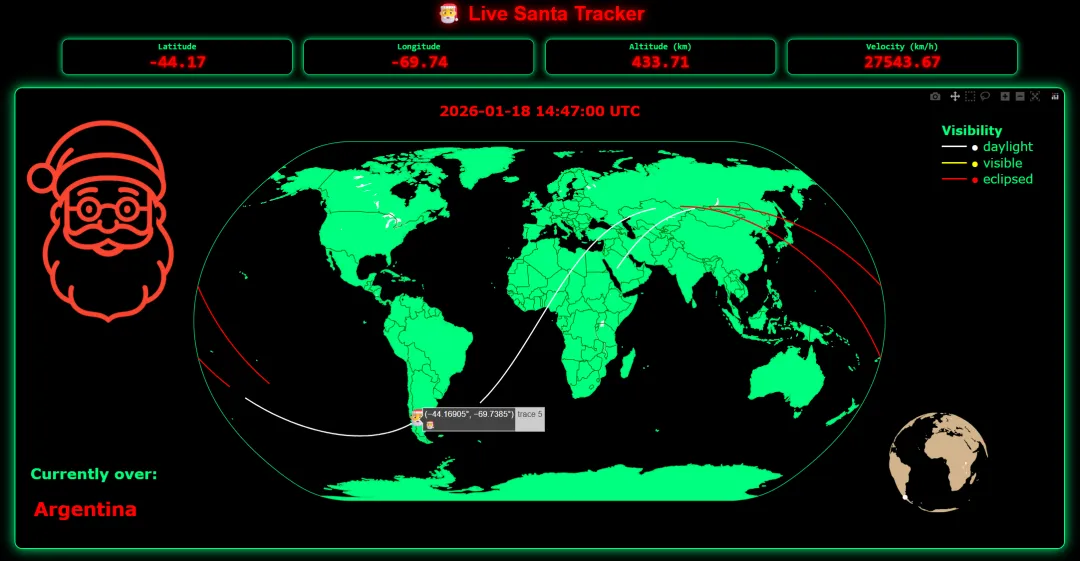
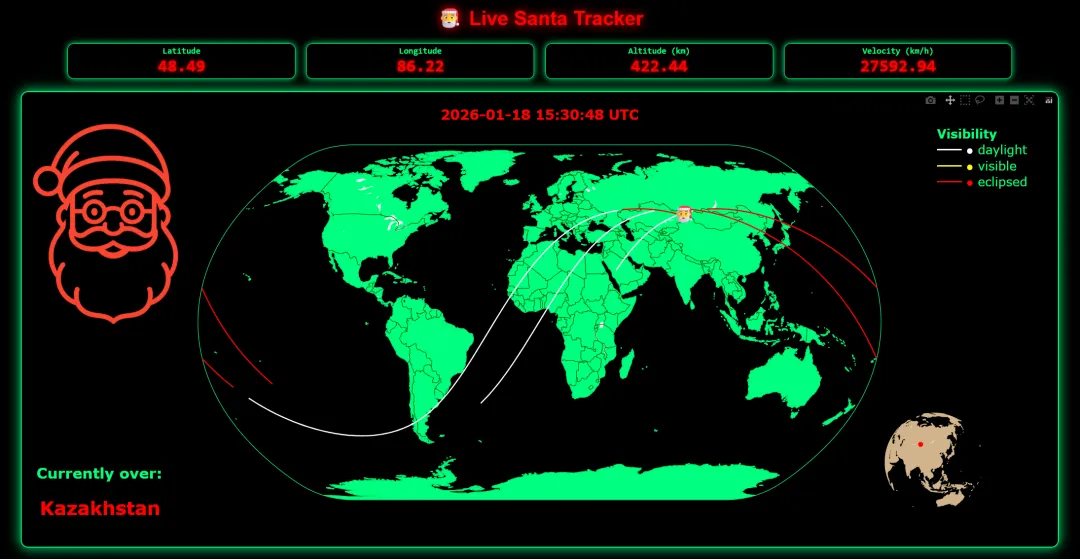
仪表盘会实时显示圣诞老人(其实是国际空间站)的当前纬度、经度、高度和速度。它还会显示他是在白天翱翔、在夜空中疾驰(显示为“日食”),还是在神奇的暮光中滑翔(显示为“可见”)。你还会看到他当前飞越的国家,以及一个可以用光标旋转的迷你地球仪——非常适合追踪圣诞老人的环球旅行。
所有视觉效果均由 Plotly 图形库驱动,它通过诸如圣诞老人头像标记、悬停细节、主世界地图的缩放控制以及可旋转的 3D 地球仪等互动功能,让体验更加生动有趣。这巧妙地融合了节日奇思妙想和 Python 技术,令人惊喜。
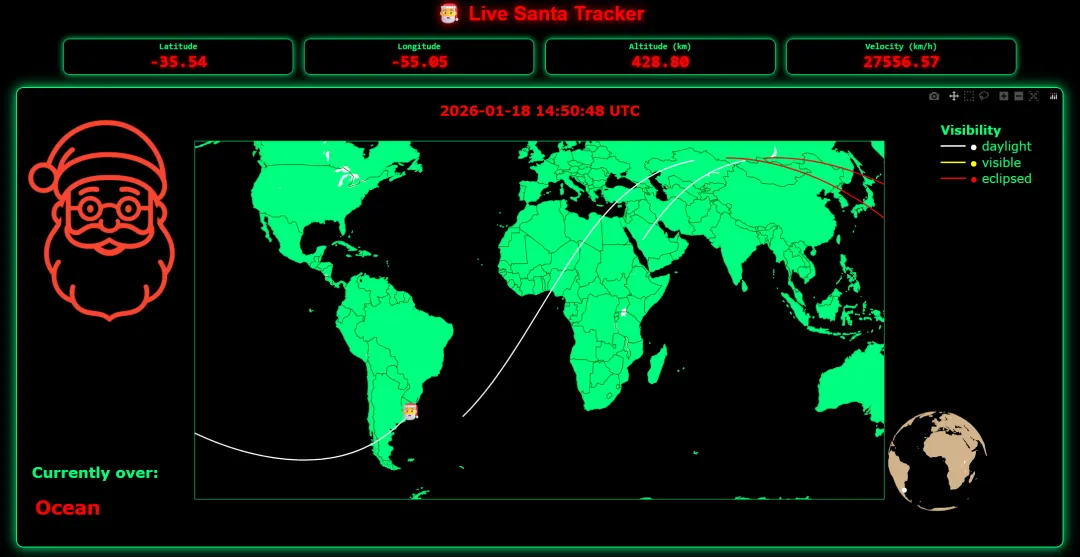

注意: 你对主地图或地球仪所做的任何更改都会在仪表板每十秒钟刷新一次时重置。
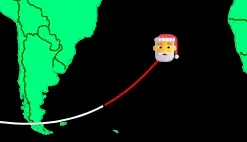
这条描绘圣诞老人行进路线的线代表了他随时间推移的地面轨迹 。由于我们将一个球体绘制到二维地图上,这条圆形路径会呈现为一个 S 形正弦曲线 。
由于追踪器会显示圣诞老人当前所在的国家/地区名称,因此可以提高孩子的地理知识。真是个意外之喜!
如果以上任何一点让你心动,请继续阅读,了解如何在自己的计算机上运行仪表板。
代码
from datetime import datetimeimport base64from collections import dequeimport requestsimport pandas as pdimport pycountryfrom dash import Dash, dcc, html, Input, Output, Statefrom dash.exceptions import PreventUpdateimport plotly.graph_objects as go# --- Environment Setup (Cleaned) ---# Load Santa face image:# Ensure 'santa_face_400pct.png' is in the same directory as this script.encoded_image = ""try: with open("santa_face_400pct.png", "rb") as f: encoded_image = base64.b64encode(f.read()).decode()except FileNotFoundError: print("Warning: santa_face_400pct.png not found. Image will not display.")# Constants:ISS_URL = "https://api.wheretheiss.at/v1/satellites/25544"color_map = {"daylight": "white", "visible": "#FFFF00", "eclipsed": "red"}MAX_POINTS = 1080 # Keeps only the most recent 1080 track points (approx. 2 orbits)TRACK_LAT = deque(maxlen=MAX_POINTS)TRACK_LON = deque(maxlen=MAX_POINTS)TRACK_VIS = deque(maxlen=MAX_POINTS)# --- Utility Functions ---def get_iss_telemetry(url=ISS_URL): """Fetches current ISS telemetry data from the API.""" try: resp = requests.get(url, timeout=10) resp.raise_for_status() data = resp.json() df = pd.DataFrame([data]) # Drop unnecessary columns df.drop(["id", "footprint", "daynum", "solar_lat", "solar_lon"], errors="ignore", axis=1, inplace=True) return df except (requests.Timeout, requests.ConnectionError) as e: print(f"⚠️ Network issue: {e}") except requests.HTTPError as e: print(f"⚠️ API returned {resp.status_code}: {e}") return Nonedef split_segments(df): """Splits the track DataFrame into segments based on visibility type.""" if df.empty: return [] segments, start = [], 0 for i in range(1, len(df)): if df["vis"].iloc[i] != df["vis"].iloc[i-1]: segments.append(df.iloc[start:i]) start = i segments.append(df.iloc[start:]) return segments# --- Dash Application Setup ---app = Dash(__name__)app.title = "Live Santa Tracker"# Styles for readouts (kept as is for functional styling)readout_style = { "border": "1px solid #00ff7f", "backgroundColor": "black", "color": "red", "padding": "4px 6px", "borderRadius": "10px", "width": "18%", "boxShadow": "0 0 10px #00ff7f", "textAlign": "center", "fontFamily": "Consolas, monospace", "lineHeight": "1.1",}value_style = { "fontSize": "28px", "fontWeight": "bold", "color": "red", "textShadow": "0 0 6px #FF0000", "margin": "0",}label_style = {"fontSize": "14px", "margin": "0 0 2px 0", "color": "#00ff7f"}app.layout = html.Div( style={ "fontFamily": "Orbitron, Arial, sans-serif", "backgroundColor": "black", "color": "#00ff7f", "minHeight": "100vh", "padding": "20px", }, children=[ html.H1( "🎅 Live Santa Tracker", style={"textAlign": "center", "color": "#FF0000", "textShadow": "0 0 15px #FF0000"}), html.Div( style={ "display": "flex", "justifyContent": "center", "gap": "18px", "flexWrap": "wrap", "margin": "20px 0" }, children=[ html.Div([html.H4("Latitude", style=label_style), html.P(id="lat-box", style=value_style)], style=readout_style), html.Div([html.H4("Longitude", style=label_style), html.P(id="lon-box", style=value_style)], style=readout_style), html.Div([html.H4("Altitude (km)", style=label_style), html.P(id="alt-box", style=value_style)], style=readout_style), html.Div([html.H4("Velocity (km/h)", style=label_style), html.P(id="vel-box", style=value_style)], style=readout_style)], ), dcc.Graph( id="iss-map", style={ "border": "2px solid #00ff7f", "borderRadius": "12px", "boxShadow": "0 0 20px #00ff7f", "height": "75vh", "width": "85%", "margin": "0 auto", }, ), # dcc.Store is used for maintaining the track history between updates dcc.Store(id="track-store", data={"lat": [], "lon": [], "vis": []}), # Interval set to 10 seconds (10 * 1000 ms) dcc.Interval(id="interval", interval=10 * 1000, n_intervals=0), ],)# --- Callback for Updating Map and Readouts ---@app.callback( [ Output("iss-map", "figure"), Output("lat-box", "children"), Output("lon-box", "children"), Output("alt-box", "children"), Output("vel-box", "children"), Output("track-store", "data"), ], Input("interval", "n_intervals"), State("track-store", "data"))def update_map(_, track_data): """Fetches new data, updates track, and generates the map figure.""" df = get_iss_telemetry() if df is None: raise PreventUpdate lat = float(df["latitude"].iloc[0]) lon = float(df["longitude"].iloc[0]) alt = float(df["altitude"].iloc[0]) vel = float(df["velocity"].iloc[0]) vis = df["visibility"].iloc[0] current_time = datetime.utcnow().strftime("%Y-%m-%d %H:%M:%S UTC") # Country lookup country_name, country_color = "Ocean", "red" try: coord_url = f"https://api.wheretheiss.at/v1/coordinates/{lat},{lon}" resp2 = requests.get(coord_url, timeout=6) resp2.raise_for_status() cdata = resp2.json() code = cdata.get("country_code") if code and code != "??": match = pycountry.countries.get(alpha_2=code.upper()) country_name = match.name if match else code country_color = "red" except requests.RequestException: pass # Silently fail on API or network errors # Append into server-side deques (these enforce MAX_POINTS automatically) # The initial check for track_data being None is no longer strictly needed # since the deques are global and the dcc.Store data is now only used # for return compatibility. TRACK_LAT.append(lat) TRACK_LON.append(lon) TRACK_VIS.append(vis) # Build the dataframe from the deques (already trimmed) track_df = pd.DataFrame({ "lat": list(TRACK_LAT), "lon": list(TRACK_LON), "vis": list(TRACK_VIS) }) # Prepare data for dcc.Store update track_data = {"lat": list(TRACK_LAT), "lon": list(TRACK_LON), "vis": list(TRACK_VIS)} fig = go.Figure() # Main map track for seg in split_segments(track_df): vtype = seg["vis"].iloc[0] if vtype in color_map: fig.add_trace(go.Scattergeo( lat=seg["lat"], lon=seg["lon"], mode="lines", line=dict(width=2, color=color_map[vtype]), showlegend=False, geo="geo" )) # Current ISS marker (MAIN map) — synchronized color current_color = color_map.get(vis, "#FFFFFF") fig.add_trace(go.Scattergeo( lat=[lat], lon=[lon], mode="text", text=["🎅"], textfont=dict(size=28), # adjust size as needed showlegend=False, geo="geo" )) # Inset globe marker — uses the SAME color variable fig.add_trace(go.Scattergeo( lat=[lat], lon=[lon], mode="markers", marker=dict(size=8, color=current_color), showlegend=False, geo="geo2" )) legend_html = ( "<b>Visibility</b><br>" f"<span style='color:{color_map['daylight']}'>━━ ●</span> daylight<br>" f"<span style='color:{color_map['visible']}'>━━ ●</span> visible<br>" f"<span style='color:{color_map['eclipsed']}'>━━ ●</span> eclipsed" ) fig.update_layout( images=[dict( source=f"data:image/png;base64,{encoded_image}", xref="paper", yref="paper", x=-0.01, y=0.99, sizex=0.50, sizey=0.50, xanchor="left", yanchor="top", layer="above" )], annotations=[ dict(text="<b>Currently over:</b>", x=-0.005, y=0.11, xref="paper", yref="paper", showarrow=False, font=dict(size=24, color="#00ff7f"), bgcolor="rgba(0,0,0,1)", borderpad=1), dict(text=f"<b>{country_name}</b>", x=-0.005, y=0.01, xref="paper", yref="paper", showarrow=False, font=dict(size=30, color="red"), bgcolor="rgba(0,0,0,0)", borderpad=6), dict(text=f"<b>{current_time}</b>", x=0.5, y=1.03, xref="paper", yref="paper", showarrow=False, font=dict(size=22, color="red")), dict(text=legend_html, x=0.99, y=0.98, xref="paper", yref="paper", showarrow=False, align="left", font=dict(size=20, color="springgreen")), ], paper_bgcolor="rgba(0,0,0,0)", plot_bgcolor="black", margin=dict(l=30, r=30, t=40, b=30), geo=dict( domain=dict(x=[0.068, 0.932], y=[0.068, 0.932]), projection_type="natural earth", showland=True, landcolor="#00ff7f", showcountries=True, countrycolor="darkgreen", showcoastlines=True, coastlinecolor="#00ff7f", bgcolor="black", showframe=True, framecolor="#00ff7f", ), geo2=dict( domain=dict(x=[0.79, 1.0], y=[0.04, 0.28]), showland=True, landcolor="tan", showcountries=False, showcoastlines=True, coastlinecolor="tan", projection_type="orthographic", bgcolor='black', showframe=False ) ) # Return values for the six Outputs return (fig, f"{lat:.2f}", f"{lon:.2f}", f"{alt:.2f}", f"{vel:.2f}", track_data)if __name__ == "__main__": # Standard way to run a Dash application from a command line app.run(debug=True)为了让程序成功运行,请按照以下步骤操作:
santa_dash.py),将上述代码复制并粘贴到该文件中。pip install pandas pycountry dash plotlysanta_face_400pct.png。 将其保存在与 Python 脚本相同的文件夹中。
python santa_dash.py,如下所示:
长时间运行代码时,请确保禁用睡眠模式和屏幕保护程序等设置。
Thanks for your reading!
Enjoying coding, my friends! 🧑💻🧑💻🧑💻💯💯💯
推荐阅读👇👇👇
🌟 如果你觉得这篇文章对你有帮助,并且愿意支持我的话,你可以: 🌟
• 👍 点赞,让文章获得系统推荐 • ⤴️ 分享,把内容传递给身边的伙伴 • ❤️ 推荐,让文章影响到更多人 • 👏 欢迎留言交流,一起拓展技术的边界

👇👇👇 Follow me,获取更多高质量干货分享,我们下期再见!
随机文章
-
 10个月宝宝每天需要喝多少奶粉?
- 【干货】Python手撸几行代码,轻松实现一个" 进度条 "!
- 【元旦文艺汇演系列专访】舞台背后,代码与光影之间|专访青岛五十八中学生会信息技术部
- 零基础学Python教程大全
- window更新系统或备份系统时,错误代码0x80070002是什么意思?
- 你绝对没见过的船新版本,利用Python代码制作过年春联.
- 一周生成300万行代码,AI从零造出浏览器!人类程序员未来只做架构?
- 又一个好用的python爬虫库!
- 低代码狂欢背后:国产ERP厂商正在集体自废武功?
- 【元旦文艺汇演系列专访】舞台背后,代码与光影之间|专访青岛五十八中学生会信息技术部
- 家有学编程的孩子,作为家长,这一点你一定要知道!
