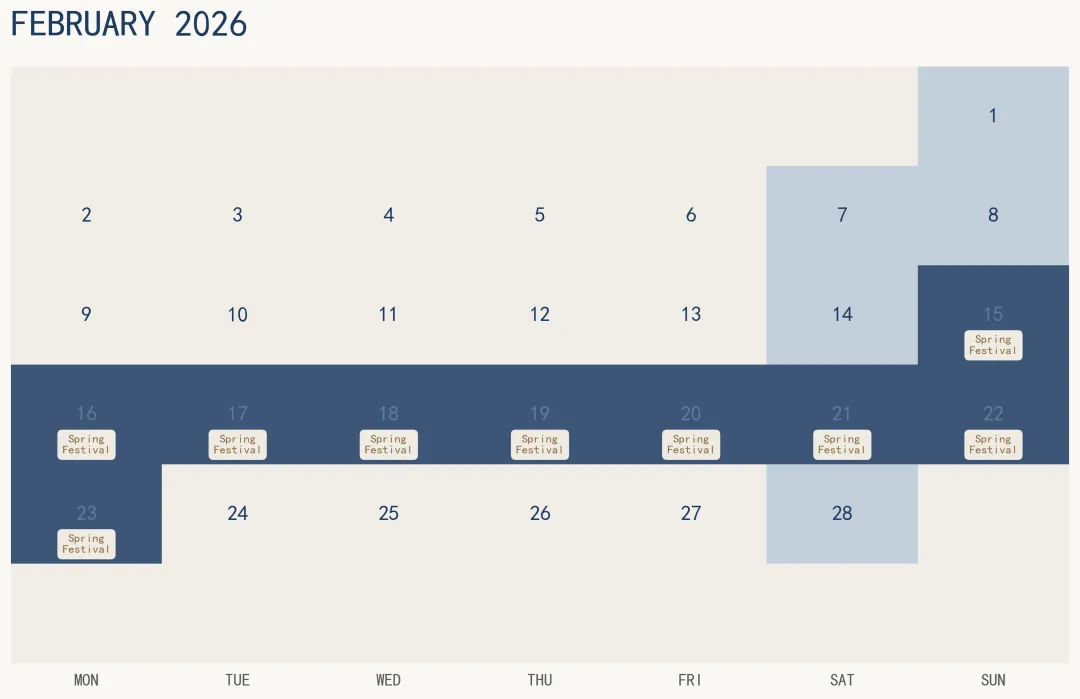
import matplotlib.pyplot as pltimport numpy as npfrom datetime import datetime, timedeltaplt.rcParams['font.sans-serif'] = ['SimHei'] # 设置为黑体def plot_month_heatmap(year, month, custom_holidays=None, title=None): """ 生成指定月份的假期热力图 参数: year: 年份 (int) month: 月份 (1-12) custom_holidays: 自定义节假日列表,格式 [(day, "名称"), ...] title: 自定义标题 (可选) """ # 默认节假日(可被custom_holidays覆盖) if custom_holidays is None: custom_holidays = [] # 创建日期矩阵 (6周×7天) first_day = datetime(year, month, 1) start_offset = first_day.weekday() # Monday=0, Sunday=6 days_in_month = (datetime(year, month + 1, 1) - timedelta(days=1)).day if month < 12 else 31 # 初始化矩阵: 0=工作日, 0.4=周末, 0.9=节假日 calendar = np.zeros((6, 7)) day_labels = np.full((6, 7), "", dtype=object) holiday_labels = {} # 填充日期和类型 for day in range(1, days_in_month + 1): date = datetime(year, month, day) pos = start_offset + day - 1 row, col = divmod(pos, 7) day_labels[row, col] = str(day) calendar[row, col] = 0.4 if date.weekday() >= 5 else 0.0 # 周末标记 # 标记自定义节假日 for day, name in custom_holidays: if 1 <= day <= days_in_month: pos = start_offset + day - 1 row, col = divmod(pos, 7) calendar[row, col] = 0.9 holiday_labels[(row, col)] = name # 创建图形 fig, ax = plt.subplots(figsize=(10, 6.5), dpi=120) fig.patch.set_facecolor('#FAF8F5') # 高级配色:灰白→浅灰蓝→深海军蓝 cmap = plt.cm.colors.LinearSegmentedColormap.from_list( "elegant", ['#F0EDE8', '#B8C8D9', '#1E3A5F'] ) ax.imshow(calendar, cmap=cmap, aspect='auto', vmin=0, vmax=1) # 绘制日期数字 for i in range(6): for j in range(7): if day_labels[i, j]: color = '#1E3A5F' if calendar[i, j] < 0.5 else '#5A7B9E' ax.text(j, i, day_labels[i, j], ha='center', va='center', fontsize=14, color=color, fontweight='medium') # 标注节假日名称 for (row, col), name in holiday_labels.items(): ax.text(col, row + 0.2, name, ha='center', va='top', fontsize=8, color='#8B6B42', fontweight='bold', bbox=dict(boxstyle='round,pad=0.4', facecolor='#F9F4E9', edgecolor='none', alpha=0.95)) # 设置坐标轴 weekdays = ['MON', 'TUE', 'WED', 'THU', 'FRI', 'SAT', 'SUN'] ax.set_xticks(range(7)) ax.set_xticklabels(weekdays, fontsize=11, color='#5A5A5A', fontweight='medium') ax.set_yticks([]) # 标题 month_name = first_day.strftime('%B').upper() ax.set_title(title or f'{month_name}{year}', fontsize=24, fontweight='light', color='#1E3A5F', pad=20, loc='left') # 美化 ax.set_xlim(-0.5, 6.5) ax.set_ylim(5.5, -0.5) for spine in ax.spines.values(): spine.set_visible(False) ax.tick_params(left=False, bottom=False) plt.tight_layout() plt.savefig(f'{year}_{month:02d}_heatmap.png', dpi=300, bbox_inches='tight', facecolor=fig.get_facecolor()) plt.show()# ============ 使用示例 ============# 示例1:2026年2月(含春节)plot_month_heatmap( year=2026, month=2, custom_holidays=[ (15, "Spring\nFestival"), (16, "Spring\nFestival"), (17, "Spring\nFestival"), (18, "Spring\nFestival"), (19, "Spring\nFestival"), (20, "Spring\nFestival"), (21, "Spring\nFestival"), (22, "Spring\nFestival"), (23, "Spring\nFestival") ], title="FEBRUARY 2026")
 10个月宝宝每天需要喝多少奶粉?