Python项目96:模拟电商销售数据大屏可视化(dash+plotly+pandas)
- 2026-07-04 07:22:29


Python,速成心法
敲代码,查资料,问Ai
练习,探索,总结,优化

★★★★★博文创作不易,我的博文不需要打赏,也不需要知识付费,可以白嫖学习编程小技巧。使用代码的过程中,如有疑问的地方,欢迎大家指正留言交流。喜欢的老铁可以多多点赞+收藏分享+置顶,小红牛在此表示感谢。★★★★★
------★Python练手项目源码★------
Python项目94:全球疫情模拟数据可视化大屏(dash+plotly+pandas)
Python项目91:绘制红楼梦人物关系图(NetworkX+Matplotlib)
Python项目89:NetworkX最短路径规划(城市交通)
Python项目88:文件备份与压缩系统2.0(tkinter+shutil+zipfile)
Python项目86:增强版画板2.0(tk.Canvas)
Python项目81:Excel工作表批量重命名工具1.0(tkinter+openpyxl)
Python项目78:学生成绩分析系统(Tkinter+SQLite3)
Python项目77:模拟炒股训练系统3.0(Mplfinance+tkinter)
Python项目76:员工排班表系统1.0(tkinter+sqlite3+tkcalendar)
Python项目74:多线程数据可视化工具2.0(tkinter+matplotlib+mplcursors)
Python项目73:自动化文件备份系统1.0(tkinter)
Python项目源码71:药品管理系统1.0(tkinter+sqlite3)
Python项目源码69:Excel数据筛选器1.0(tkinter+sqlite3+pandas)
Python项目源码63:病历管理系统1.0(tkinter+sqlite3+matplotlib)
Python源码62:酒店住房管理系统1.0(tkinter+sqlite3)
Python项目源码57:数据格式转换工具1.0(csv+json+excel+sqlite3)
Python项目源码56:食堂饭卡管理系统1.0(tkinter+splite3)
Python项目源码54:员工信息管理系统2.0(tkinter+sqlite3)
Python项目源码52:模拟银行卡系统1.0(账户管理、存款、取款、转账和交易记录查询)
Python项目源码50:理发店会员管理系统1.0(tkinter+sqlite3)
Python项目源码48:正则表达式调试工具3.0(tkinter+re+requests)
Python项目源码44:图书管理系统1.0(tkinter+sqlite3)
Python项目源码42:仓库商品管理系统1.0(tkinter+sqlite3+Excel)
Python项目源码40:字符串处理工具(tkinter+入门练习)
Python项目源码39:学生积分管理系统1.0(命令行界面+Json)
Python项目源码35:音乐播放器2.0(Tkinter+mutagen)
Python项目源码33:待办事项列表应用2.0(命令行界面+Json+类)
Python项目32:订单销售额管理系统1.0(Tkinter+CSV)
Python项目源码29:学生缴费管理系统(Tkinter+CSV)
Python项目28:设计日志管理系统2.0(Tkinter+Json)
1.安装依赖
pip install dash pandas plotly numpy dash-bootstrap-components运行py代码后,在浏览器中访问:http://localhost:8050
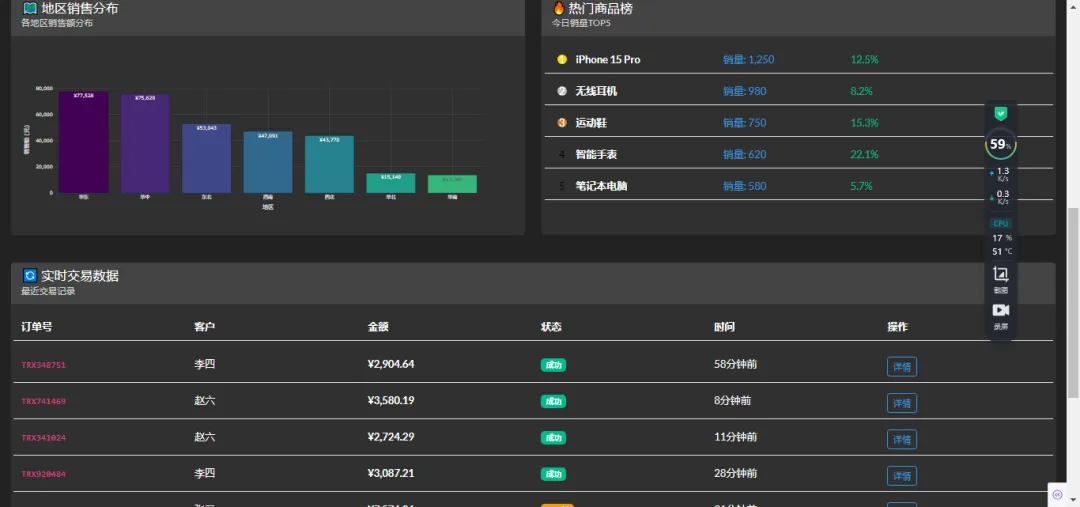
2.功能特点📊 核心功能:实时KPI监控:销售额、订单量、访客数、转化率,销售趋势分析:24小时销售趋势图(双Y轴),品类分布:环形饼图显示各品类销售占比,地理分布:柱状图显示各地区销售情况,商品排行榜:实时热门商品销售排名,交易流水:实时交易记录表格⚡
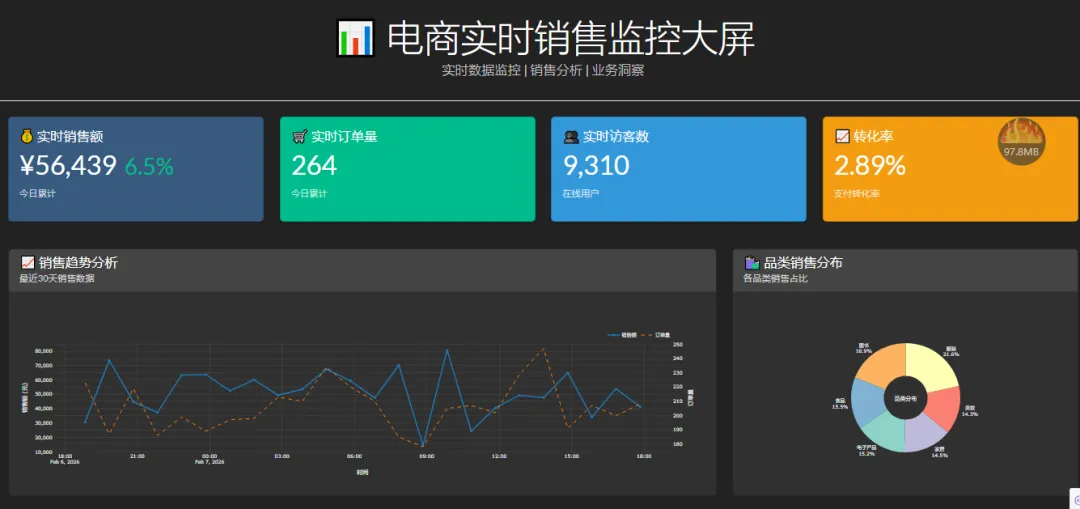
3.技术特性:实时更新:每10秒自动刷新数据,响应式设计:适配不同屏幕尺寸,暗色主题:适合大屏展示,交互式图表:支持鼠标悬停查看详情,模拟数据:使用随机数据模拟实时数据流🎨
4. UI组件:Bootstrap卡片布局,Plotly交互式图表,彩色指标卡片,实时状态指示器,操作按钮组。
↓ 完整源码如下 ↓
# -*- coding: utf-8 -*-# @Author : 小红牛# 微信公众号:wdPythonimport dashfrom dash import dcc, html, Input, Output, State, callbackimport dash_bootstrap_components as dbcimport plotly.graph_objects as goimport plotly.express as pximport pandas as pdimport numpy as npfrom datetime import datetime, timedeltaimport time# 初始化Dash应用app = dash.Dash(__name__,external_stylesheets=[dbc.themes.DARKLY],meta_tags=[{"name": "viewport", "content": "width=device-width, initial-scale=1"}])app.title = "电商实时销售监控大屏"# 生成模拟数据函数def generate_mock_data():"""生成模拟的电商销售数据"""np.random.seed(42)# 生成时间序列数据end_time = datetime.now()start_time = end_time - timedelta(days=30)date_range = pd.date_range(start=start_time, end=end_time, freq='H')data = {'timestamp': date_range,'sales': np.random.normal(50000, 15000, len(date_range)).clip(10000, 100000),'orders': np.random.poisson(200, len(date_range)).clip(50, 500),'visitors': np.random.normal(10000, 3000, len(date_range)).clip(2000, 20000),'conversion_rate': np.random.beta(5, 95, len(date_range)) * 100,'avg_order_value': np.random.normal(250, 50, len(date_range)).clip(100, 500)}return pd.DataFrame(data)def generate_realtime_data():"""生成实时数据"""current_time = datetime.now()# 实时指标realtime_metrics = {'current_sales': np.random.normal(60000, 10000),'current_orders': np.random.poisson(250),'current_visitors': np.random.normal(12000, 2000),'current_conversion': np.random.beta(5, 95) * 100,'hourly_sales_growth': np.random.uniform(-5, 10)}# 产品类别销售数据categories = ['电子产品', '服装', '家居', '美妆', '食品', '图书']category_sales = {cat: np.random.uniform(5000, 30000) for cat in categories}# 地理分布数据regions = ['华东', '华北', '华南', '华中', '西南', '东北', '西北']region_sales = {reg: np.random.uniform(10000, 80000) for reg in regions}# 热门商品products = [{'name': 'iPhone 15 Pro', 'sales': 1250, 'growth': 12.5},{'name': '无线耳机', 'sales': 980, 'growth': 8.2},{'name': '运动鞋', 'sales': 750, 'growth': 15.3},{'name': '智能手表', 'sales': 620, 'growth': 22.1},{'name': '笔记本电脑', 'sales': 580, 'growth': 5.7},]return {'timestamp': current_time,'metrics': realtime_metrics,'categories': category_sales,'regions': region_sales,'products': products}# 初始化数据df = generate_mock_data()realtime_data = generate_realtime_data()# 应用布局app.layout = dbc.Container([# 标题栏dbc.Row([dbc.Col([html.Div([html.H1("📊 电商实时销售监控大屏", className="display-4 mb-0"),html.P("实时数据监控 | 销售分析 | 业务洞察",className="lead text-muted")], className="text-center")], width=12)], className="mb-4 py-3 border-bottom"),# KPI指标卡片dbc.Row([dbc.Col([dbc.Card([dbc.CardBody([html.H5("💰 实时销售额", className="card-title"),html.H2([f"¥{realtime_data['metrics']['current_sales']:,.0f}",html.Span([html.I(className="fas fa-arrow-up me-1"),f"{realtime_data['metrics']['hourly_sales_growth']:.1f}%"], className="text-success small ms-2")], className="card-text"),html.P("今日累计", className="text-muted small")])], className="shadow-sm", color="primary", inverse=True)], md=3, className="mb-3"),dbc.Col([dbc.Card([dbc.CardBody([html.H5("🛒 实时订单量", className="card-title"),html.H2(f"{realtime_data['metrics']['current_orders']:,.0f}",className="card-text"),html.P("今日累计", className="text-muted small")])], className="shadow-sm", color="success", inverse=True)], md=3, className="mb-3"),dbc.Col([dbc.Card([dbc.CardBody([html.H5("👥 实时访客数", className="card-title"),html.H2(f"{realtime_data['metrics']['current_visitors']:,.0f}",className="card-text"),html.P("在线用户", className="text-muted small")])], className="shadow-sm", color="info", inverse=True)], md=3, className="mb-3"),dbc.Col([dbc.Card([dbc.CardBody([html.H5("📈 转化率", className="card-title"),html.H2(f"{realtime_data['metrics']['current_conversion']:.2f}%",className="card-text"),html.P("支付转化率", className="text-muted small")])], className="shadow-sm", color="warning", inverse=True)], md=3, className="mb-3")], className="mb-4"),# 第一行图表dbc.Row([# 销售趋势图dbc.Col([dbc.Card([dbc.CardHeader([html.H5("📈 销售趋势分析", className="mb-0"),html.Small("最近30天销售数据", className="text-muted")]),dbc.CardBody([dcc.Graph(id='sales-trend-chart',config={'displayModeBar': False})])], className="shadow-sm h-100")], lg=8, className="mb-3"),# 品类销售占比dbc.Col([dbc.Card([dbc.CardHeader([html.H5("🛍️ 品类销售分布", className="mb-0"),html.Small("各品类销售占比", className="text-muted")]),dbc.CardBody([dcc.Graph(id='category-pie-chart',config={'displayModeBar': False})])], className="shadow-sm h-100")], lg=4, className="mb-3")], className="mb-4"),# 第二行图表dbc.Row([# 地理分布图dbc.Col([dbc.Card([dbc.CardHeader([html.H5("🗺️ 地区销售分布", className="mb-0"),html.Small("各地区销售额分布", className="text-muted")]),dbc.CardBody([dcc.Graph(id='region-bar-chart',config={'displayModeBar': False})])], className="shadow-sm h-100")], lg=6, className="mb-3"),# 热门商品排行榜dbc.Col([dbc.Card([dbc.CardHeader([html.H5("🔥 热门商品榜", className="mb-0"),html.Small("今日销量TOP5", className="text-muted")]),dbc.CardBody([html.Div(id='product-rank-list')])], className="shadow-sm h-100")], lg=6, className="mb-3")], className="mb-4"),# 第三行:实时数据表格和操作面板dbc.Row([dbc.Col([dbc.Card([dbc.CardHeader([html.H5("🔄 实时交易数据", className="mb-0"),html.Small("最近交易记录", className="text-muted")]),dbc.CardBody([html.Div(id='realtime-data-table'),dbc.Row([dbc.Col([html.Div([html.Small(f"最后更新时间: {datetime.now().strftime('%Y-%m-%d %H:%M:%S')}",className="text-muted"),dbc.Badge("实时更新中", color="success", className="ms-2")], className="mt-3")]),dbc.Col([dbc.ButtonGroup([dbc.Button("刷新数据", id="refresh-btn", color="primary", size="sm"),dbc.Button("导出报表", id="export-btn", color="secondary", size="sm"),dbc.Button("报警设置", id="alert-btn", color="warning", size="sm")], className="float-end")])])])], className="shadow-sm")], width=12, className="mb-3")]),# 隐藏的定时器组件dcc.Interval(id='interval-component',interval=10*1000, # 10秒更新一次n_intervals=0),# 存储数据dcc.Store(id='data-store'),# 页脚dbc.Row([dbc.Col([html.Hr(),html.P(["© 2023 电商数据监控平台 | ",html.Span("系统状态: ", className="text-muted"),dbc.Badge("正常", color="success", className="ms-1"),html.Span(" | 数据延迟: ", className="text-muted ms-3"),html.Span("<1s", className="text-success ms-1"),html.Span(" | 版本: v2.1.0", className="text-muted ms-3")], className="text-center small")], width=12)], className="mt-4")], fluid=True, className="p-3")# 创建销售趋势图@app.callback(Output('sales-trend-chart', 'figure'),Input('interval-component', 'n_intervals'))def update_sales_trend(n):# 生成一些新的数据点new_sales = np.random.normal(50000, 15000, 24).clip(10000, 100000)new_orders = np.random.poisson(200, 24).clip(50, 500)# 创建时间序列times = pd.date_range(end=datetime.now(), periods=24, freq='H')fig = go.Figure()# 销售额线fig.add_trace(go.Scatter(x=times,y=new_sales,mode='lines+markers',name='销售额',line=dict(color='#1f77b4', width=3),marker=dict(size=6)))# 订单量线(次坐标轴)fig.add_trace(go.Scatter(x=times,y=new_orders,mode='lines',name='订单量',yaxis='y2',line=dict(color='#ff7f0e', width=2, dash='dash')))fig.update_layout(template='plotly_dark',plot_bgcolor='rgba(0,0,0,0)',paper_bgcolor='rgba(0,0,0,0)',xaxis=dict(title='时间',gridcolor='rgba(255,255,255,0.1)'),yaxis=dict(title='销售额 (元)',gridcolor='rgba(255,255,255,0.1)',tickformat=',.0f'),yaxis2=dict(title='订单量',overlaying='y',side='right',gridcolor='rgba(255,255,255,0.1)'),legend=dict(orientation='h',yanchor='bottom',y=1.02,xanchor='right',x=1),hovermode='x unified')return fig# 创建品类饼图@app.callback(Output('category-pie-chart', 'figure'),Input('interval-component', 'n_intervals'))def update_category_pie(n):categories = list(realtime_data['categories'].keys())sales = list(realtime_data['categories'].values())colors = px.colors.qualitative.Set3fig = go.Figure(data=[go.Pie(labels=categories,values=sales,hole=.4,marker=dict(colors=colors),textinfo='percent+label',textposition='outside',hoverinfo='label+value+percent')])fig.update_layout(template='plotly_dark',plot_bgcolor='rgba(0,0,0,0)',paper_bgcolor='rgba(0,0,0,0)',showlegend=False,annotations=[dict(text='品类分布',x=0.5, y=0.5,font_size=14,showarrow=False)])return fig# 创建地区柱状图@app.callback(Output('region-bar-chart', 'figure'),Input('interval-component', 'n_intervals'))def update_region_chart(n):regions = list(realtime_data['regions'].keys())sales = list(realtime_data['regions'].values())# 按销售额排序sorted_data = sorted(zip(regions, sales), key=lambda x: x[1], reverse=True)regions = [x[0] for x in sorted_data]sales = [x[1] for x in sorted_data]fig = go.Figure(data=[go.Bar(x=regions,y=sales,marker_color=px.colors.sequential.Viridis,text=[f'¥{x:,.0f}' for x in sales],textposition='auto')])fig.update_layout(template='plotly_dark',plot_bgcolor='rgba(0,0,0,0)',paper_bgcolor='rgba(0,0,0,0)',xaxis=dict(title='地区',gridcolor='rgba(255,255,255,0.1)'),yaxis=dict(title='销售额 (元)',gridcolor='rgba(255,255,255,0.1)',tickformat=',.0f'))return fig# 更新商品排行榜@app.callback(Output('product-rank-list', 'children'),Input('interval-component', 'n_intervals'))def update_product_rank(n):products = realtime_data['products']rank_items = []for i, product in enumerate(products):rank_color = "#FFD700" if i == 0 else "#C0C0C0" if i == 1 else "#CD7F32" if i == 2 else "inherit"item = dbc.Row([dbc.Col([html.Div([html.Span(f"{i+1}",style={'display': 'inline-block','width': '24px','height': '24px','backgroundColor': rank_color,'color': 'white' if i < 3 else 'black','textAlign': 'center','borderRadius': '50%','lineHeight': '24px','marginRight': '10px'}),html.Strong(product['name'], className="ms-2")], className="d-flex align-items-center")], md=4),dbc.Col([html.Span(f"销量: {product['sales']:,}", className="text-info")], md=3),dbc.Col([html.Span([html.I(className="fas fa-arrow-up me-1"),f"{product['growth']}%"], className="text-success" if product['growth'] > 0 else "text-danger")], md=3)], className="mb-2 p-2 border-bottom")rank_items.append(item)return rank_items# 更新实时数据表格@app.callback(Output('realtime-data-table', 'children'),Input('interval-component', 'n_intervals'))def update_realtime_table(n):# 生成模拟的实时交易数据transactions = []for i in range(8):transaction_id = f"TRX{np.random.randint(100000, 999999)}"customer = np.random.choice(['张三', '李四', '王五', '赵六', '钱七'])amount = np.random.uniform(99, 9999)status = np.random.choice(['成功', '成功', '成功', '待支付'], p=[0.7, 0.1, 0.1, 0.1])status_color = "success" if status == '成功' else "warning"time_ago = f"{np.random.randint(1, 60)}分钟前"transaction = dbc.Row([dbc.Col([html.Code(transaction_id)], md=2),dbc.Col([customer], md=2),dbc.Col([html.Strong(f"¥{amount:,.2f}")], md=2),dbc.Col([dbc.Badge(status, color=status_color)], md=2),dbc.Col([time_ago], md=2),dbc.Col([dbc.Button("详情", size="sm", color="outline-info")], md=2)], className="mb-2 py-2 border-bottom")transactions.append(transaction)# 表头header = dbc.Row([dbc.Col([html.Strong("订单号")], md=2),dbc.Col([html.Strong("客户")], md=2),dbc.Col([html.Strong("金额")], md=2),dbc.Col([html.Strong("状态")], md=2),dbc.Col([html.Strong("时间")], md=2),dbc.Col([html.Strong("操作")], md=2)], className="mb-3 py-2 border-bottom fw-bold")return [header] + transactions# 主函数if __name__ == '__main__':app.run(debug=True, port=8050)
完毕!!感谢您的收看
------★★历史博文集合★★------

随机文章
-
 10个月宝宝每天需要喝多少奶粉?
- 《HM Python 进化论Vol.6》拒绝盲猜!用代码给模型做一次“全身体检”
- Python 10个测试开发常用脚本:提高你的工作效率!
- Python 3 入门与进阶(十五):Pythonic编程——编码规范、性能优化与最佳实践
- 中国电子学会&CCF GESP Python一级考点对比
- pydoll,一个流行的python库!
- 【案例教程】AI辅助Python-ArcGIS分析核心技术:从站点到区域的蒸散发与植被生产力估算实践应用
- 基于Python的养老社区的查询预约系统 计算机毕业设计选题 计算机毕设项目 前后端分离【源码-文档报告-代码讲解】
- 限时优惠最后1天|GEE Python版深度学习与全球尺度制图实战特训营
- 一天一个Python知识点——Day 152:TensorFlow基础
- Python爬虫自学2|自学神器-JuphterNotebook
