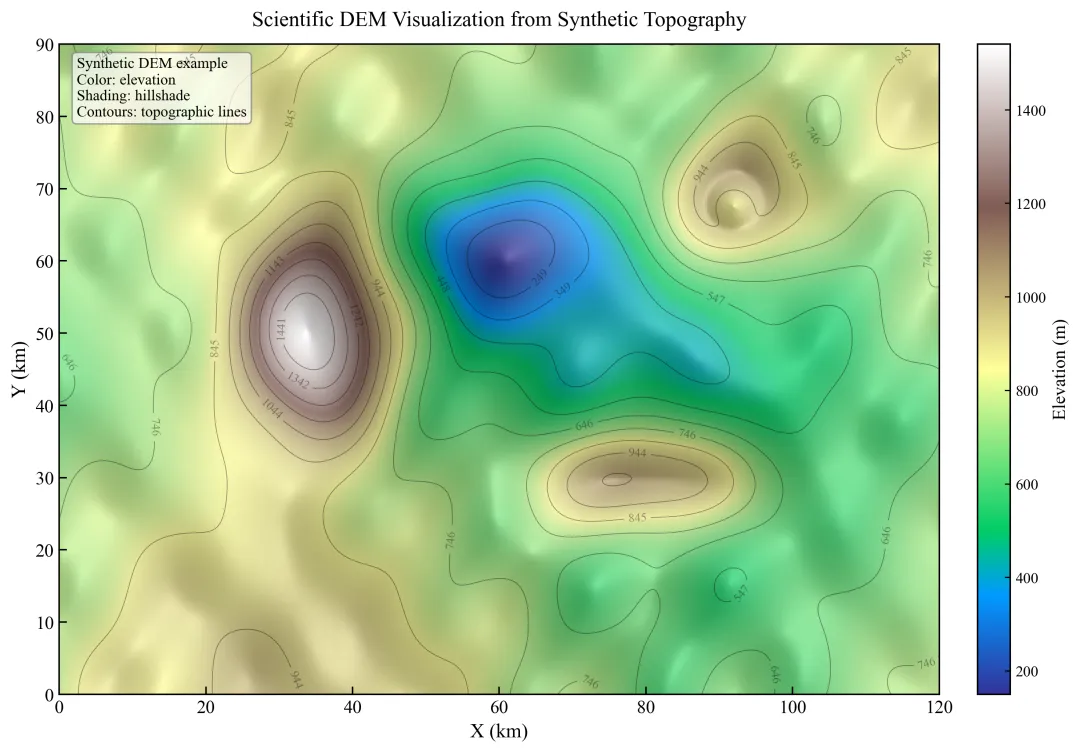
import numpy as npimport matplotlib.pyplot as pltfrom matplotlib.colors import LightSource# =========================# 1. 全局绘图参数# =========================plt.rcParams["font.family"] = "Times New Roman"plt.rcParams["font.size"] = 12plt.rcParams["axes.linewidth"] = 1.0OUT_FIG = "dem_scientific_map_fixed.png"# =========================# 2. 构造模拟 DEM# =========================nx, ny = 500, 400x = np.linspace(0, 120, nx)y = np.linspace(0, 90, ny)X, Y = np.meshgrid(x, y)# 长波背景起伏Z_bg = ( 120 * np.sin(X / 18.0) + 90 * np.cos(Y / 14.0) + 60 * np.sin((X + Y) / 25.0))# 山峰1Z_peak1 = 850 * np.exp(-(((X - 35) / 10) ** 2 + ((Y - 50) / 14) ** 2))# 山峰2Z_peak2 = 600 * np.exp(-(((X - 80) / 16) ** 2 + ((Y - 30) / 8) ** 2))# 火山锥/中央凹陷R = np.sqrt((X - 92) ** 2 + (Y - 68) ** 2)Z_volcano = 500 * np.exp(-(R / 9.5) ** 2) - 220 * np.exp(-(R / 3.0) ** 2)# 洼地Z_basin = -420 * np.exp(-(((X - 60) / 13) ** 2 + ((Y - 62) / 10) ** 2))# 小尺度扰动Z_small = ( 35 * np.sin(X / 3.5) * np.cos(Y / 4.2) + 20 * np.sin((2 * X - Y) / 5.5))# 合成总 DEMZ = Z_bg + Z_peak1 + Z_peak2 + Z_volcano + Z_basin + Z_small# 平移到正高程范围Z = Z - Z.min() + 150# =========================# 3. 计算 hillshade# =========================ls = LightSource(azdeg=315, altdeg=45)# 这里只生成灰度阴影,不直接带颜色hillshade = ls.hillshade(Z, vert_exag=1.2, dx=1, dy=1)# =========================# 4. 绘图# =========================fig, ax = plt.subplots(figsize=(10, 7), dpi=150)# 先画真实高程色带层,这个对象直接用于 colorbarim = ax.imshow( Z, extent=[x.min(), x.max(), y.min(), y.max()], origin="lower", cmap="terrain", aspect="auto")# 再叠加灰度 hillshade,增强立体感ax.imshow( hillshade, extent=[x.min(), x.max(), y.min(), y.max()], origin="lower", cmap="gray", alpha=0.28, aspect="auto")# 叠加等高线levels = np.linspace(np.nanmin(Z), np.nanmax(Z), 15)contours = ax.contour( X, Y, Z, levels=levels, colors="k", linewidths=0.55, alpha=0.38)# 等高线标注ax.clabel(contours, inline=True, fontsize=8, fmt="%.0f")# =========================# 5. 坐标轴设置# =========================ax.set_xlabel("X (km)", fontsize=13)ax.set_ylabel("Y (km)", fontsize=13)ax.set_title("Scientific DEM Visualization from Synthetic Topography", fontsize=14, pad=12)ax.tick_params(direction="in", length=5, width=1.0)# =========================# 6. colorbar(修正版)# =========================cbar = fig.colorbar(im, ax=ax, fraction=0.045, pad=0.04)cbar.set_label("Elevation (m)", fontsize=12)cbar.ax.tick_params(labelsize=10, direction="in")# =========================# 7. 图内说明框# =========================txt = ( "Synthetic DEM example\n" "Color: elevation\n" "Shading: hillshade\n" "Contours: topographic lines")ax.text( 0.02, 0.98, txt, transform=ax.transAxes, ha="left", va="top", fontsize=10, bbox=dict( boxstyle="round,pad=0.3", facecolor="white", alpha=0.70, edgecolor="gray" ))# =========================# 8. 输出# =========================plt.tight_layout()plt.savefig(OUT_FIG, dpi=300, bbox_inches="tight")plt.show()print(f"图像已保存:{OUT_FIG}")

 10个月宝宝每天需要喝多少奶粉?
