Python绘制变种饼图之花瓣玫瑰图(附数据和代码)
- 2026-06-28 17:10:18

©[悠悠智汇笔记] 版权所有
🙏请尊重劳动成果,守护每一份劳动心血;⚖️未经授权,不得以为任何方式转载、摘编或抄袭。🔄转载合作请后台联系授权,侵权必究。
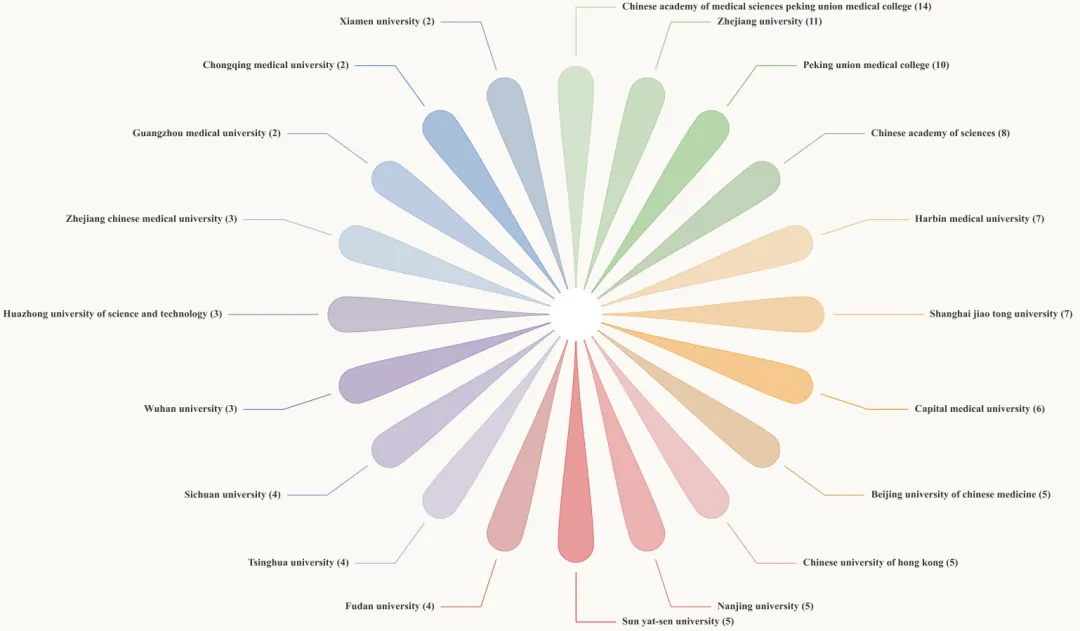
这一期的花瓣玫瑰图和上一期的风车玫瑰图都是饼图的变种图,个人觉得从直观度上来看,是不是风车玫瑰图更直观看出数据对比呢?
01

环境配置

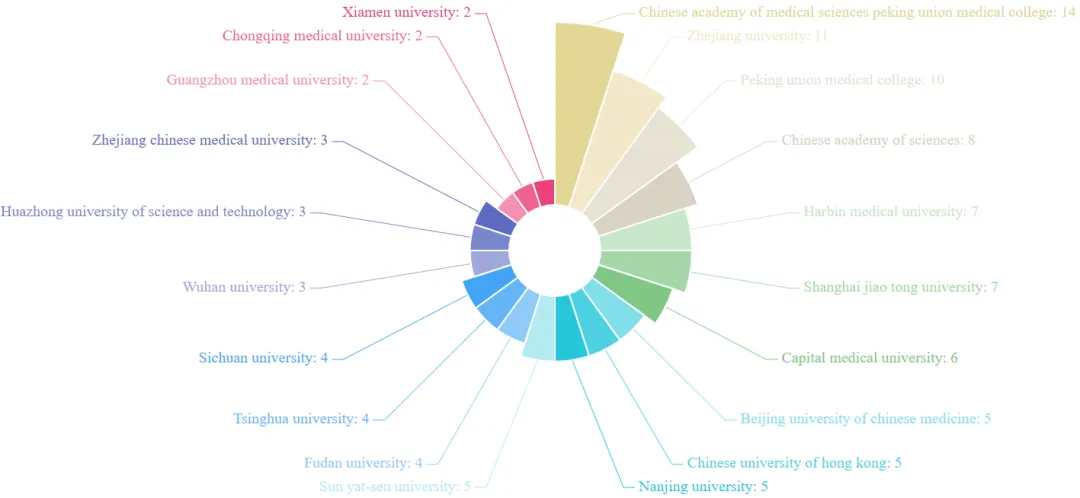
这一步主要是初始化绘图环境并定义核心数据。这里我选用了低饱和度的莫兰迪色系,纯属个人喜好。
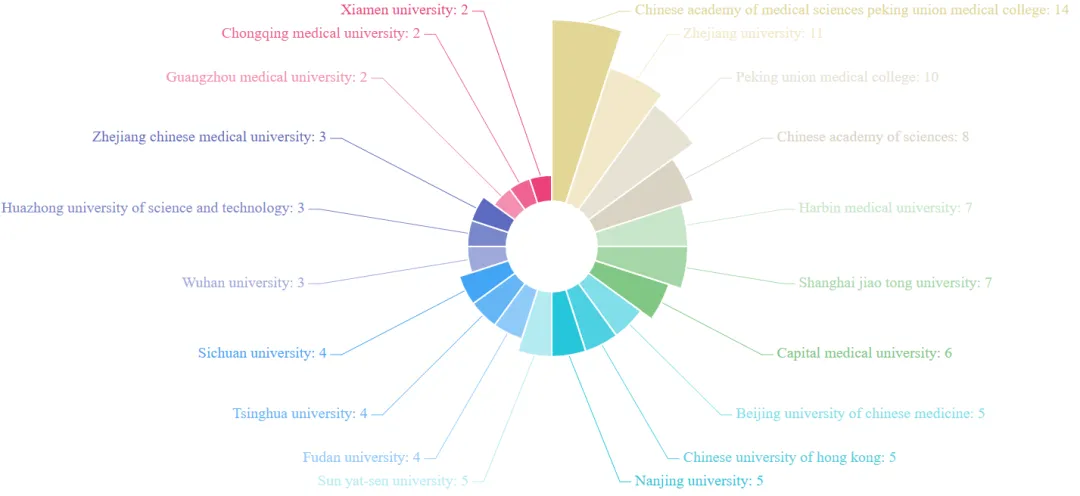
1 2 3 4 5 6 7 8 9 10 11 12 13 14 15 16 17 18 19 20 21 22 23 24 25 26 27 import numpy as npimport matplotlib.pyplot as pltimport matplotlib.patches as patchesfrom matplotlib.path import Pathfrom matplotlib.colors import to_rgba# 设置精致的字体与背景色plt.rcParams['font.sans-serif'] = ['Times New Roman']plt.rcParams['axes.unicode_minus'] = False# 定义5大莫兰迪色系,用于区分不同的机构数据MORANDI_COLORS = [ '#B0CEA6', '#97C289', '#77B464', '#8DB082', '#ECC088', '#EEAE5D', '#F29826', '#D39F5F', '#E09494', '#DD6F6F', '#DA3E3F', '#C56D6D', '#B5ABCA', '#9E8FBC', '#826DAC', '#9387AB', '#A1B8D4', '#81A3CA', '#5889C0', '#7C97B6']# 模拟机构分布数据INSTITUTION_DATA = [ ("Chinese academy of medical sciences", 14), ("Zhejiang university", 11), ("Peking union medical college", 10), ("Chinese academy of sciences", 8), ("Harbin medical university", 7), ("Shanghai jiao tong university", 7)]
02

坐标转换

由于花瓣是在局部坐标系下建模的,所以需要一个函数将其映射到圆周的指定角度。这里利用了旋转矩阵原理,将局部向量转换为全局坐标。
1 2 3 4 5 6 7 def transform_local_to_global(local_x, local_y, target_angle): """ 通过径向和切向基向量,将花瓣局部坐标旋转至目标角度。 """ radial_vector = np.array([np.cos(target_angle), np.sin(target_angle)]) tangential_vector = np.array([-np.sin(target_angle), np.cos(target_angle)]) return local_x * tangential_vector + local_y * radial_vector
03

构建花瓣路径

这一步使用 Path 指令构建精细的花瓣几何体。通过三次贝塞尔曲线控制侧边弧度,并结合半圆弧指令生成圆润的花瓣顶端。
1 2 3 4 5 6 7 8 9 10 11 12 13 14 15 16 17 18 19 20 def get_petal_path(angle, total_petals, config): inner_radius = config["inner_radius"] petal_length = config["petal_length"] outer_radius = inner_radius + petal_length # 计算花瓣宽度和顶部圆弧参数 max_w = 2.0 * outer_radius * np.tan(np.pi / total_petals) * config["width_margin_ratio"] top_w = max_w * config["top_width_scale"] cap_r = 0.5 * top_w y_base, y_cap_center = inner_radius, outer_radius - cap_r # 构造贝塞尔路径顶点与指令 vertices, codes = [], [] vertices.append((-top_w * config["base_width_scale"] / 2, y_base)) codes.append(Path.MOVETO) # 绘制左侧曲线、顶部圆弧、右侧曲线(此处简化展示逻辑) global_v = [tuple(transform_local_to_global(vx, vy, angle)) for (vx, vy) in vertices] return Path(global_v, codes), outer_radius
04

定义绘图逻辑

定义一个函数,负责遍历数据,绘制带透明度的填充花瓣,并计算复杂的“Z”字型标签引导线位置。它确保了文字在左右两侧对称分布,避免重叠。
1 2 3 4 5 6 7 8 9 10 11 12 13 14 15 16 17 def draw_refined_rose_chart(axis, dataset, colors, config): num = len(dataset) angle_step = 2 * np.pi / num angles = [np.pi / 2 - i * angle_step for i in range(num)] for i, (angle, (name, val)) in enumerate(zip(angles, dataset)): color = colors[i % len(colors)] path, outer_edge = get_petal_path(angle, num, config) # 绘制带透明度的花瓣 patch = patches.PathPatch(path, facecolor=to_rgba(color, 0.5), edgecolor=to_rgba(color, 0.7), zorder=3) axis.add_patch(patch) # 计算并绘制折线引导线与标签 is_right = np.cos(angle) >= 0 h_dir = 1 if is_right else -1 # 引导线逻辑:p_start -> p_elbow -> p_end
05

定义参数并绘图

设定具体的几何参数(如花瓣长度、平滑度等),并初始化 Matplotlib 的 Figure 对象。
1 2 3 4 5 6 7 8 9 10 11 12 13 14 CONFIG = { "inner_radius": 0.5, "petal_length": 7.0, "width_margin_ratio": 0.9, "top_width_scale": 0.5, "base_width_scale": 0.01, "cap_smoothing_points": 50, "center_hole": 0.8, "line_start_padding": 0.3, "line_slope_length": 1.5, "h_line_len": 1.2, "text_pad": 0.2}# 初始化高分辨率画布fig, ax = plt.subplots(figsize=(24, 16))fig.set_facecolor(BACKGROUND_COLOR)ax.set_facecolor(BACKGROUND_COLOR)ax.set_aspect("equal")ax.axis("off")
🌿 今日的分享就到这里啦~如果这些内容有为你带来帮助,欢迎轻点右下角的【👍赞】和【👀在看】,也欢迎分享给更多需要的人,感恩~
THE
END


数据和代码怎么获取?
点击关注后,后台回复关键词:
2026_map_012可直接获取完整的示例数据和代码
如有帮助,您的点赞、评论、转发是我持续创作的动力~