【干货】值得收藏的14个Linux下CPU监控工具
- 2026-07-04 02:08:16
【干货】值得收藏的14个Linux下CPU监控工具
top是最常用的查看系统资源使用情况的工具,包括CPU、内存等等资源。 这里主要关注CPU资源。 load average取自/proc/loadavg。 前三个数字是1、5、15分钟内进程队列中平均进程数,包括正在运行的进程+准备好等待运行的进程。 第四个数字分子表示正在运行的进程数,分母是进程总数。 最后一个数字是最近运行的进程ID号。 其中top取的是/proc/loadavg的前三个数。 打开top,可以指定更新的周期。 输入H,打开隐藏的线程;输入1,可以显示单核CPU使用情况。 top -H -b -d 1 -n 200 > top.txt,每个1秒统计一次,共200次,显示线程细节,并保存到top.txt中。 top采样来源你还依赖于/proc/stat和/proc//stat两个,这两个的详细介绍参考:/proc/stat[1]和/proc//stat[2]。 其中CPU信息对应的含义如下: 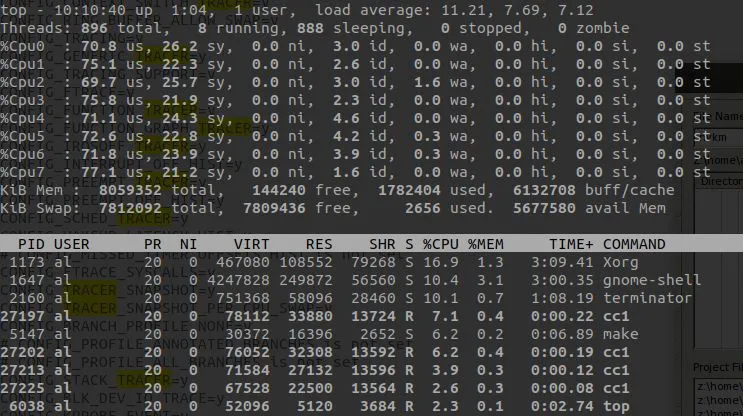
《系统级性能分析工具perf的介绍与使用[3]》有关于perf使用的详细介绍,这里重点关注CPU占用率。 通过sudo perf top -s comm,可以查看当前系统运行进程占比。 这里不像top一样区分idle、system、user,这里的占比是各个进程在总运行时间里面占比。 通过sudo perf record记录采样信息,然后通过sudo perf report -s comm。 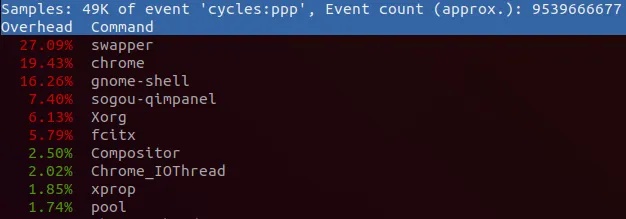
sar是System Activity Report的意思,可以用于实时观察当前系统活动,也可以生成历史记录的报告。 要使用sar需要安装sudo apt install sysstat,然后对sysstat进行配置。 sar用于记录统计信息,ksar[4]用于将记录的信息图形化输出。 ksar下载地址在:https://github.com/vlsi/ksar/releases。 使用sar记录开机到目前的统计信息到文件sar.txt。 PS:这里直接使用sar -A,在ksar中无法正常显示。 如下执行java -jar ksar.jar,然后Data->Load from text file...选择保存的sar.txt文件。 得到如下的图表。 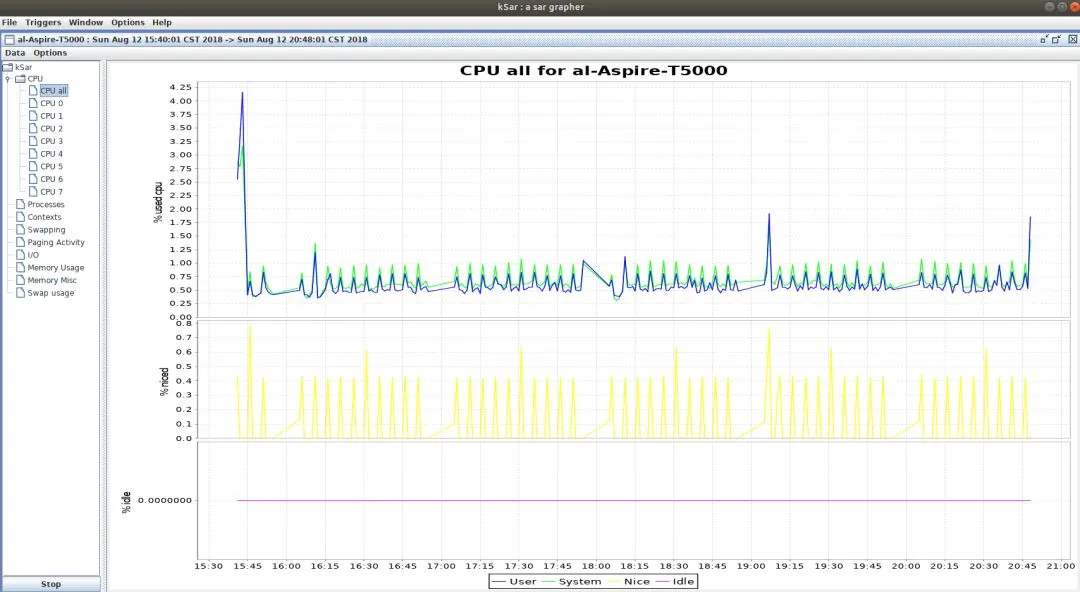
还可以通过sar记录一段时间的信息,指定采样周期和采样次数。 这些命令前加上LC_ALL=C之后保存到文件中,都可以在ksar中图形化显示。 更详细请参考 •《How To Create sar Graphs With kSar To Identifying Linux Bottlenecks[5]》 •《Collect and report Linux System Activity Information with sar[6]》。 mpstat是Multiprocessor Statistics。当没有参数时,mpstat显示系统系统以来所有信息平均值。 常见用法如下,-P ALL监控所有CPU,细节显示特定CPU;10表示每10秒监控一次;20表示监控20次。 结果如下: 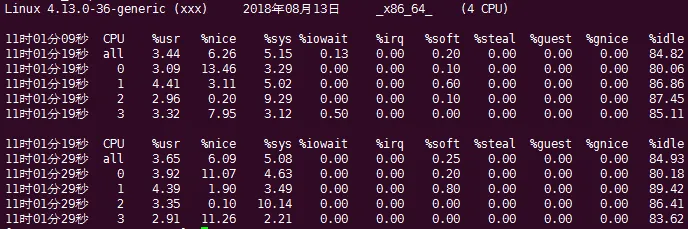
usr表示用户空间进程,nice表示nice值大于0的用户空间进程。 sys是内核空间,iowait是I/O等待时间,irq是硬中断,soft是软中断,idle是空闲时间,guest和gnice都是虚拟机时间。 uptime是一个简单获取系统总共运行多长时间,以及最近1分钟、5分钟、15分钟的平均负载。 uptime通过/proc/uptime和/proc/loadavg获取相关信息。 up前是当前系统时间,up后是系统运行时长。 load average后是1分钟、5分钟、15分钟平均负载。 vmstat主要用于监控系统内存使用情况的工具,但是也包含一些CPU相关信息。 使用方法vmstat 5 5表示运行5次,每次5秒。结果如下: 上面的参数可以分为6大部分:进程、内存、swap、io、中断和进程切换、cpu。 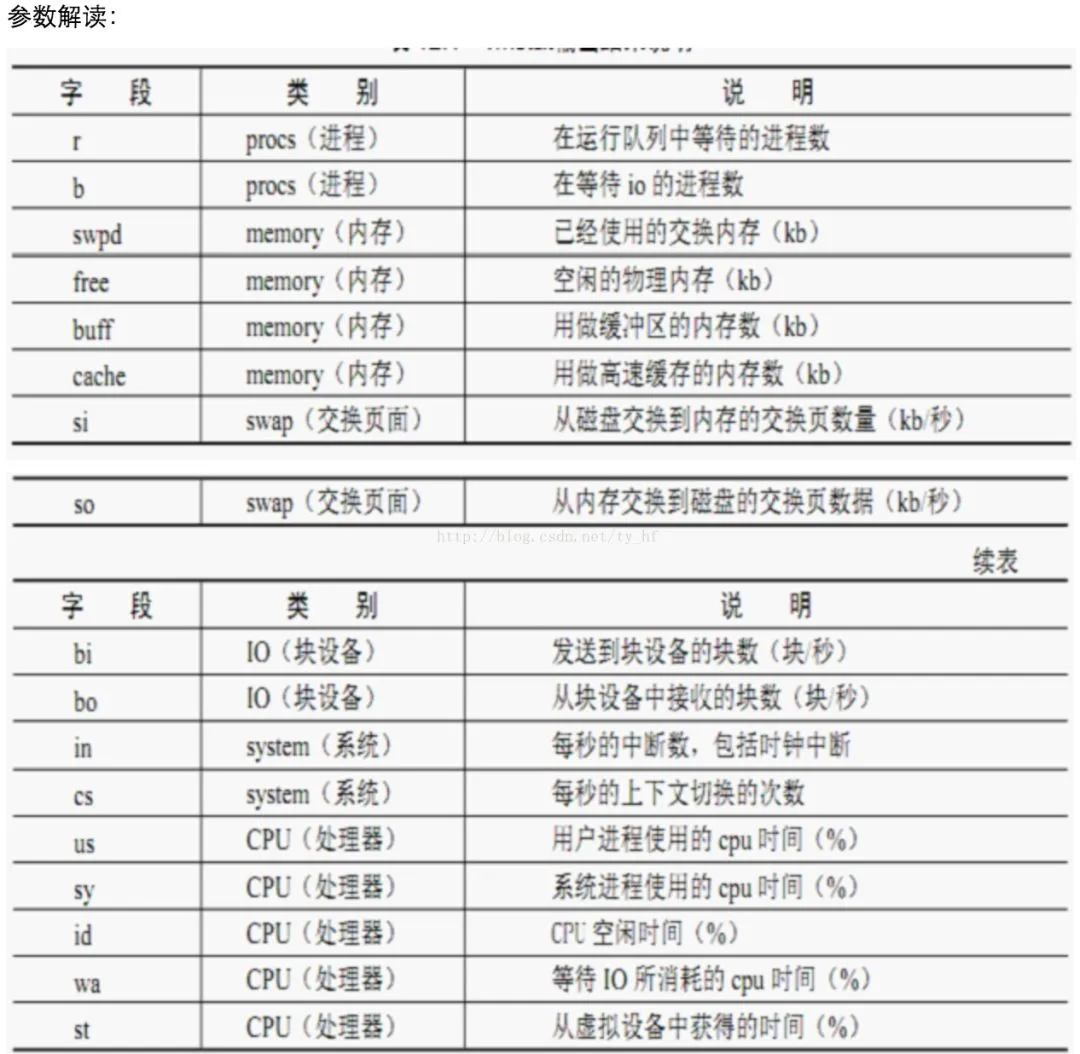
更加详细的解释: 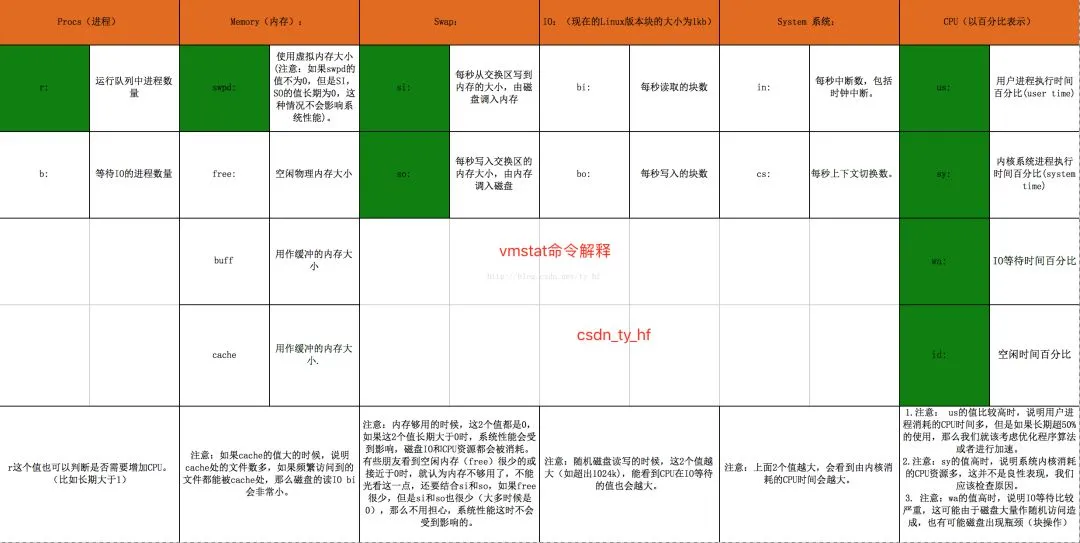
参考文档:《Linux Performance Measurements using vmstat[7]》 pidstat主要用于监控全部或指定进程占用系统资源的情况。 pidstat首次运行时显示自系统启动开始的各项统计信息,之后运行pidstat将显示自上次运行该命令以后的统计信息。用户可以通过指定统计的次数和时间来获得所需的统计信息。 除此之外还可以通过-p获取指定进程的统计信息。 pidstat还可以通过-r获取内存使用统计信息,通过-d获取IO使用统计信息。 pidstat -p ALL -r结果如下: minflt/s: 每秒次缺页错误次数(minor page faults),次缺页错误次数意即虚拟内存地址映射成物理内存地址产生的page fault次数。 majflt/s: 每秒主缺页错误次数(major page faults),当虚拟内存地址映射成物理内存地址时,相应的page在swap中,这样的page fault为major page fault,一般在内存使用紧张时产生。 VSZ: 该进程使用的虚拟内存(以kB为单位)。 RSS: 该进程使用的物理内存(以kB为单位)。 %MEM: 该进程使用内存的百分比。 Command: 拉起进程对应的命令。 pidstat -p ALL -d结果如下: kB_rd/s: 每秒进程从磁盘读取的数据量(以kB为单位)。 kB_wr/s: 每秒进程向磁盘写的数据量(以kB为单位)。 kB_ccwr/s:每秒进程被取消向磁盘写的数据量(以kB为单位)。 Command::拉起进程对应的命令。 time命令可以被用于统计指定程序的CPU耗时。 比如time cksum nomachine_6.0.80_1.exe得到如下结果。 通过sudo apt install cpustat安装,cpustat -T -D -x结果如下。 htop和top的功能类似,但是可读性比top更好。在界面按下F5,可以看到进程里面的线程,树形结构表示了父子关系。 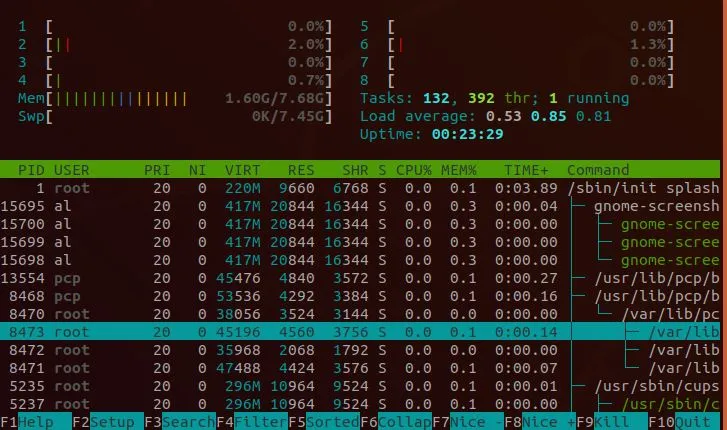
atop是一个监控系统资源和进程的工具。它通过CPU使用率来对列表中的进程进行降序排列,而每一个进程则包含了CPU、内存、磁盘和网络状态等信息。它的功能与top和htop类似。 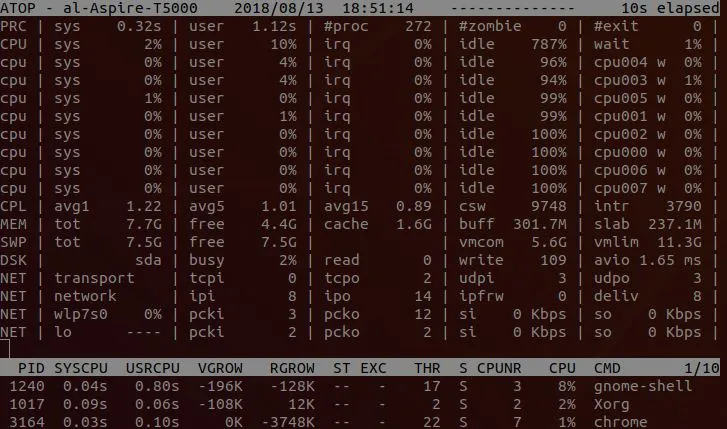
glances是一个由python编写的,与Nmon功能类似的报告工具,它能够报告统计cpu、内存、网络、磁盘和进程。除了报告统计,glances不支持任何其他特性或功能。当程序运行时点击“h”可以显示帮助页面。 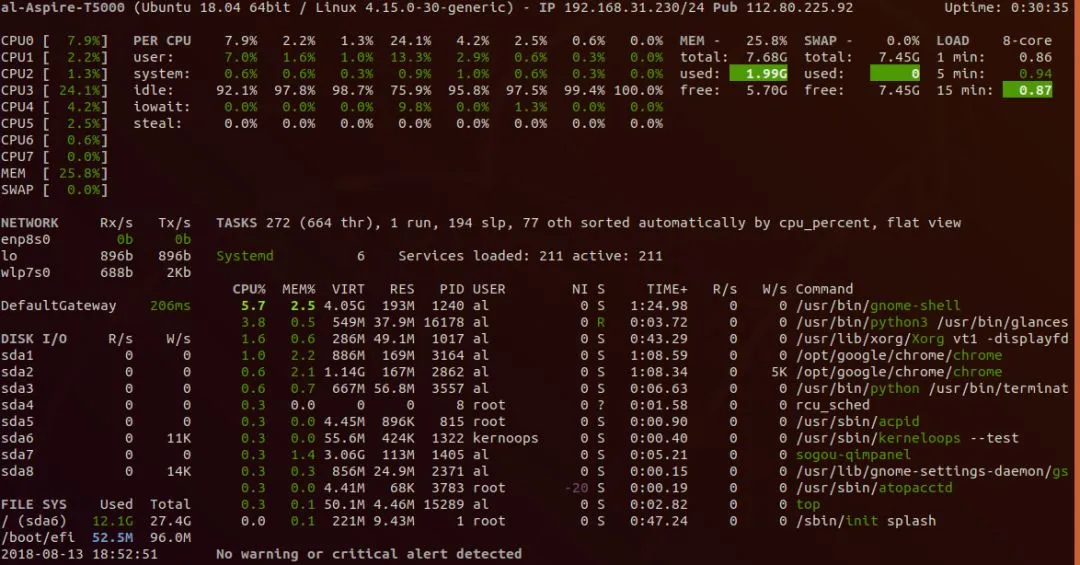
Nmon是一个非常容易使用,能够在一个屏幕上监视CPU、内存、网络、磁盘使用状况和进程列表的工具。除了无法管理进程和修改报告显示,Nmon与那些只用于报告的报告工具完全一样。另外,它可以将数据保存到电子表格文件。 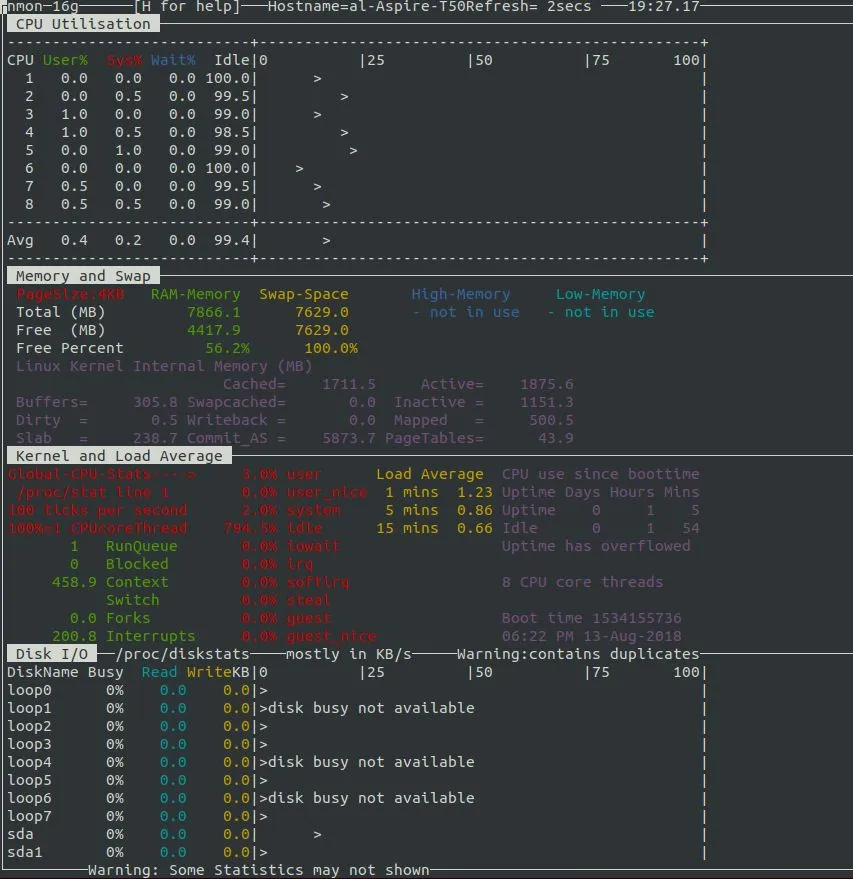
Performance Co-Pilot,简称PCP,是一个系统性能和分析框架。它从多个主机整理数据并实时的分析,帮你识别不正常的表现模式。它也提供API让你设计自己的监控和报告解决方案。 安装pcp相关工具。 File->Open View选择需要打开的视图,比如CPU、Disk、Memory等。 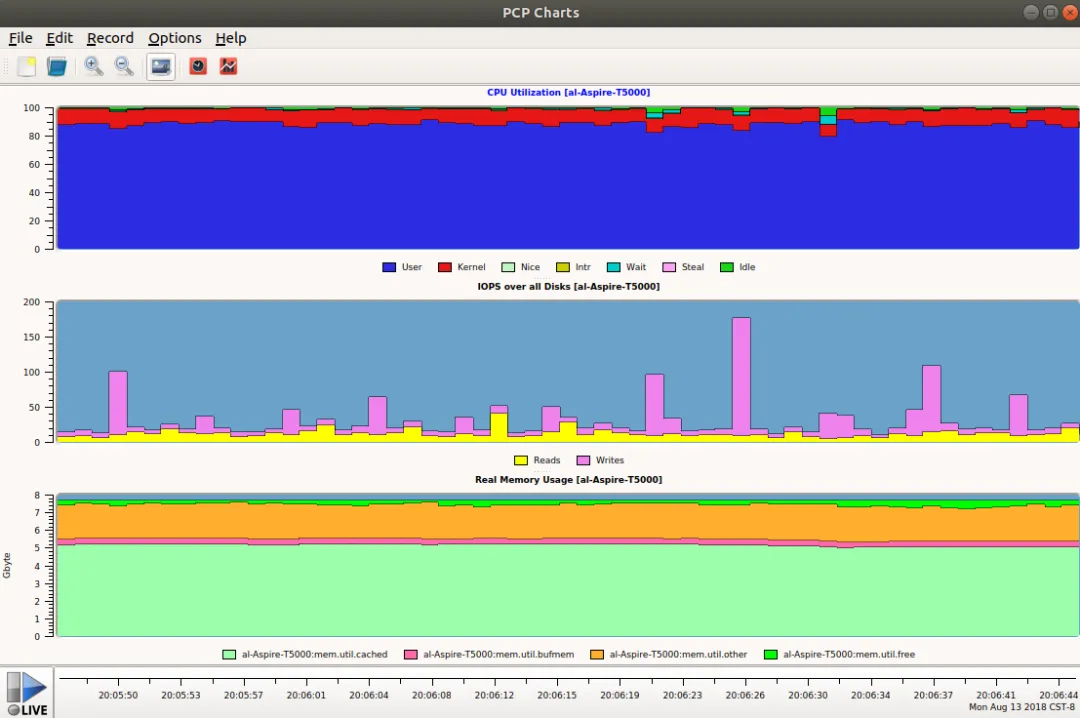
collectl是一款非常优秀并且有着丰富的命令行功能的实用程序,你可以用它来采集描述当前系统状态的性能数据。 不同于大多数其它的系统监控工具,collectl 并非仅局限于有限的系统度量,相反,它可以收集许多不同类型系统资源的相关信息,如 cpu 、disk、memory 、network 、sockets 、 tcp 、inodes 、infiniband 、 lustre 、memory、nfs、processes、quadrics、slabs和buddyinfo等。 同时collectl还可以替代常用工具,比如top、vmstat、ps、iotop等。 安装collectl: collectl的使用很简单,默认collectl显示cpu、磁盘、网络信息。 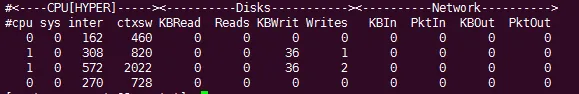
collectl还可以显示更多的子系统信息,如果选项存在对应的大写选项,大写选项表示更细节的设备统计信息。 collectl --all显示所有子系统的统计信息,包括cpu、终端、内存、磁盘、网络、TCP、socket、文件系统、NFS。 
collectl --top可以代替top命令: 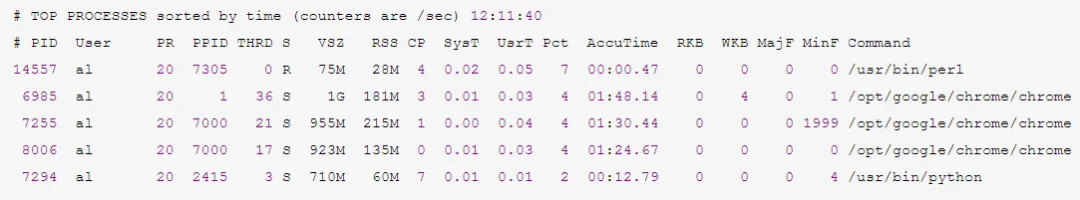
collectl --vmstat可以代替vmstat命令: 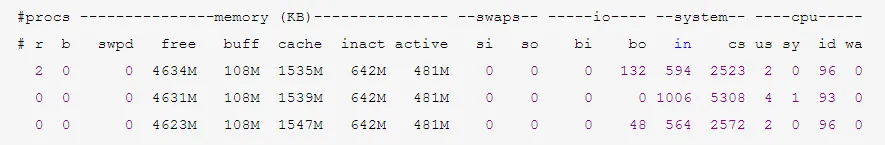
collectl -c1 -sZ -i:1可以代替ps命令。 collectl和一些处理分析数据工具(比如colmux、colgui、colplot)结合能提供可视化图形。 colplot是collectl工具集的一部分,其将collectl收集的数据在浏览器中图形化展示。 colplot的介绍(http://collectl-utils.sourceforge.net/colplot.html),相关源码可以再collectl-utils]下载:https://sourceforge.net/projects/collectl-utils/files/ 解压下载的colplot之后,sudo ./INSTALL安装colplot。 安装之后重启apache服务: 在浏览器中输入http://127.0.0.1/colplot/,即可使用colplot。 通过Change Dir选择存放经过collectl -P保存的数据,然后设置Plot细节、显示那些子系统、plot大小等等。 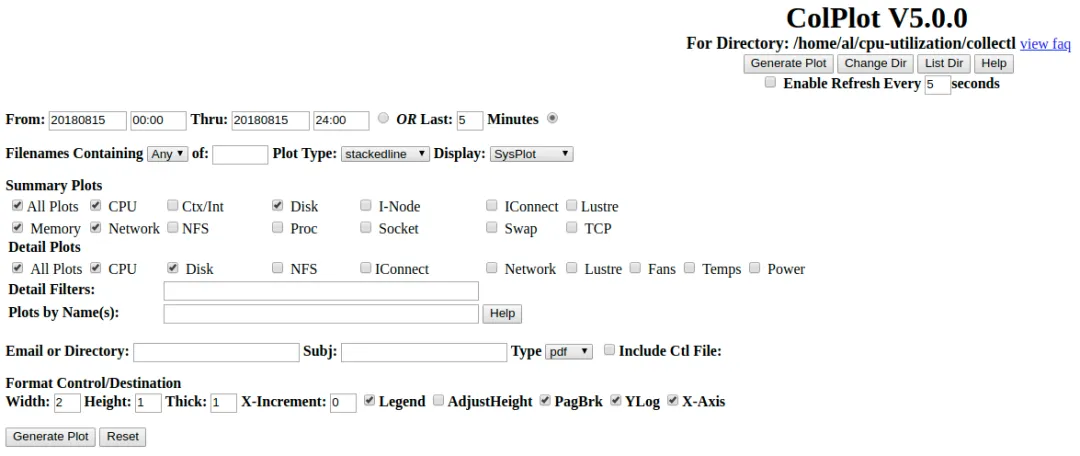
最后Generate Plot查看结果。 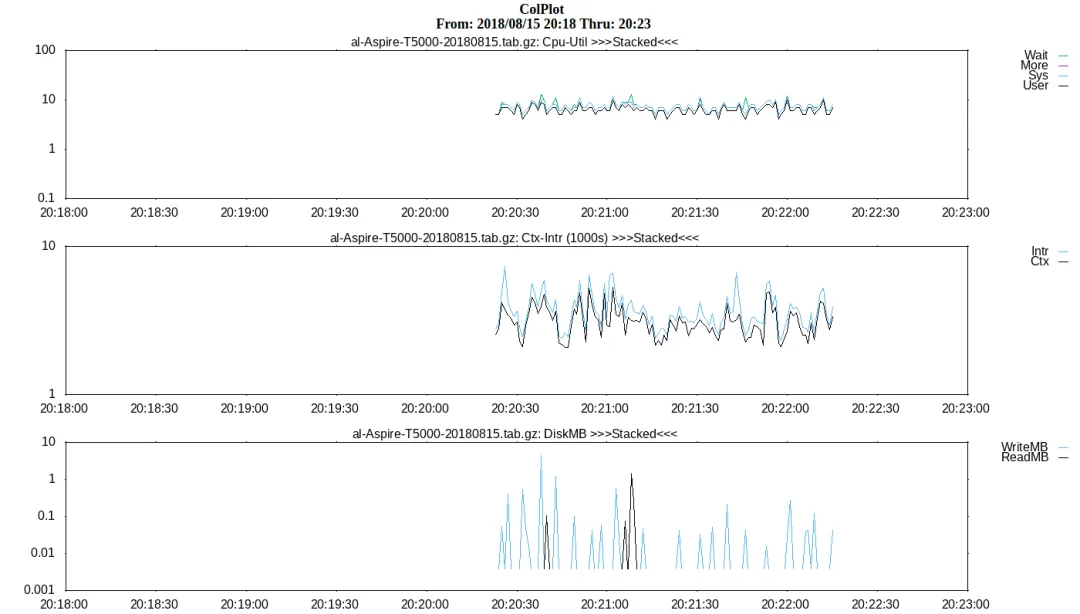
参考文档:《Collectl: Linux 性能监控的全能冠军[8]》、 《Collectl Documentation[9]》、《Collectl Examples - An Awesome Performance Analysis Tool in Linux[10]》 

好课推荐 
红帽认证-RHCE \ RHCA 红帽认证是全球公认的 Linux 权威认证,也是国内企业招聘 Linux 运维、云计算、容器、大数据工程师时,最常标注的 “优先条件”,甚至很多企业将 RHCE/RHCA 作为入职的基础技能要求。 


01. top
1.1 /proc/loadavg
9.53 9.12 8.37 3/889 281651.2 top使用
us:user,统计nice小于等于0的用户空间进程,也即优先级为100~120。ni:nice,统计nice大于0的用户空间进程,也即优先级为121~139。sys:system,统计内核态运行时间,不包括中断。id:idle,几系统处于空闲态。wa:iowait,统计io等待时间。hi:hardware interrupt,统计硬件中断时间。si:software interrupt,统计软中断时间。st:steal02. perf
03. sar和ksar
# 将 ENABLED=“false“ 改为ENABLED=“true“$ sudo gedit /etc/default/sysstat# 修改sar的周期等配置$ sudo gedit /etc/cron.d/sysstat# 重启sar服务$ sudo /etc/init.d/sysstat restart# sar log存放目录$ ls -l /var/log/sysstat/LC_ALL=C sar -A > sar.txtsar 1100-----------------所有cpu合一的统计信息sar -P ALL 1100--------包括cpu合一以及单个cpu的统计信息sar -B 1100---------------paging统计信息sar -b 1100---------------块设备IO统计信息sar -d 1100---------------块设备活动统计信息sar -F 1100----------------挂载的文件系统统计信息sar -r ALL------------------ 显示详细的内存使用统计信息sar -S ------------------------显示swap空间使用情况统计信息sar -w----------------------- 显示进程创建以及进程切换统计信息sar -W-----------------------显示swap换入换出统计信息。04. mpstat
$ mpstat -P ALL 102005. uptime
11:15:41 up 82 days, 20:34, 8 users, load average: 0.28, 0.40, 0.4306. vmstat
procs -----------memory---------- ---swap-- -----io---- -system-- ------cpu----- r b swpd free buff cache si so bi bo in cs us sy id wa st10472576228688559092106175600939108487001047257622818455910010617560001315323395106840010472576229308559100106161600001446344910585000047257622959255910810616160006141934741058500104725762298045591081061616000014463439105850007. pidstat
7.1 查看CPU使用情况
# 显示所有的进程统计信息,包括idle进程。pidstat -p ALL# 更加详细的显示了线程统计信息。pidstat -p ALL -t# 周期采样和采样次数pidstat [option] interval [count]7.2 查看内存使用情况
15时18分21秒 UID PID minflt/s majflt/s VSZ RSS %MEM Command15时18分21秒 010.020.0018531630280.08 systemd15时18分21秒 020.000.00000.00 kthreadd15时18分21秒 040.000.00000.00 kworker/0:0H15时18分21秒 060.000.00000.00 mm_percpu_wq15时18分21秒 070.000.00000.00 ksoftirqd/015时18分21秒 080.000.00000.00 rcu_sched7.3 查看磁盘使用情况
15时20分40秒 UID PID kB_rd/s kB_wr/s kB_ccwr/s iodelay Command15时20分40秒 01 -1.00 -1.00 -1.00243523129 systemd15时20分40秒 02 -1.00 -1.00 -1.000 kthreadd15时20分40秒 04 -1.00 -1.00 -1.000 kworker/0:0H15时20分40秒 06 -1.00 -1.00 -1.000 mm_percpu_wq15时20分40秒 07 -1.00 -1.00 -1.00714512328679 ksoftirqd/015时20分40秒 08 -1.00 -1.00 -1.00417757303594 rcu_sched08. time
240194063832606752 nomachine_6.0.80_1.exe# 整个操作总耗时,0.263-0.094-0.011=0.158是IO等待耗时。real 0m0.263s# 用户态耗时user 0m0.094s# 内核态耗时sys 0m0.011s240194063832606752 nomachine_6.0.80_1.exe# 第二次执行就可以看出等待IO操作的时间基本上没有了。real 0m0.098suser 0m0.097ssys 0m0.000s09. cpustat
# 显示Load Avg信息和平均频率等LoadAvg0.660.540.49, FreqAvg. 1.46GHz, 4CPUs online# 进程切换次数、硬中断、软中断等等统计信息。# CPU占用率、用户空间和内核空间占用率等。3791.1Ctxt/s, 1709.9 IRQ/s, 1800.0 softIRQ/s, 0.0new tasks/s, 1 running, 0 blocked %CPU %USR %SYS PID S CPU TimeTask25.7425.740.0011435 R 32.29w /usr/bin/python315.8415.840.009445 S 01.49w /usr/lib/xorg/Xorg10.899.900.992722 S 11.05w compiz7.920.007.9232352 S 216.60s [kworker/2:1]0.990.000.9932397 R 10.01s cpustat0.990.990.0011046 S 216.20h compiz0.990.990.001317 S 08.76h /usr/NX/bin/nxnode.bin0.990.000.9910293 S 11.24m [kworker/1:2]64.3653.4710.89TotalLoadAvg0.660.540.49, FreqAvg. 1.75GHz, 4CPUs online2834.8Ctxt/s, 1190.9 IRQ/s, 1183.3 softIRQ/s, 0.0new tasks/s, 4 running, 0 blocked %CPU %USR %SYS PID S CPU TimeTask25.7625.760.0011435 R 32.29w /usr/bin/python318.1818.180.009445 S 01.49w /usr/lib/xorg/Xorg7.587.580.002722 S 11.05w compiz6.060.006.0632352 S 216.64s [kworker/2:1]1.520.001.5232397 R 10.02s cpustat1.520.001.528 S 03.00h [rcu_sched]1.520.001.5218409 S 01.16m update-notifier62.1251.5210.61TotalDistribution of CPU utilisation (per Task):% CPU UtilisationCount (%)0.00 - 1.9770698.881.97 - 3.9400.003.94 - 5.9100.005.91 - 7.8820.287.88 - 9.8500.009.85 - 11.8200.0011.82 - 13.7910.1413.79 - 15.7600.0015.76 - 17.7310.1417.73 - 19.7010.1419.70 - 21.6700.0021.67 - 23.6400.0023.64 - 25.6120.2825.61 - 27.5700.0027.58 - 29.5400.0029.55 - 31.5100.0031.52 - 33.4800.0033.48 - 35.4500.0035.45 - 37.4200.0037.42 - 39.3910.14Distribution of CPU utilisation (per CPU):----------------------------------------------各CPU占用率,分用户空间和内核空间。 CPU# USR% SYS%017.371.2018.982.4020.607.19325.750.0010. htop
11. atop
12. glances
13. nmon
14. pcp-gui
$ sudo apt install pcp pcp-gui15. collectl和colplot
15.1 collectl使用
sudo apt-get install collectlb – buddy info (内存碎片)c – 所有CPU的合一统计信息;C - 单个CPU的统计信息。d – 整个文件系统Disk合一统计信息;C - 单个磁盘的统计信息。f – NFS V3 Datai – InodeandFileSystemj – 显示每个CPU的Interrupts触发情况;J - 显示每个中断详细触发情况。l – Lustrem – 显示整个系统Memory使用情况;M - 按node显示内存使用情况。n – 显示整个系统的Networks使用情况;N - 分网卡显示网络使用情况。s – Socketst – TCPx – Interconnecty – 对系统所有Slabs (系统对象缓存)使用统计信息;Y - 每个slab使用的详细信息。15.2 colplot使用
$suod systemctl reload apache2$ sudo systemctl restart apache2References
[1] /proc/stat: https://www.cnblogs.com/arnoldlu/p/9187775.html#system_proc_stat[2] /proc//stat: https://www.cnblogs.com/arnoldlu/p/9187775.html#process_proc_stat[3] 系统级性能分析工具perf的介绍与使用: https://www.cnblogs.com/arnoldlu/p/6241297.html[4] ksar: https://sourceforge.net/projects/ksar/[5] How To Create sar Graphs With kSar To Identifying Linux Bottlenecks: https://www.cyberciti.biz/tips/identifying-linux-bottlenecks-sar-graphs-with-ksar.html[6] Collect and report Linux System Activity Information with sar: https://www.thomas-krenn.com/en/wiki/Collect_and_report_Linux_System_Activity_Information_with_sar[7] Linux Performance Measurements using vmstat: https://www.thomas-krenn.com/en/wiki/Linux_Performance_Measurements_using_vmstat[8] Collectl: Linux 性能监控的全能冠军: https://linux.cn/article-3154-1.html[9] Collectl Documentation: http://collectl.sourceforge.net/Documentation.html[10] Collectl Examples - An Awesome Performance Analysis Tool in Linux: https://linoxide.com/monitoring-2/collectl-tool-install-examples/认准红帽官方授权
微思-红帽官方授权合作伙伴!

— Linux文章推荐 —
本文来自网友投稿或网络内容,如有侵犯您的权益请联系我们删除,联系邮箱:wyl860211@qq.com 。
随机文章
-
 10个月宝宝每天需要喝多少奶粉?
- Linux: dev: gcc: --coverage 迷惑行为最终生成不了gcda文件?
- 中篇Python(ODOO)篇 第一章 Python基础(六)基础部分 12.循环控制
- 嵌入式Linux--API(NewAPI)高效网络数据接收机制详解
- Linux 俱乐部 2026 春季学期换届公告
- Linux input子系统框架
- 招新 | Linux 俱乐部 x 未名超算队 x PKUCC战队欢迎你的加入
- Linux基础 | tee命令使用指南:一条命令同时输出到屏幕和文件
- OpenClaw | Linux 部署 · 接入飞书 · 拉进群聊
- Linux 超级漂亮的 Shell !
- PHP电竞无畏契约趣味自定义赏金赛
