Python作图 - 超全细节设置:从数据读取到出图
- 2026-06-28 06:54:39
#所用到的包import pandas as pdimport matplotlib.pyplot as pltimport matplotlib.dates as mdates0、Excel数据读取
in_path=r'F:\123.xlsx'#读取到123 sheetdf=pd.read_excel(in_path,sheet_name="123")#读取到列名称为x的列data=df['x']# 去除列数据中的空值data=data.dropna(axis=0,how='any')1、作图大小
1.1 注意单位
python 利用的单位是指英寸,换算关系是英寸=厘米/2.54
1.2 大小设置
代码中的单位都是指的是英寸,我们可以换算成厘米来计算
width_cm=20height_cm=13width,height=width_cm/2.54,height_cm/2.54fig,(ax1,ax2)=plt.subplots(2,1,figsize=(width,height),sharex=True)2、子图的设置
2.1 规则子图/不规则子图
lne的科研记录本:Python - 不规则子图绘制
2.2 不规则子图
2.3 双坐标轴设置
width_cm=20height_cm=13width,height=width_cm/2.54,height_cm/2.54fig,(ax1,ax2)=plt.subplots(2,1,figsize=(width,height),sharex=True)ax11=ax1.twinx()#这样ax11就是第二个坐标轴了,后面可以跟主坐标轴一样设置坐标轴范围、刻度等等关于share参数chatgpt的回复:
在 matplotlib 中,sharex 和 sharey 参数用于控制子图是否共享相同的 x 轴或 y 轴。这在你希望多个子图在轴的范围、刻度和刻度标签上保持一致时特别有用。
sharex 参数
sharex=True:当设置为 True时,所有创建的子图将共享相同的 x 轴。这意味着它们会有相同的 x 轴范围、刻度和刻度标签。如果你缩放或平移一个子图,其他子图的 x 轴也会相应调整。sharex='all'或sharex='col':与 sharex=True类似,适用于单列子图。对于多列布局,sharex='col'会在同一列的子图之间共享 x 轴。sharex='none'(默认):每个子图都有自己独立的 x 轴。
sharey 参数
sharey=True:与 sharex类似,但用于 y 轴。所有子图将共享相同的 y 轴范围、刻度和刻度标签。sharey='all'或sharey='row':允许在同一行的子图之间共享 y 轴。 sharey='none'(默认):每个子图都有自己独立的 y 轴。
2.4 子图间距设置
plt.subplots_adjust(hspace=0.08,wspace=0.05)# hspace是垂直距离,wspace是水平距离plt.tight_layout()**上面的两个只能出现一个,只要plt.tight_layout()出现,上面的plt.subplots_adjust()调节就不会起作用
2.5 图片的边框设置
#设置隐藏所有边框线ax.set_axis_off()#统一设置边框的颜色和粗细border_width = 0.9border_color = 'grey'for ax in [ax1, ax2, ax11, ax21]: ax.spines['top'].set_color(border_color) ax.spines['bottom'].set_color(border_color) ax.spines['left'].set_color(border_color) ax.spines['right'].set_color(border_color) ax.spines['top'].set_linewidth(border_width) ax.spines['bottom'].set_linewidth(border_width) ax.spines['left'].set_linewidth(border_width) ax.spines['right'].set_linewidth(border_width) 统一设置所有边框线的颜色和边框线线宽
for spine in axes[i].spines.values(): spine.set_edgecolor('black') # 设置边框颜色为黑色 spine.set_linewidth(0.4) 3、刻度、标题、图例
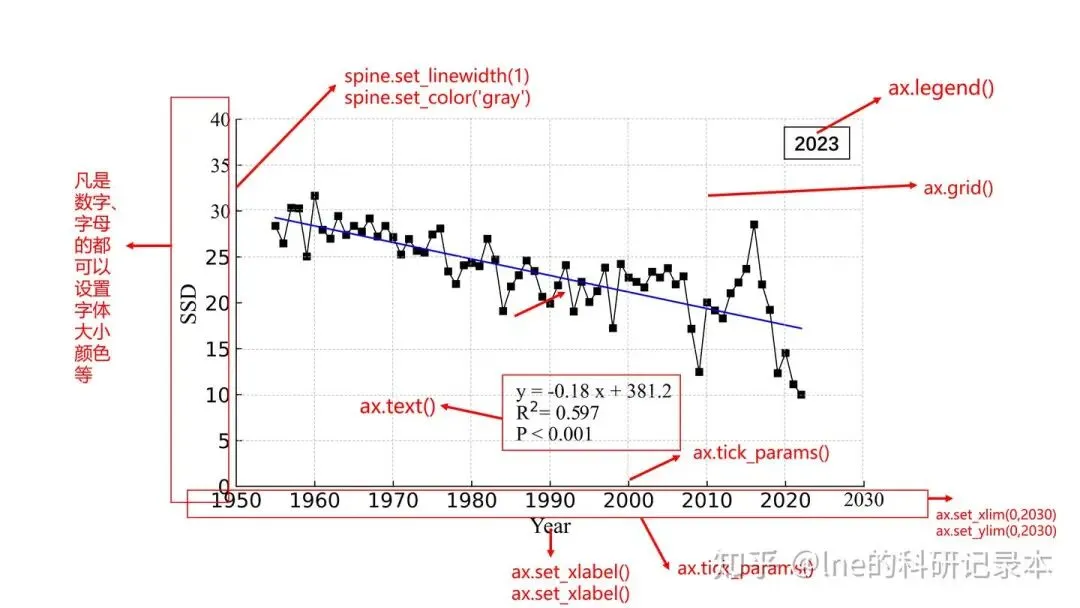
3.1 认识各部分在python 代码中的表达
3.2 刻度(tick)
3.2.1刻度字体,大小
forlabelinaxes[i].get_yticklabels():label.set_fontsize(9)# 设置字体大小label.set_fontname('Times New Roman')# 设置字体forlabelinaxes[i].get_xticklabels():label.set_fontsize(9)# 设置字体大小label.set_fontname('Times New Roman')# 设置字体3.2.2 刻度范围(x/ylim)
# 设置范围为0到251,刻度间隔为50,这样设置的话刻度不是从0开始ax.set_xticks(np.arange(0, 251, 50))ax.set_yticks(np.arange(0, 251, 50))# 如果刻度从0开始的话要重新设置刻度范围设置ax.set_ylim(0, 15)3.2.3刻度标签设置
tick_labels = {'fontsize': 12, 'fontname': 'Times New Roman', 'color': 'black', 'fontweight': 'normal'}axes[1].set_yticklabels(['Total', 'Stem', 'Leaf', 'Ear'], rotation=90, ha='center', fontdict=tick_labels)axes[1].set_xticklabels(df2.columns, rotation=90, ha='right', fontdict=tick_labels)axes[0].tick_params(axis='both', which='both', length=0, color='black',pad=5,direction='in',width=1,labelsize=10,labelcolor='r')axes[0].tick_params:设置刻度线参数
length:调节刻度线长短;color:刻度线颜色;pad:刻度线与坐标轴的距离;axis:可选‘x’,'y','both',只设置x,y或这都设置;direction:刻度线的指向,可选in,out,inout(同时指向内外);width:刻度线宽度;labelsize:刻度标签字体大小;labelcolor刻度标签颜色
axes[0].set_yticklabels:设置刻度标签属性
第一个参数:设置的刻度标签内容,可以自主设定或者excel中读取;rotation:标签旋转角度;ha/va:标签对齐方式,ha是水平对齐,应用与竖直标签,可选left,center,right,va是垂直对齐,可选top,center,bottom;fontdict:设置标签字体属性
3.3 坐标轴标题(label)
与坐标轴的间距,字体,坐标轴标题位置
axes.set_xticklabels("")#隐藏坐标轴标题axes.set_xlabel('Irrigation and Cultivar',fontproperties='Times New Roman',size=10,labelpad=6)3.4 标签和坐标轴标题的位置设置
axes.xaxis.set_ticks_position('bottom')axes.xaxis.set_label_position('bottom')#可以选的得有 'top', 'bottom','center'3.5 网格线(grid)
ax.grid(True,which='both',linestyle='--',linewidth=0.5,color='grey',axis='y')#去掉网格线axes[i].grid(False)3.6 添加文字(text)和额外的箭头
# axes.text(-0.01, 0.916, s="文字", fontsize=9.5, color='black', ha='right', va='center', transform=axes.transAxes, fontproperties=chinese_font)4 字体设置
确保字体设置在任何绘图命令之前!!!
4.0 特殊字体表示
#上标4.1 检查字体安装
Windows
控制面板查看字体:
打开“控制面板”。 选择“外观和个性化”。 点击“字体”。这里会列出所有安装的字体。 检查字体名称中含有“SimSun(宋体)”、“SimHei(黑体)”、“Microsoft YaHei(微软雅黑)”等常见中文字体。
字体文件夹:
打开文件资源管理器。 导航到 C:\Windows\Fonts文件夹。在这个文件夹中查找中文字体。
macOS
字体册应用:
打开“字体册”(Font Book)。 在左侧栏中选择“全部字体”。 查看列表中是否有中文字体,如“华文黑体”、“华文细黑”或“苹方”。
Linux
命令行:
打开终端。 输入以下命令列出所有字体:
fc-list:lang=zh4.1 字体路径
- Windows
: 字体通常位于 C:\Windows\Fonts,你可以在这个目录中找到simkai.ttf(楷体)。 - macOS
: 字体可能位于 /System/Library/Fonts或/Library/Fonts,你可以找到STKaiti.ttc。
# 列出电脑上所有可用字体importmatplotlib.font_managerasfmforfontinfm.findSystemFonts():print(fm.FontProperties(fname=font).get_name())打印出来的部分字体:STXihei,Comic Sans MS,Sitka Small,Corbel,ESRI Conservation,Book Antiqua,Century Gothic,Courier10 BT,Yu Gothic,Arial,FangSong,ESRI US MUTCD 3,Ebrima,Papyrus,MS Gothic,Swis721 BT,STSong,ESRI MilMod 02,Georgia,Comic Sans MS,Leelawadee UI,Segoe UI,ESRI Caves 2,Lucida Bright,Bookshelf Symbol 7,Courier10 BT,SymbolMono BT,Microsoft PhagsPa,Calibri,Arial,SimHei,Calibri,Times New Roman
4.2 rcParams设置字体
直接设置全局字体代码
plt.rcParams['font.family']='Times New Roman'plt.rcParams['font.sans-serif']=['KaiTi']plt.rcParams['axes.unicode_minus']=False# 解决负号显示问题确定中文字体的代码
常见的中文字体的英文名称
4.3 FontProperties设置字体
- 代码示例:
importmatplotlib.pyplotaspltfrommatplotlib.font_managerimportFontProperties# 定义字体属性font=FontProperties(fname='C:\\Windows\\Fonts\\simkai.ttf')# Windows 上# font = FontProperties(fname='/System/Library/Fonts/STKaiti.ttc') # macOS 上# 示例数据x=[1,2,3,4,5]y=[1,4,9,16,25]# 绘图plt.plot(x,y)plt.title('中文标题',fontproperties=font)plt.xlabel('X轴',fontproperties=font)plt.ylabel('Y轴',fontproperties=font)# 显示图形plt.show()- 字体名称查找
- 路径
: C:\\Windows\\Fonts\\ - 字体文件名称
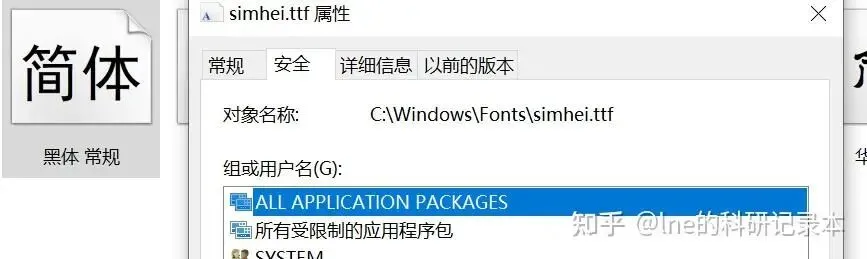
:控制面板中查找字体,查看属性可以看到字体文件名称
4.4 局部字体设置
#全局字体统一设置plt.rcParams['font.family']='Times New Roman'# 图表标题字体# 坐标轴标题#设置为空ax.set_xlabel('')ax.set_ylabel('')#坐标轴刻度字体font_properties=FontProperties(family='Times New Roman',size=12,weight='bold')forlabelinax.get_xticklabels()+ax.get_yticklabels():label.set_fontproperties(font_properties)5 添加文字
plt.text(x,y,f'文字内容',horizontalalignment='center',verticalalignment='center', linespacing=2.1,size=zihao)x和y分别是放置文字的坐标 #horizontalalignment='center',verticalalignment='center'是指文字进行上下左右居中,如果不设置,则默认是从以xy作为左上角坐标开始linespacing=2 设置的分行文字的行间距大小size=12是添加的文字的字号设置
6图片输出
6.1示例
plt.savefig(r'123.jpeg', dpi=500, transparent=None, bbox_inches='tight', pad_inches=0.1)6.2 图片类型
输出的图像不全
plt.subplots_adjust(bottom=0.3)# 调整边距去掉多余的白边
plt.savefig(r'2023.png',# 使用PNG格式以支持透明背景dpi=1000,bbox_inches='tight',pad_inches=0.1)# 消除白边bbox_inches='tight':这个参数会自动调整边框大小以适应图形内容,从而去掉多余的白边。 pad_inches=0.1:这个参数设置图像边缘的填充量为0.1,进一步减少边缘空白,设置为0的话可能会让边框线不见
设置子图间距
plt.subplots_adjust(left=0.1, right=0.9, top=0.9, bottom=0.1, hspace=0.3, wspace=0.3)left:子图距离左边的间距(默认值为 0.125) right:子图距离右边的间距(默认值为 0.9) top:子图距离上边的间距(默认值为 0.9) bottom:子图距离下边的间距(默认值为 0.1) hspace:子图之间的垂直间距 wspace:子图之间的水平间距
7、图例设置
FontProperties(family='KaiTi', size=10, weight='bold') #预设字体属性legend_font = FontProperties(family='Times New Roman', size=9, weight='normal')legend = axes[1].legend(loc=(0, 1), frameon=False, ncol=3,handletextpad=0,labelspacing=0.3,columnspacing=0.5,prop=legend_font)loc=(0, 1):设置图例的位置。loc 可以是一个字符串(如 'upper right')或一个坐标( (0, 1))。
(0, 1) 表示图例的左上角位于坐标轴的左上角。0 和 1 分别对应 x 和 y 轴的相对坐标,范围是 [0, 1],表示从轴的左下角到右上角。
frameon=False:这个参数决定图例是否有边框。False 表示不显示边框,True 表示显示边框。
handletextpad=0:控制图例标记(即图例中的小方块或线条)与文本之间的水平间距。0 表示没有间距。
labelspacing=0.3:设置图例中各行标签之间的垂直间距。0.3 是相对于字体大小的倍数。
columnspacing=0.5:设置图例列之间的水平间距。0.5 是相对于字体大小的倍数。
borderpad:控制图例边框和内容之间的距离。
labelspacing:控制每个标签之间的间距。
#隐藏图例ifax.get_legend()isnotNone:ax.get_legend().set_visible(False)8 所有默认设置
字体: 英文Times Times New Roman
字号: 与文字大小匹配,一般设置12号
图表大小:与纸张大小匹配,换算成厘米更佳
原文链接:https://zhuanlan.zhihu.com/p/876099392
版权声明

