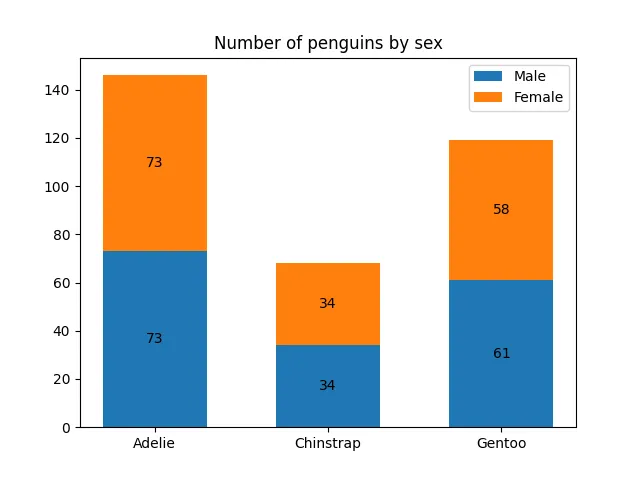
本示例展示如何使用 bar_label助手功能来创建条形图标签。下图展示三种企鹅(Adelie、Chinstrap、Gentoo)中雄性和雌性的数量。import matplotlib.pyplot as pltimport numpy as npspecies = ('Adelie', 'Chinstrap', 'Gentoo')sex_counts = { 'Male': np.array([73, 34, 61]), 'Female': np.array([73, 34, 58]),}width = 0.6 # the width of the bars: can also be len(x) sequencefig, ax = plt.subplots()bottom = np.zeros(3)for sex, sex_count in sex_counts.items(): p = ax.bar(species, sex_count, width, label=sex, bottom=bottom) bottom += sex_count ax.bar_label(p, label_type='center')ax.set_title('Number of penguins by sex')ax.legend()plt.show()
# 1. 导入库import matplotlib.pyplot as pltimport numpy as np# 2. 定义数据species = ('Adelie', 'Chinstrap', 'Gentoo') # species 是一个元组,包含三种企鹅的名称,将作为 x 轴的刻度标签。sex_counts = { 'Male':np.array([73, 34, 61]), 'Female':np.array([73, 34, 58]),}# sex_counts 是一个字典,键为性别('Male' 和 'Female'),值为对应每种企鹅的数量的 NumPy 数组。# 3. 设置条形宽度width = 0.6# 定义每个条形的宽度为 0.6(默认单位是与 x 轴刻度间距相关的相对值)。# 由于 x 轴刻度是类别(物种),宽度 0.6 会让条形在类别中心周围占据一定空间,避免过宽或过窄。# 4. 创建图形和坐标轴fig, ax = plt.subplots()# 5. 初始化堆叠基准bottom = np.zeros(3)# bottom 是一个长度为 3 的数组(与物种数量一致),用于记录每个条形当前的底部起始高度。# 初始为全 0,表示第一个绘制的性别将从 0 开始绘制。# 6. 循环绘制堆叠条形for sex, sex_count in sex_counts.items(): # 遍历字典中的每个性别及其对应的数量数组。注意字典在 Python 3.7+ 中保持插入顺序 p = ax.bar(species, sex_count, width, label=sex, bottom=bottom) # ax.bar() 绘制条形图: # species:x 轴位置(类别)。 # sex_count:每个条形的高度(即该性别对应物种的数量)。 # width:条形宽度。 # label=sex:设置图例标签,用于后续 legend()。 # bottom=bottom:关键参数,指定每个条形的底部起始高度。 # 第一次循环时 bottom 为 [0,0,0],所以雄性条形从 0 开始绘制; # 第二次循环时 bottom 已经更新为第一次的高度(即雄性数量),因此雌性条形会从雄性条形顶部开始绘制,实现堆叠效果。 bottom += sex_count # 将当前性别的数量累加到 bottom 上,作为下一个性别条形的底部起始高度。 ax.bar_label(p, label_type='center') # 添加数值标签:在条形中心位置显示该条形的数值。 # p 是 ax.bar() 返回的 BarContainer 对象,包含了所有绘制的条形; # bar_label 是 matplotlib 3.4.0 引入的便捷方法,可以自动在条形上添加标签, # label_type='center' 表示标签位于条形内部中心(也可选 'edge' 放在边缘)。# 7. 设置标题和图例ax.set_title('Number of penguins by sex') # 设置图表标题为 "Number of penguins by sex"ax.legend() # 显示图例# 8. 显示图形plt.show()

 10个月宝宝每天需要喝多少奶粉?
