
机制图
经常看到这样的机制示意图(Mechanism Diagram) 或 概念模型图(Conceptual Model Diagram),用于直观展示某种气候或天气现象的物理过程、遥相关路径及其影响机制。
看起来挺好玩的:
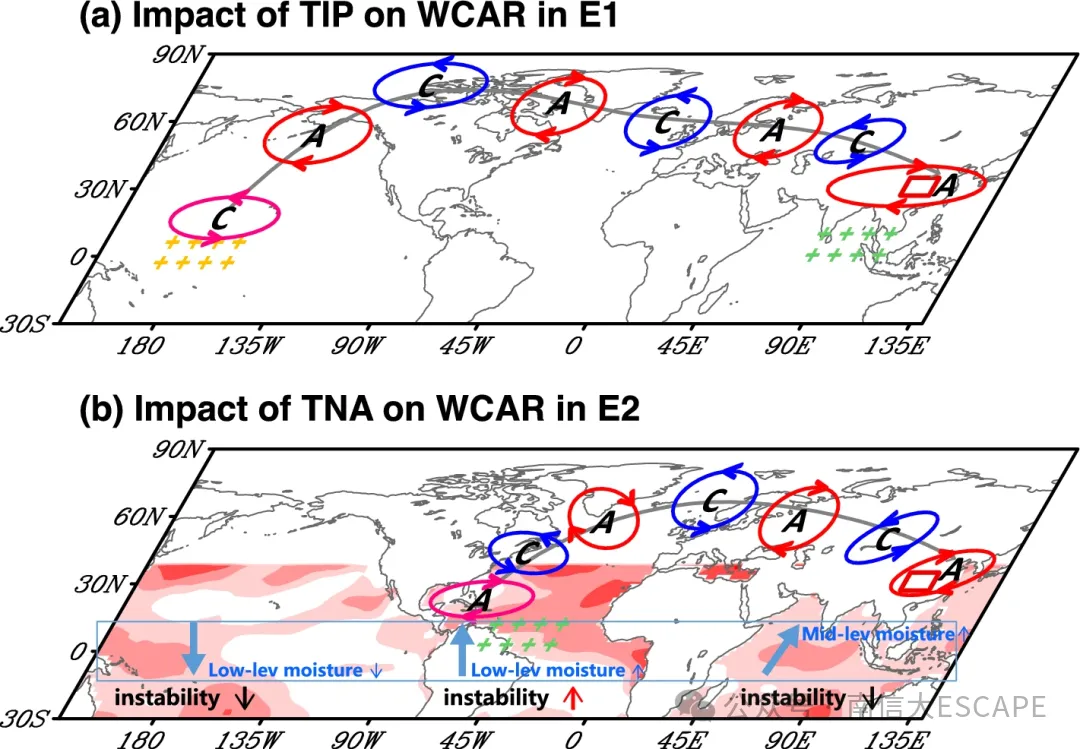 遥相关
遥相关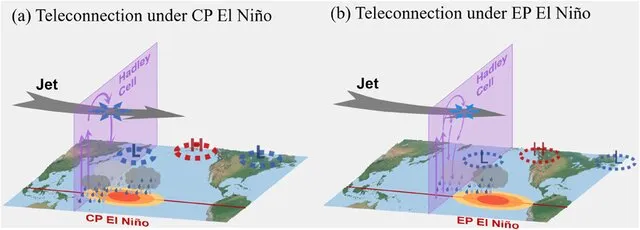 概念图
概念图Python
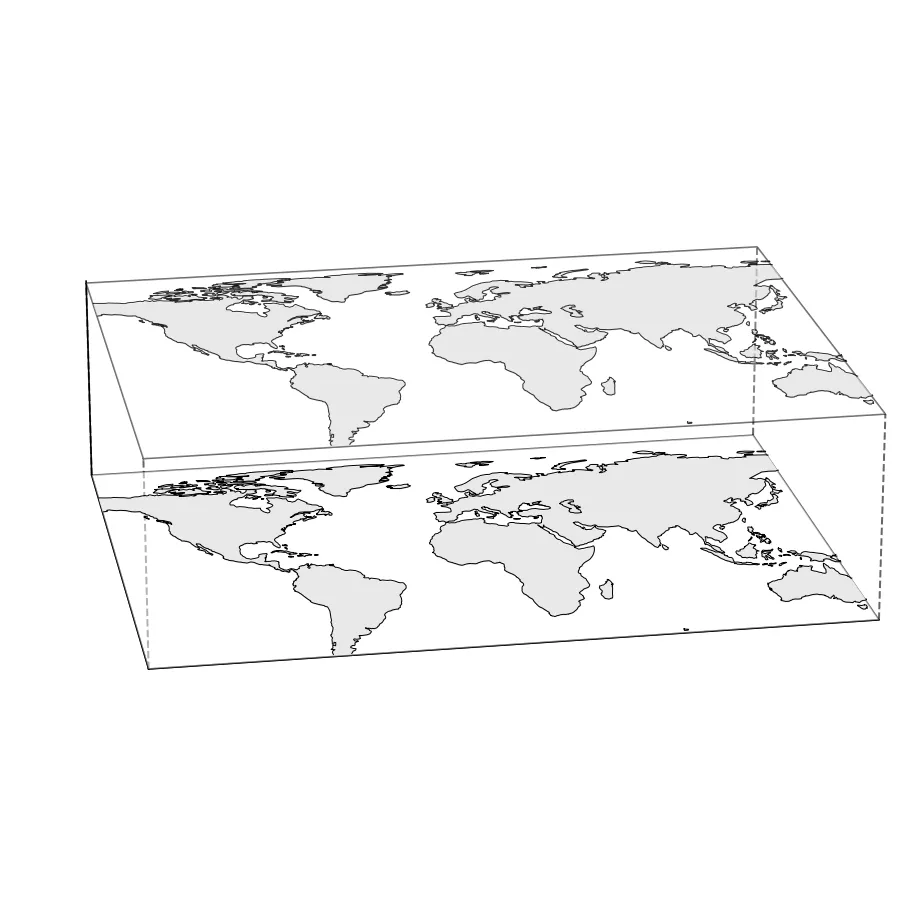
可以用Python先绘制底图,之后使用PPT或者PS加上箭头。
绘制底图的代码如下:
import matplotlib.pyplot as pltfrom mpl_toolkits.mplot3d.art3d import Poly3DCollectionimport cartopy.feature as cfeatureimport numpy as npfrom shapely.geometry import ( Polygon, MultiPolygon, box, LineString, MultiLineString, GeometryCollection,)def_shift_longitudes(lons, central_longitude: float):"""Shift longitudes so that central_longitude becomes the visual center. Input can be any sequence; output is a NumPy array in [-180, 180]. """ lons_arr = np.asarray(lons, dtype=float)return (lons_arr - central_longitude + 180.0) % 360.0 - 180.0def_extract_polygons(geom):"""Return a list of Polygon objects from a mixed geometry."""if isinstance(geom, Polygon):return [geom]if isinstance(geom, (MultiPolygon, GeometryCollection)):return [g for g in geom.geoms if isinstance(g, Polygon)]return []def_extract_lines(geom):"""Return a list of LineString objects from a mixed geometry."""if isinstance(geom, LineString):return [geom]if isinstance(geom, (MultiLineString, GeometryCollection)):return [g for g in geom.geoms if isinstance(g, LineString)]return []def_split_line_on_wrap(x, y, jump_threshold: float = 180.0):"""Split a polyline where shifted longitudes jump across the map seam.""" x_arr = np.asarray(x, dtype=float) y_arr = np.asarray(y, dtype=float)if x_arr.size <= 1:return [(x_arr, y_arr)] segments = [] start = 0for i in range(1, len(x_arr)):if abs(x_arr[i] - x_arr[i - 1]) > jump_threshold:if i - start >= 2: segments.append((x_arr[start:i], y_arr[start:i])) start = iif len(x_arr) - start >= 2: segments.append((x_arr[start:], y_arr[start:]))return segmentsdefcreate_land_polygons_layer( z_pos, facecolor, alpha, edgecolor, clip_box, central_longitude: float = 0.0):"""Create land polygons (clipped by clip_box) as a Poly3DCollection at height z_pos.""" land_feature = cfeature.NaturalEarthFeature("physical", "land", "110m") polys_3d = []for geom in land_feature.geometries():ifnot geom.intersects(clip_box):continuefor poly in _extract_polygons(geom.intersection(clip_box)):ifnot poly.is_valid:continue x, y = poly.exterior.xy x = _shift_longitudes(x, central_longitude) verts = list(zip(x, y, [z_pos] * len(x))) polys_3d.append(verts)return Poly3DCollection( polys_3d, facecolors=facecolor, edgecolors=edgecolor, alpha=alpha )defdraw_background_layer(ax, z_pos, x_range, y_range, color, alpha=0.5):"""Draw a rectangular background layer at height z_pos.""" xx, yy = np.meshgrid( [x_range[0], x_range[1]], [y_range[0], y_range[1]], ) zz = np.full(xx.shape, z_pos) ax.plot_surface(xx, yy, zz, color=color, alpha=alpha, shade=False)defdraw_coastline_layer( ax, z_pos, clip_box, linewidth, alpha, central_longitude: float = 0.0):"""Draw a coastline layer at height z_pos, clipped by clip_box.""" coastline_feature = cfeature.NaturalEarthFeature("physical","coastline","110m", edgecolor="black", facecolor="none", )for geom in coastline_feature.geometries():ifnot geom.intersects(clip_box):continuefor line in _extract_lines(geom.intersection(clip_box)):if line.is_empty:continue x, y = line.coords.xy x = _shift_longitudes(x, central_longitude)for x_seg, y_seg in _split_line_on_wrap(x, y): ax.plot( x_seg, y_seg, [z_pos] * len(x_seg), color="k", linewidth=linewidth, alpha=alpha, zorder=10, )defmain( show_lonlat_labels: bool = True, central_longitude: float = 0.0, show_frame: bool = False,): fig = plt.figure(figsize=(12, 8)) ax = fig.add_subplot(111, projection="3d")# Global lon/lat limits x_lim = (-150, 150) # longitude y_lim = (-50, 90) # latitude clip_box = box(x_lim[0], y_lim[0], x_lim[1], y_lim[1])# Base heights for the two layers (fixed gap) z_bottom = 0.0 z_top = 200.0# Small vertical offsets so background / land / coastline are not coplanar z_bottom_bg = z_bottom z_bottom_land = z_bottom + 1 z_bottom_coast = z_bottom + 2 z_top_bg = z_top z_top_land = z_top + 1 z_top_coast = z_top + 2# Bottom layer: white background + light-gray land + coastlines draw_background_layer(ax, z_bottom_bg, x_lim, y_lim, color="white", alpha=0.5) bottom_land = create_land_polygons_layer( z_bottom_land, facecolor="lightgray", edgecolor="none", alpha=1.0, clip_box=clip_box, central_longitude=central_longitude, ) ax.add_collection3d(bottom_land) draw_coastline_layer( ax, z_bottom_coast, clip_box, linewidth=0.5, alpha=1.0, central_longitude=central_longitude, )# Top layer: white background + light-gray land + coastlines draw_background_layer(ax, z_top_bg, x_lim, y_lim, color="white", alpha=0.2) top_land = create_land_polygons_layer( z_top_land, facecolor="lightgray", edgecolor="none", alpha=0.6, clip_box=clip_box, central_longitude=central_longitude, ) ax.add_collection3d(top_land) draw_coastline_layer( ax, z_top_coast, clip_box, linewidth=0.5, alpha=0.8, central_longitude=central_longitude, )# 3D frame (optional)if show_frame: corners = [ (x_lim[0], y_lim[0]), (x_lim[1], y_lim[0]), (x_lim[1], y_lim[1]), (x_lim[0], y_lim[1]), ]for x, y in corners: ax.plot( [x, x], [y, y], [z_bottom, z_top],"k--", linewidth=1.0, alpha=0.6, )for z in (z_bottom, z_top): xs = [c[0] for c in corners] + [corners[0][0]] ys = [c[1] for c in corners] + [corners[0][1]] ax.plot(xs, ys, [z] * 5, "k-", linewidth=0.8, alpha=0.6)# Axis limits ax.set_xlim(x_lim) ax.set_ylim(y_lim) ax.set_zlim(z_bottom_bg, z_top_coast)# Show or hide the default 3D axes frameif show_frame: ax.set_axis_on()else: ax.set_axis_off()# Custom lon/lat tick labels (drawn on bottom edges) x_ticks = np.arange(-150, 151, 60) y_ticks_geo = np.arange(-50, 91, 30) degree = "\u00B0" x_labels = []for x_plot in x_ticks: lon_geo = ((x_plot + central_longitude + 180.0) % 360.0) - 180.0 deg = abs(int(lon_geo))if lon_geo < 0: label = f"{deg}{degree}W"elif lon_geo > 0: label = f"{deg}{degree}E"else: label = f"0{degree}" x_labels.append(label) y_labels_geo = []for lat in y_ticks_geo: deg = abs(int(lat))if lat < 0: label = f"{deg}{degree}S"elif lat > 0: label = f"{deg}{degree}N"else: label = f"0{degree}" y_labels_geo.append(label)if show_lonlat_labels:# Hide default ticks, draw custom lon/lat labels on the bottom edges ax.set_xticks([]) ax.set_xticklabels([]) ax.set_yticks([]) ax.set_yticklabels([]) ax.set_zticks([]) ax.set_zticklabels([])for x_val, label in zip(x_ticks, x_labels): ax.text( x_val, y_lim[0] - 5, z_bottom, label, ha="center", va="top", fontsize=9, color="black", zorder=30, )for y_val, label in zip(y_ticks_geo, y_labels_geo): ax.text( x_lim[0] - 10, y_val, z_bottom, label, ha="right", va="center", fontsize=9, color="black", zorder=30, )else: ax.set_xticks([]) ax.set_xticklabels([]) ax.set_yticks([]) ax.set_yticklabels([]) ax.set_zticks([]) ax.set_zticklabels([])# Remove pane fills, keep only wireframe look ax.grid(False) ax.xaxis.pane.fill = False ax.yaxis.pane.fill = False ax.zaxis.pane.fill = False ax.xaxis.pane.set_edgecolor("none") ax.yaxis.pane.set_edgecolor("none") ax.zaxis.pane.set_edgecolor("none") ax.view_init(elev=20, azim=-100) ax.set_box_aspect((1.33, 1, 0.4)) plt.show()if __name__ == "__main__": main(show_lonlat_labels=False, show_frame=True)
使用用法
main(show_lonlat_labels=False, show_frame=True)
显示:
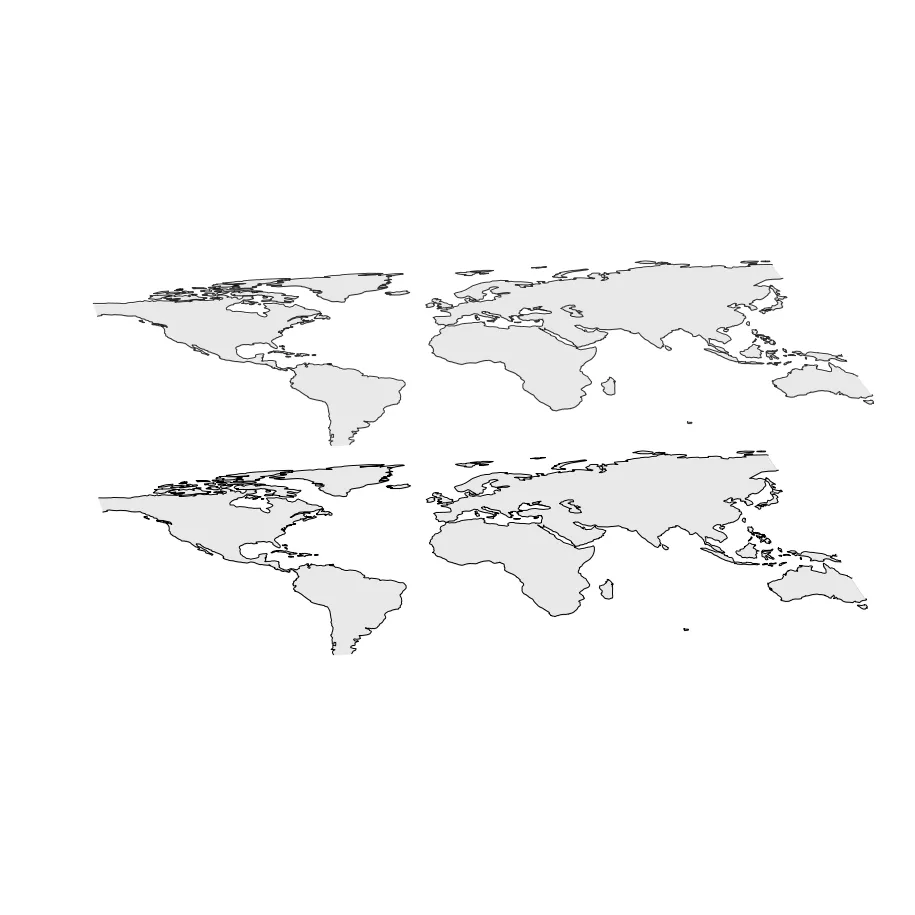
若不想要显示frame,则可以:
main(show_lonlat_labels=False, show_frame=False)
可以根据需要,修改代码,之后再微调。
Reference
Lu R, Zhu Z, Yeh SW, Shao L. Basin shift of tropical convection impact on the Western China Autumn Rainfall interannual variability. Climate Dynamics, 62, 10621–10633 (2024). https://doi.org/10.1007/s00382-024-07466-x
Effect of Regional Hadley Circulation-Subtropical Jet Interaction: The Amplification of Central-Pacific ENSO-Induced Teleconnection Pattern. https://doi.org/10.1029/2025GL115344
往期回顾

