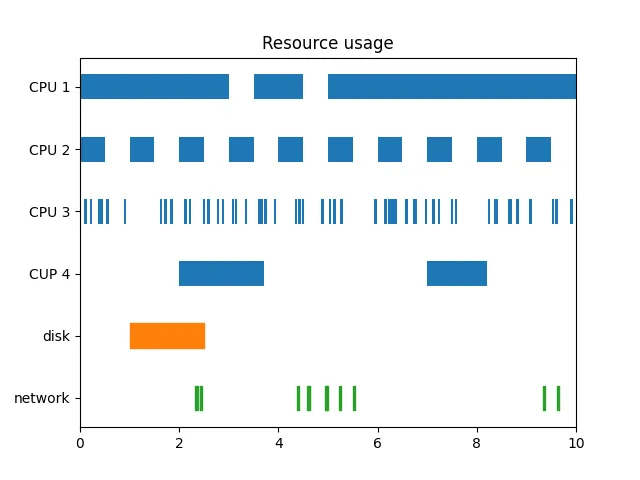
import matplotlib.pyplot as pltimport numpy as np# data is a sequence of (start, duration) tuplescpu_1 = [(0, 3), (3.5, 1), (5, 5)]cpu_2 = np.column_stack([np.linspace(0, 9, 10), np.full(10, 0.5)])cpu_3 = np.column_stack([10*np.random.random(61), np.full(61, 0.05)])cpu_4 = [(2, 1.7), (7, 1.2)]disk = [(1, 1.5)]network = np.column_stack([10*np.random.random(10), np.full(10, 0.05)])fig, ax = plt.subplots()# broken_barh(xranges, (ymin, height))ax.broken_barh(cpu_1, (-0.2, 0.4))ax.broken_barh(cpu_2, (0.8, 0.4))ax.broken_barh(cpu_3, (1.8, 0.4))ax.broken_barh(cpu_4, (2.8, 0.4))ax.broken_barh(disk, (3.8, 0.4), color="tab:orange")ax.broken_barh(network, (4.8, 0.4), color="tab:green")ax.set_xlim(0, 10)ax.set_yticks(range(6), labels=["CPU 1", "CPU 2", "CPU 3", "CPU 4", "disk", "network"])ax.invert_yaxis()ax.set_title("Resource usage")plt.show()
# 1. 导入库import matplotlib.pyplot as pltimport numpy as np# 2. 定义数据cpu_1 = [(0, 3), (3.5, 1), (5, 5)] # 手动定义的元组列表,表示三个时间段:0-3、3.5-4.5、5-10。cpu_2 = np.column_stack([np.linspace(0, 9, 10), np.full(10, 0.5)])# 使用 np.linspace(0, 9, 10) 生成 10 个等间隔的起始时间(0,1,...,9),# 配合 np.full(10, 0.5) 表示每个时段的持续时间为 0.5。# np.column_stack 将两列合并为形状 (10, 2) 的数组,代表 10 个不重叠的时间段。cpu_3 = np.column_stack([10*np.random.random(61), np.full(61, 0.05)])# 10*np.random.random(61) 生成 61 个 [0,10) 内的随机起始时间,# np.full(61, 0.05) 表示每个时段持续 0.05 时间单位。# 这样得到 61 个随机分布的时间段。cpu_4 = [(2, 1.7), (7, 1.2)] # 两个手动定义的时间段:2-3.7 和 7-8.2。disk = [(1, 1.5)] # 一个时间段:1-2.5network = np.column_stack([10*np.random.random(10), np.full(10, 0.05)])# 10 个随机起始时间,每个持续 0.05 时间单位。# 3. 创建图形和坐标轴fig, ax = plt.subplots()# 4. 绘制水平间断条形图(broken_barh)ax.broken_barh(cpu_1, (-0.2, 0.4))# ax.broken_barh() 用于绘制水平方向上的间断条形,非常适合表示不同时间段的占用情况。# 第一个参数 xranges:时间段列表,格式为 [(start1, duration1), (start2, duration2), ...]。# 第二个参数 (ymin, height):指定该组条形在 y 轴上的垂直位置和高度。# 这里的 ymin 是条形底部的 y 坐标,height 是条形的厚度。# 代码中将每个资源放在不同的 y 位置,且高度统一为 0.4,使各资源水平条带在垂直方向上有间隔。# 未指定颜色的条形使用默认颜色(通常为蓝色)。ax.broken_barh(cpu_2, (0.8, 0.4))ax.broken_barh(cpu_3, (1.8, 0.4))ax.broken_barh(cpu_4, (2.8, 0.4))ax.broken_barh(disk, (3.8, 0.4), color='tab:orange')ax.broken_barh(network, (4.8, 0.4), color='tab:green')# 5. 设置坐标轴范围与标签ax.set_xlim(0, 10) # x 轴范围设为 0 到 10,覆盖所有时间段。ax.set_yticks(range(6), labels=["CPU 1", "CPU 2", "CPU 3", "CUP 4", "disk", "network"])# 设置 y 轴刻度位置为 0,1,2,3,4,5,并分别对应资源名称。# 注意:因为每个资源条带的 y 中心位置是 ymin + height/2,即分别为 0, 1, 2, 3, 4, 5(偏移计算:-0.2+0.2=0, 0.8+0.2=1, ...)。# 所以刻度位置恰好对准每个条带中心。ax.invert_yaxis() # 反转 y 轴,使顶部显示第一个资源(CPU 1),底部显示最后一个资源(network),符合从上到下的阅读顺序。ax.set_title("Resource usage") # 设置图表标题。# 6. 显示图形plt.show()

 10个月宝宝每天需要喝多少奶粉?
