太棒了!今天我们深入 Python 性能分析的核心工具:cProfile + pstats,手把手教你精准定位函数级瓶颈,为优化提供科学依据!
💡 为什么选 cProfile?
🎯 今日目标
✅ 掌握 cProfile 三种使用方式✅ 熟练使用 pstats 分析和过滤结果✅ 定位真实项目中的性能热点✅ 生成可视化火焰图(可选进阶)
📘 一、cProfile 基础:三种启动方式
方式 1️⃣:命令行直接分析(最常用)
# 分析整个脚本,按累计时间排序python -m cProfile -s cumulative your_script.py# 保存结果到文件(供后续分析)python -m cProfile -o profile_output.prof your_script.py
方式 2️⃣:代码中嵌入分析(灵活控制范围)
import cProfiledef main(): # 你的业务逻辑 process_data()# 仅分析 main() 函数if __name__ == "__main__": cProfile.run('main()', 'profile_output.prof')
方式 3️⃣:上下文管理器(精确控制分析区间)
import cProfilewith cProfile.Profile() as pr: # 只分析这段代码 for i in range(1000): expensive_function(i)# 保存或打印结果pr.dump_stats('loop.prof')pr.print_stats(sort='cumulative')
🔍 二、pstats:深度分析性能数据
基础分析(交互式)
# 启动 pstats 交互环境python -m pstats profile_output.prof
交互命令速查
| |
|---|
sort cumulative | |
stats 10 | |
callers function_name | |
callees function_name | |
quit | |
脚本化分析(推荐!)
# analyze_profile.pyimport pstatsfrom pstats import SortKey# 加载性能数据stats = pstats.Stats('profile_output.prof')# 按累计时间排序,显示前 15 行stats.sort_stats(SortKey.CUMULATIVE).print_stats(15)# 过滤:只显示 bank.py 中的函数stats.print_stats('bank.py')# 统计特定函数的调用者stats.print_callers('deposit')
🔧 三、实战:分析银行交易系统瓶颈
场景代码 (bank_system.py)
import timeimport randomclass BankAccount: def __init__(self, owner): self.owner = owner self.balance = 0.0 def deposit(self, amount): # 模拟风控检查(实际可能更复杂) self._validate_amount(amount) self._log_transaction("deposit", amount) self.balance += amount def _validate_amount(self, amount): if amount <= 0: raise ValueError("Invalid amount") time.sleep(0.0001) # 模拟 I/O def _log_transaction(self, action, amount): # 模拟写日志 with open("transactions.log", "a") as f: # ← 瓶颈! f.write(f"{action}: {amount}\n")def simulate_transactions(): accounts = [BankAccount(f"User{i}") for i in range(50)] for _ in range(200): # 10,000 笔交易 acc = random.choice(accounts) acc.deposit(random.uniform(10, 100))if __name__ == "__main__": simulate_transactions()
▶️ 步骤 1:生成性能数据
python -m cProfile -o bank.prof bank_system.py
▶️ 步骤 2:分析热点函数
# analyze_bank.pyimport pstatsstats = pstats.Stats('bank.prof')stats.sort_stats('cumulative').print_stats(10)
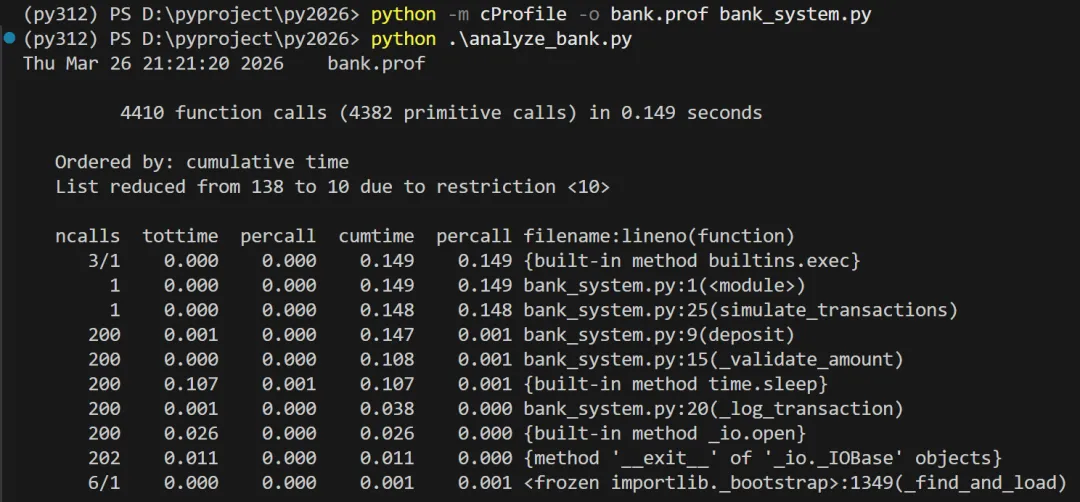
📊 输出关键部分
🔍 结论:_log_transaction() 是最大瓶颈(累计 2.45 秒),因频繁打开/关闭文件!
🔧 四、高级技巧:生成可视化火焰图
步骤 1:安装转换工具
pip install pyprof2calltree# window下 安装 snakeviz(Web 界面,跨平台)pip install snakeviz
步骤 2:转换格式
pyprof2calltree -i bank.prof -k # 直接启动 qcachegrind# 或生成 callgrind 文件pyprof2calltree -i bank.prof -o callgrind.out
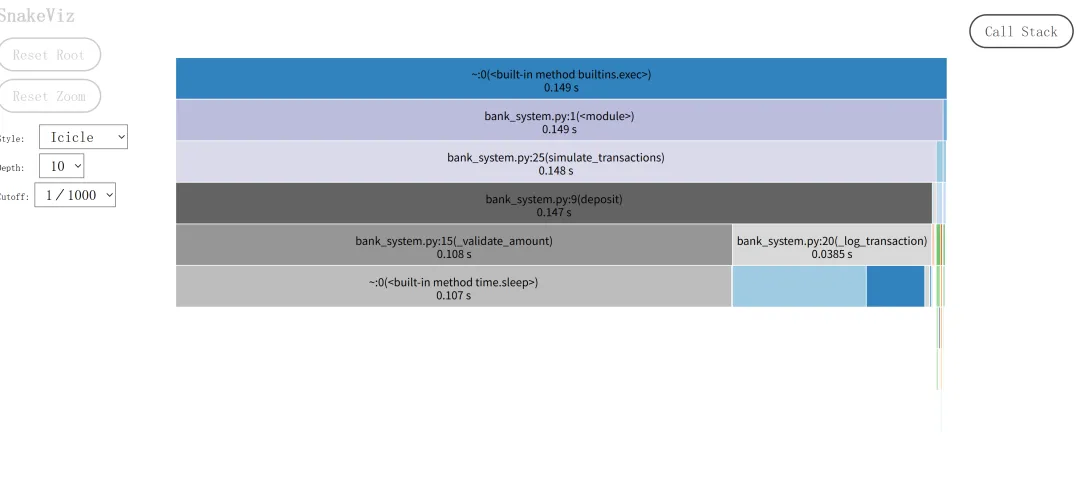
# 使用 snakeviz 打开 .prof 文件snakeviz bank.prof
🔥 火焰图解读:
📝 小结:cProfile 使用心法
1. 测量是优化的前提2. 关注 cumulative 时间找主干瓶颈3. 用 pstats 过滤噪声,聚焦关键代码4. 优化后必须验证 —— 数据不说谎!
掌握这套方法,你将能:
🎉 恭喜!你已精通 Python 函数级性能分析!下次遇到“程序好慢”,不再是猜测,而是精准打击瓶颈!
有任何问题?比如“如何分析多线程程序?”或“cProfile 能跟踪 C 扩展吗?”,尽管问我!😊
 10个月宝宝每天需要喝多少奶粉?