别再手工跑 DID 了!一文讲清Python 的双重差分实现(含平行趋势检验)
- 2026-07-04 11:18:21
别再手工跑 DID 了!一文讲清Python 的双重差分实现(含平行趋势检验)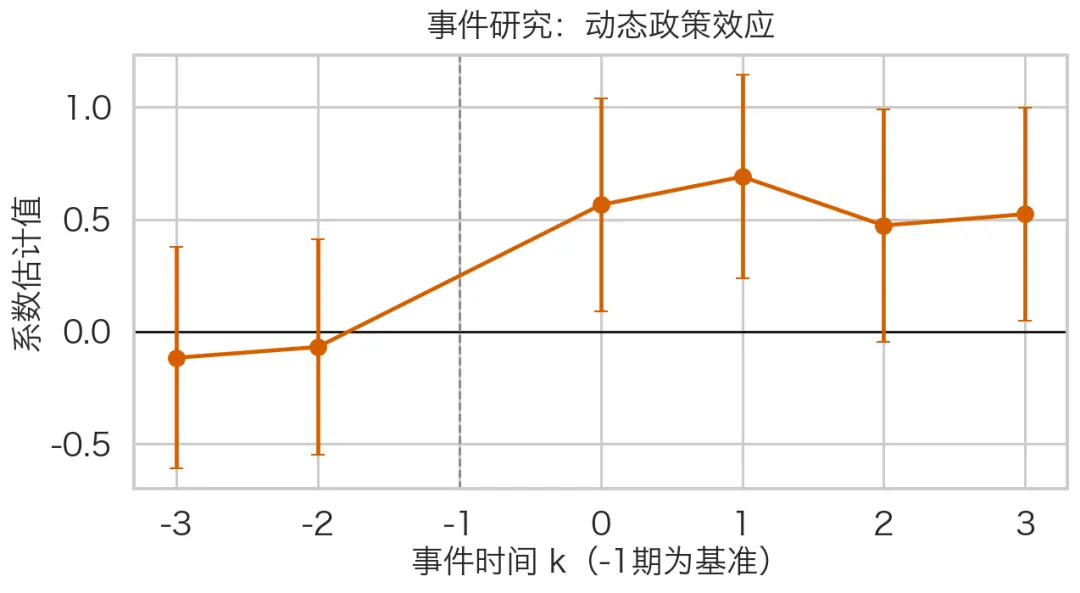
DID 是什么
DID(Difference-in-Differences,双重差分)用于评估“某项政策/冲击”带来的因果影响。核心思路是比较两次差值:
• 第一次差分:同一个组在政策前后变化了多少 • 第二次差分:处理组的变化再减去对照组的变化
如果处理组在政策后“多出来”的那部分变化显著,就可以把它解释为政策效应。
DID 为什么能识别因果
DID 的关键识别假设是“平行趋势”:
• 如果没有政策,处理组和对照组本应沿着相似趋势变化 • 政策实施后,处理组相对对照组出现额外变化,这部分就是政策影响
实证中通常做两件事:
• 基准 DID 回归(估计平均政策效应) • 事件研究(Event Study)检验政策前趋势是否平行,并展示动态效应
DID 的标准模型
变量含义:
• :被解释变量 • :处理组虚拟变量(处理组=1,对照组=0) • :政策后虚拟变量(政策后=1,政策前=0) • :DID 核心交互项 • :控制变量 • :个体固定效应 • :时间固定效应
其中 就是最关注的政策效应。
实操前数据检查清单
• 必须有 id(个体)和year(时间)两个维度• treat要有组间差异(不能全是 0 或全是 1)• post要有时期间差异(不能全是 0 或全是 1)• 建议使用个体聚类标准误(cluster by id)
Python 完整实现(可直接运行)
import osimport numpy as npimport pandas as pdimport statsmodels.formula.api as smfimport matplotlib as mplimport matplotlib.pyplot as pltimport seaborn as snsfrom matplotlib import font_manager as fm# ========= 0) 主题与中文字体 =========sns.set_theme(style="whitegrid", context="talk")def setup_cn_font(): candidate_paths = [ "/System/Library/Fonts/Hiragino Sans GB.ttc", "/System/Library/Fonts/Supplemental/Songti.ttc", "/Library/Fonts/Arial Unicode.ttf", "/System/Library/Fonts/STHeiti Light.ttc", ] chosen_path = None for p in candidate_paths: if os.path.exists(p): fm.fontManager.addfont(p) chosen_path = p break if chosen_path is None: raise RuntimeError("未找到可用中文字体,请先安装中文字体(如 Hiragino/Songti/Noto Sans CJK)。") chosen_name = fm.FontProperties(fname=chosen_path).get_name() mpl.rcParams["font.family"] = "sans-serif" mpl.rcParams["font.sans-serif"] = [chosen_name] mpl.rcParams["axes.unicode_minus"] = False mpl.rcParams["pdf.fonttype"] = 42 mpl.rcParams["ps.fonttype"] = 42 print(f"Using Chinese font: {chosen_name} ({chosen_path})") return fm.FontProperties(fname=chosen_path)CN_FONT = setup_cn_font()# ========= 1) 构造示例数据 =========np.random.seed(42)n_id = 120years = np.arange(2015, 2023)policy_year = 2019rows = []for i in range(n_id): treat = 1 if i < n_id // 2 else 0 alpha_i = np.random.normal(0, 1) for y in years: post = 1 if y >= policy_year else 0 x1 = np.random.normal(0, 1) x2 = np.random.normal(0, 1) tau = 0.8 eps = np.random.normal(0, 1) y_out = 2 + alpha_i + 0.2*(y-2015) + tau*(treat*post) + 0.5*x1 - 0.3*x2 + eps rows.append([i, y, treat, post, x1, x2, y_out])df = pd.DataFrame(rows, columns=["id", "year", "treat", "post", "x1", "x2", "y"])df["did"] = df["treat"] * df["post"]# ========= 2) 基准 DID =========model = smf.ols("y ~ did + x1 + x2 + C(id) + C(year)", data=df).fit( cov_type="cluster", cov_kwds={"groups": df["id"]})key_vars = ["did", "x1", "x2"]result_table = pd.DataFrame({ "coef": model.params[key_vars], "std_err": model.bse[key_vars], "p_value": model.pvalues[key_vars]})print("\n=== 基准回归核心结果 ===")print(result_table)# ========= 3) 事件研究 =========df["rel_year"] = df["year"] - policy_yeardef ev_name(k): return f"event_m{abs(k)}" if k < 0 else f"event_p{k}"for k in range(-3, 4): if k != -1: col = ev_name(k) df[col] = ((df["rel_year"] == k) & (df["treat"] == 1)).astype(int)event_cols = [ev_name(k) for k in range(-3, 4) if k != -1]formula_es = "y ~ " + " + ".join(event_cols) + " + x1 + x2 + C(id) + C(year)"es_model = smf.ols(formula_es, data=df).fit( cov_type="cluster", cov_kwds={"groups": df["id"]})# ========= 4) 事件研究图 =========ks = [k for k in range(-3, 4) if k != -1]coef = np.array([es_model.params.get(ev_name(k), np.nan) for k in ks])se = np.array([es_model.bse.get(ev_name(k), np.nan) for k in ks])fig, ax = plt.subplots(figsize=(9, 5), dpi=150)ax.axhline(0, color="black", linewidth=1.2)ax.axvline(-1, color="gray", linestyle="--", linewidth=1.2)ax.errorbar(ks, coef, yerr=1.96*se, fmt="o-", capsize=4, color="#D55E00")ax.set_title("事件研究:动态政策效应", fontproperties=CN_FONT, pad=10)ax.set_xlabel("事件时间 k(-1期为基准)", fontproperties=CN_FONT)ax.set_ylabel("系数估计值", fontproperties=CN_FONT)for t in ax.get_xticklabels() + ax.get_yticklabels(): t.set_fontproperties(CN_FONT)fig.tight_layout()fig.savefig("event_study.png", dpi=300, bbox_inches="tight")plt.show()# ========= 5) 核心系数图 =========coef_df = pd.DataFrame({ "变量": ["DID效应", "控制变量 x1", "控制变量 x2"], "coef": [model.params["did"], model.params["x1"], model.params["x2"]], "se": [model.bse["did"], model.bse["x1"], model.bse["x2"]]})coef_df["ci_low"] = coef_df["coef"] - 1.96 * coef_df["se"]coef_df["ci_high"] = coef_df["coef"] + 1.96 * coef_df["se"]fig, ax = plt.subplots(figsize=(8.5, 4.8), dpi=150)ypos = np.arange(len(coef_df))ax.errorbar( coef_df["coef"], ypos, xerr=[coef_df["coef"] - coef_df["ci_low"], coef_df["ci_high"] - coef_df["coef"]], fmt="o", capsize=5, color="#0072B2", ecolor="#56B4E9")ax.axvline(0, color="black", linewidth=1.1)ax.set_yticks(ypos)ax.set_yticklabels(coef_df["变量"], fontproperties=CN_FONT)ax.set_xlabel("系数估计值", fontproperties=CN_FONT)ax.set_title("核心回归系数(95%置信区间)", fontproperties=CN_FONT, pad=10)for t in ax.get_xticklabels(): t.set_fontproperties(CN_FONT)fig.tight_layout()fig.savefig("did_key_results.png", dpi=300, bbox_inches="tight")plt.show()print("\n图片已保存:event_study.png, did_key_results.png")结果怎么解读
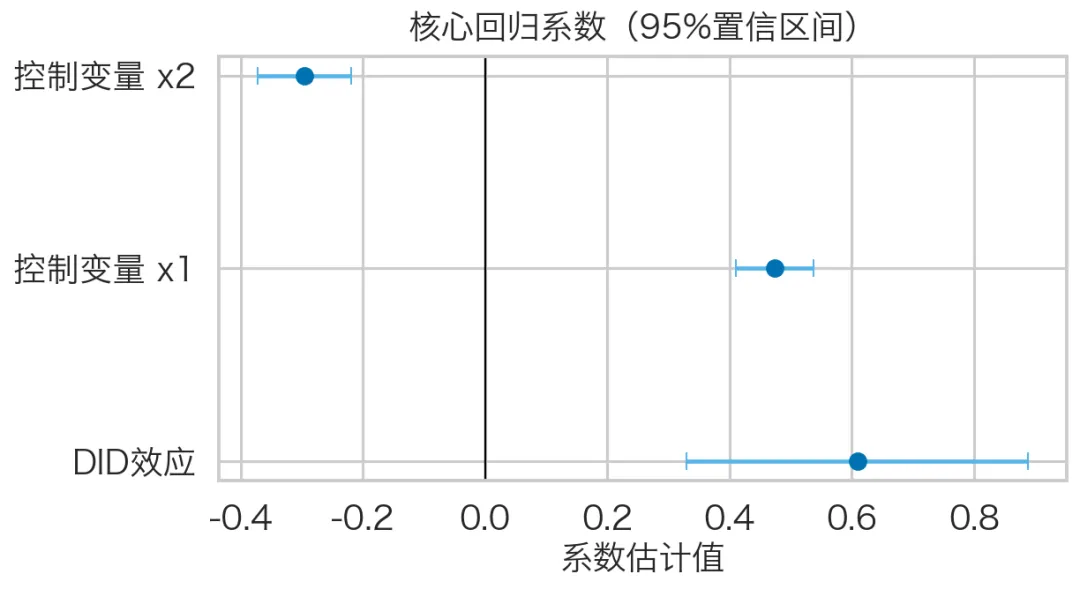
• did系数显著为正:政策使结果变量上升• did系数显著为负:政策使结果变量下降• 事件研究中,政策前各期系数应尽量接近 0:说明平行趋势较好 • 政策后系数若逐步偏离 0:说明存在动态效应
常见报错与处理
• 报错 PatsyError: numbers besides '0' and '1' are only allowed with **原因通常是列名含event_-3这种负号命名。解决:改成event_m3、event_p0这类命名。• 警告 covariance of constraints does not have full rank在“固定效应很多 + 聚类标准误”时较常见,通常不影响核心系数读取。建议重点查看did、x1、x2的系数、标准误和 p 值。
结果
替换成你的真实数据
• 把示例数据构造部分换成 df = pd.read_csv("你的数据.csv")• 保证至少有 id, year, treat, post, y这些字段• 再运行同一套回归与画图代码即可
结语
DID 难点不在公式本身,而在于数据组织、模型设定和结果表达是否规范。把这套流程跑顺后,你就能快速迁移到真实课题,稳定产出可复现的实证结果。
完整代码:https://www.ppmandata.cn/codeBase/2029458496147169295
⬇️点击阅读原文可直接跳转
本文来自网友投稿或网络内容,如有侵犯您的权益请联系我们删除,联系邮箱:wyl860211@qq.com 。
随机文章
-
 10个月宝宝每天需要喝多少奶粉?
- Linux 内核拥抱 AI:连 Linus 都开始用 Claude 写代码了?
- Linux 7.0为键盘启用3个新AI专用按键
- Valve改进Linux显存管理;南亚科技:DRAM 内存 2026Q1 平均售价环比增幅超 70%;慧荣科技预计202
- 强烈建议收藏!这个python网站我愿称之为2026年度最伟大发现
- python编程第2课《神奇的线》
- Python 核心语法(变量 + 数字 + 布尔 + 字符串 + 类型转换)
- Scratch vs Python vs C++:小学生入门该选哪个?
- Linux内核7.0正式发布!
- Linux发行版 Trisquel 12 发布!
- Arch Linux的可视化软件包管理器-Shelly
