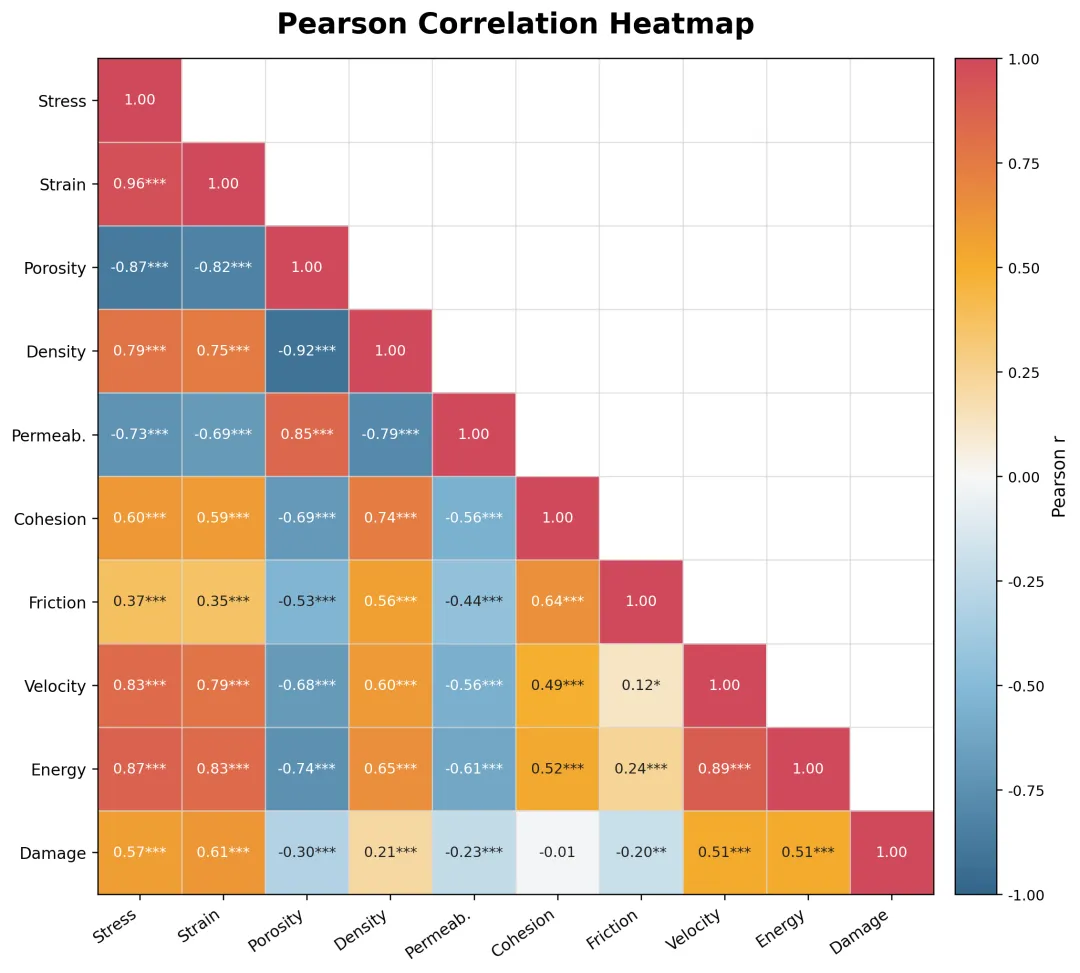
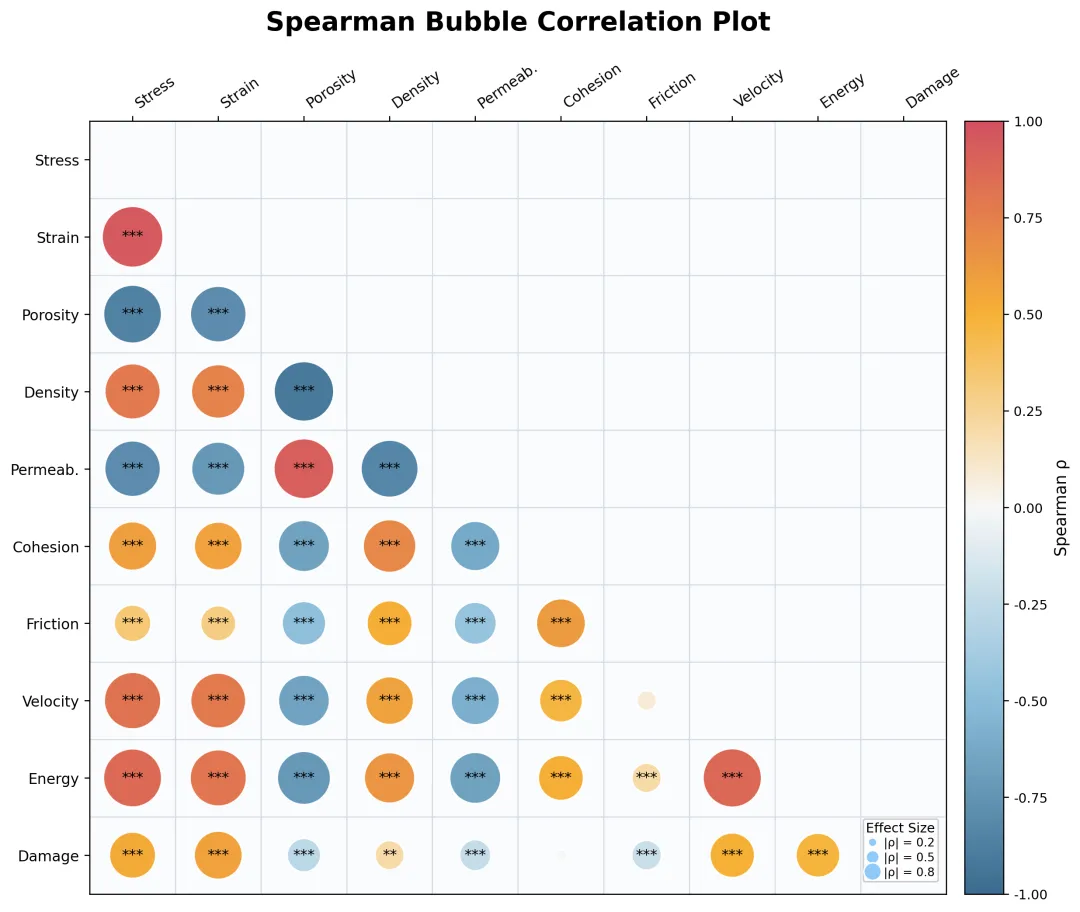
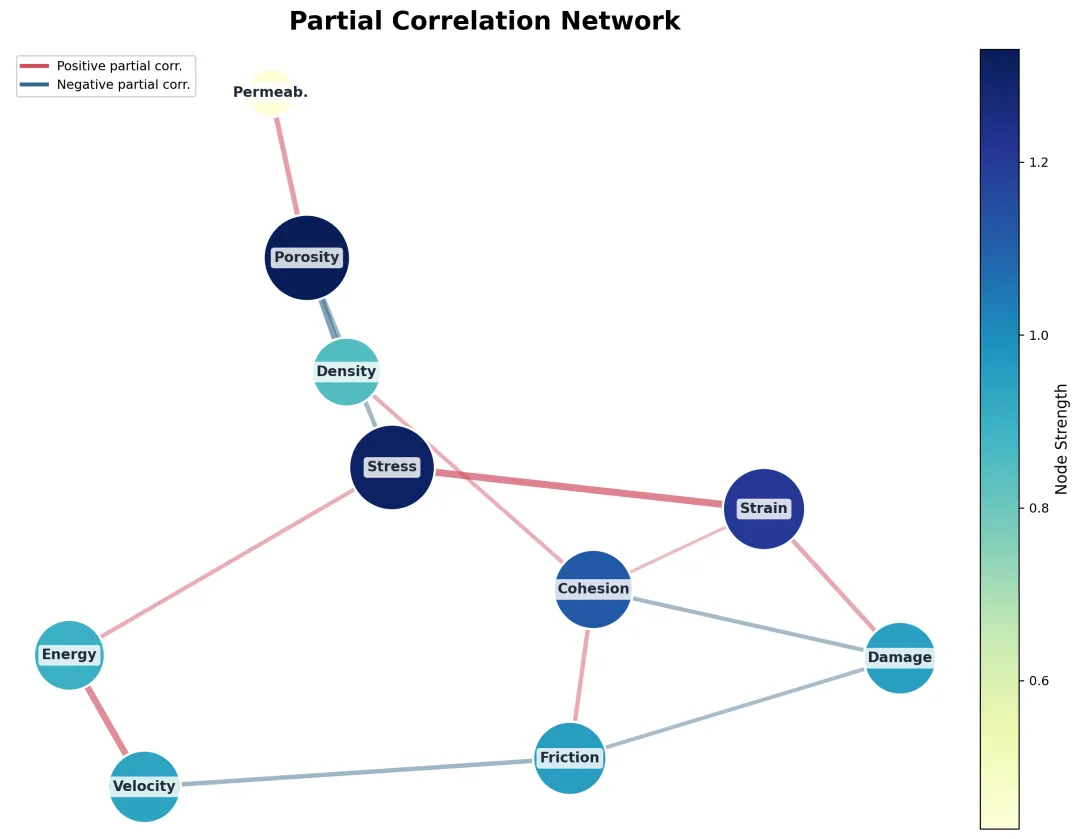
import osimport numpy as npimport pandas as pdimport matplotlib.pyplot as pltimport matplotlib as mplfrom matplotlib.colors import LinearSegmentedColormap, TwoSlopeNorm, Normalizefrom matplotlib.lines import Line2Dfrom scipy import statsimport networkx as nxOUTDIR = "correlation_analysis_output"os.makedirs(OUTDIR, exist_ok=True)plt.rcParams["font.family"] = "DejaVu Sans"plt.rcParams["axes.unicode_minus"] = FalseFIG_DPI = 240corr_cmap = LinearSegmentedColormap.from_list( "corr_custom", ["#33658A", "#86BBD8", "#F7F7F7", "#F6AE2D", "#D1495B"], N=256)corr_cmap.set_bad(color="white")def generate_demo_data(n=260, seed=2026): rng = np.random.default_rng(seed) z1 = rng.normal(0, 1, n) z2 = rng.normal(0, 1, n) z3 = rng.normal(0, 1, n) stress = 1.00 * z1 + 0.20 * z2 + rng.normal(0, 0.35, n) strain = 0.82 * stress + rng.normal(0, 0.30, n) porosity = -0.68 * stress + 0.22 * z3 + rng.normal(0, 0.38, n) density = -0.72 * porosity + rng.normal(0, 0.28, n) permeability = np.exp(0.55 * porosity + rng.normal(0, 0.22, n)) # monotonic nonlinear cohesion = 0.55 * density + 0.18 * z2 + rng.normal(0, 0.35, n) friction = 0.48 * cohesion - 0.25 * z3 + rng.normal(0, 0.32, n) velocity = 0.58 * stress - 0.42 * friction + 0.20 * z2 + rng.normal(0, 0.35, n) energy = 0.64 * velocity + 0.31 * stress + rng.normal(0, 0.33, n) damage = -0.52 * cohesion + 0.63 * strain + 0.25 * z3 + rng.normal(0, 0.34, n) df = pd.DataFrame({ "Stress": stress, "Strain": strain, "Porosity": porosity, "Density": density, "Permeab.": permeability, "Cohesion": cohesion, "Friction": friction, "Velocity": velocity, "Energy": energy, "Damage": damage }) return df# 2. Correlation calculationdef correlation_and_pvalues(df, method="pearson"): cols = df.columns n = len(cols) corr = pd.DataFrame(np.eye(n), index=cols, columns=cols) pval = pd.DataFrame(np.zeros((n, n)), index=cols, columns=cols) for i in range(n): for j in range(i + 1, n): x = df.iloc[:, i] y = df.iloc[:, j] if method == "pearson": r, p = stats.pearsonr(x, y) elif method == "spearman": r, p = stats.spearmanr(x, y) else: raise ValueError("method must be 'pearson' or 'spearman'") corr.iloc[i, j] = corr.iloc[j, i] = r pval.iloc[i, j] = pval.iloc[j, i] = p return corr, pvaldef partial_correlation(df): X = (df - df.mean()) / df.std(ddof=0) X = X.values cov = np.cov(X, rowvar=False) prec = np.linalg.inv(cov) d = np.sqrt(np.diag(prec)) pcorr = -prec / np.outer(d, d) np.fill_diagonal(pcorr, 1.0) return pd.DataFrame(pcorr, index=df.columns, columns=df.columns)def sig_star(p): if p < 0.001: return "***" elif p < 0.01: return "**" elif p < 0.05: return "*" else: return ""# 3. Figure 1: Pearson heatmapdef plot_pearson_heatmap(corr, pval, save_path): data = corr.values.copy() mask = np.triu(np.ones_like(data, dtype=bool), k=1) masked = np.ma.masked_where(mask, data) fig, ax = plt.subplots(figsize=(10.2, 8.6), dpi=FIG_DPI, facecolor="white") ax.set_facecolor("white") im = ax.imshow( masked, cmap=corr_cmap, norm=TwoSlopeNorm(vmin=-1, vcenter=0, vmax=1) ) n = corr.shape[0] labels = corr.columns.tolist() ax.set_xticks(range(n)) ax.set_yticks(range(n)) ax.set_xticklabels(labels, rotation=35, ha="right", fontsize=10) ax.set_yticklabels(labels, fontsize=10) ax.set_xticks(np.arange(-.5, n, 1), minor=True) ax.set_yticks(np.arange(-.5, n, 1), minor=True) ax.grid(which="minor", color="#d9d9d9", linestyle="-", linewidth=0.8, alpha=0.8) ax.tick_params(which="minor", bottom=False, left=False) for i in range(n): for j in range(n): if i >= j: val = corr.iloc[i, j] if i == j: txt = "1.00" else: txt = f"{val:.2f}{sig_star(pval.iloc[i, j])}" text_color = "white" if abs(val) >= 0.55 else "#222222" ax.text(j, i, txt, ha="center", va="center", fontsize=9, color=text_color) ax.set_title("Pearson Correlation Heatmap", fontsize=18, pad=16, fontweight="bold") cbar = fig.colorbar(im, ax=ax, pad=0.02, fraction=0.046) cbar.set_label("Pearson r", fontsize=11) cbar.ax.tick_params(labelsize=9) plt.tight_layout() plt.savefig(save_path, bbox_inches="tight", facecolor="white") plt.show()# 4. Figure 2: Spearman bubble corrplotdef plot_spearman_bubble(corr, pval, save_path): n = corr.shape[0] labels = corr.columns.tolist() fig, ax = plt.subplots(figsize=(10.4, 8.8), dpi=FIG_DPI, facecolor="white") ax.set_facecolor("#fbfcfe") ax.set_xlim(-0.5, n - 0.5) ax.set_ylim(n - 0.5, -0.5) # grid for k in range(n + 1): ax.axhline(k - 0.5, color="#d8dee9", lw=0.9, zorder=0) ax.axvline(k - 0.5, color="#d8dee9", lw=0.9, zorder=0) norm = Normalize(vmin=-1, vmax=1) xs, ys, sizes, colors = [], [], [], [] sig_x, sig_y, sig_txt = [], [], [] for i in range(n): for j in range(n): if i > j: r = corr.iloc[i, j] p = pval.iloc[i, j] xs.append(j) ys.append(i) sizes.append(1800 * abs(r) + 40) colors.append(r) s = sig_star(p) if s: sig_x.append(j) sig_y.append(i) sig_txt.append(s) sc = ax.scatter( xs, ys, s=sizes, c=colors, cmap=corr_cmap, norm=norm, edgecolors="white", linewidths=1.0, alpha=0.96, zorder=3 ) for x, y, s in zip(sig_x, sig_y, sig_txt): ax.text(x, y, s, ha="center", va="center", fontsize=10, color="black", zorder=4) ax.set_xticks(range(n)) ax.set_yticks(range(n)) ax.set_xticklabels(labels, rotation=35, ha="left", fontsize=10) ax.set_yticklabels(labels, fontsize=10) ax.xaxis.tick_top() ax.set_title("Spearman Bubble Correlation Plot", fontsize=18, pad=20, fontweight="bold") size_vals = [0.2, 0.5, 0.8] marker_sizes = [6, 9, 12] # 这里直接控制图例圆点大小 size_handles = [ Line2D( [0], [0], marker='o', linestyle='', markerfacecolor="#90caf9", markeredgecolor="white", markeredgewidth=1.0, markersize=ms ) for ms in marker_sizes ] leg1 = ax.legend( size_handles, [f"|ρ| = {v:.1f}" for v in size_vals], title="Effect Size", loc="upper left", bbox_to_anchor=(0.90, 0.10), # 更往右下角 frameon=True, fontsize=8, title_fontsize=9, borderpad=0.25, labelspacing=0.25, handletextpad=0.5, borderaxespad=0.2, handlelength=1.0, framealpha=0.95 ) ax.add_artist(leg1) cbar = fig.colorbar(sc, ax=ax, pad=0.02, fraction=0.046) cbar.set_label("Spearman ρ", fontsize=11) cbar.ax.tick_params(labelsize=9) plt.tight_layout() plt.savefig(save_path, bbox_inches="tight", facecolor="white") plt.show()# 5. Figure 3: Partial correlation networkdef plot_partialcorr_network(pcorr, save_path, threshold=0.18): cols = pcorr.columns.tolist() G = nx.Graph() for c in cols: G.add_node(c) for i in range(len(cols)): for j in range(i + 1, len(cols)): w = pcorr.iloc[i, j] if abs(w) >= threshold: G.add_edge(cols[i], cols[j], weight=w, abs_weight=abs(w)) node_strength = {} for node in G.nodes(): strength = sum(abs(G[node][nbr]["weight"]) for nbr in G.neighbors(node)) node_strength[node] = strength vals = np.array(list(node_strength.values())) if len(vals) == 0: vals = np.array([1.0]) vmin = vals.min() vmax = vals.max() if vals.max() > vals.min() else vals.min() + 1e-6 node_cmap = mpl.cm.YlGnBu node_norm = Normalize(vmin=vmin, vmax=vmax) node_sizes = [] node_colors = [] for node in G.nodes(): s = node_strength[node] size = 1200 + 2600 * (s - vmin) / (vmax - vmin + 1e-12) node_sizes.append(size) node_colors.append(node_cmap(node_norm(s))) pos = nx.spring_layout(G, seed=42, weight="abs_weight", k=1.3 / np.sqrt(max(len(G.nodes()), 1))) fig, ax = plt.subplots(figsize=(10.8, 8.4), dpi=FIG_DPI, facecolor="white") ax.set_facecolor("#f9fbfd") for u, v, d in G.edges(data=True): w = d["weight"] color = "#d1495b" if w > 0 else "#33658A" width = 1.2 + 5.8 * abs(w) alpha = 0.25 + 0.65 * abs(w) nx.draw_networkx_edges( G, pos, edgelist=[(u, v)], width=width, edge_color=color, alpha=alpha, ax=ax ) nx.draw_networkx_nodes( G, pos, node_size=node_sizes, node_color=node_colors, edgecolors="white", linewidths=1.6, ax=ax ) nx.draw_networkx_labels( G, pos, font_size=10, font_color="#1f2937", font_weight="bold", bbox=dict(boxstyle="round,pad=0.24", facecolor="white", edgecolor="none", alpha=0.82), ax=ax ) ax.set_title("Partial Correlation Network", fontsize=18, pad=14, fontweight="bold") ax.axis("off") # legends edge_legend = [ Line2D([0], [0], color="#d1495b", lw=2.8, label="Positive partial corr."), Line2D([0], [0], color="#33658A", lw=2.8, label="Negative partial corr.") ] leg = ax.legend(handles=edge_legend, loc="upper left", frameon=True, fontsize=9) ax.add_artist(leg) sm = mpl.cm.ScalarMappable(cmap=node_cmap, norm=node_norm) sm.set_array([]) cbar = fig.colorbar(sm, ax=ax, pad=0.02, fraction=0.045) cbar.set_label("Node Strength", fontsize=11) cbar.ax.tick_params(labelsize=9) plt.tight_layout() plt.savefig(save_path, bbox_inches="tight", facecolor="white")# 6. Maindef main(): df = generate_demo_data() # save demo data df.to_csv(os.path.join(OUTDIR, "demo_correlation_data.csv"), index=False) pear_corr, pear_p = correlation_and_pvalues(df, method="pearson") spea_corr, spea_p = correlation_and_pvalues(df, method="spearman") pcorr = partial_correlation(df) plot_pearson_heatmap( pear_corr, pear_p, os.path.join(OUTDIR, "fig1_pearson_heatmap.png") ) plot_spearman_bubble( spea_corr, spea_p, os.path.join(OUTDIR, "fig2_spearman_bubble.png") ) plot_partialcorr_network( pcorr, os.path.join(OUTDIR, "fig3_partialcorr_network.png"), threshold=0.18 )if __name__ == "__main__": main()

 10个月宝宝每天需要喝多少奶粉?
