Python入门课| 05. 数据结构
- 2026-06-30 18:42:49

05. 数据结构


《Python入门课》是作为生信小白入门重要的课程之一,学好python,是单细胞+空间转录组,Python全流程实战教学的基础。
B站同步播出:https://b23.tv/K9VXpXp
数据结构(理论)
数据结构(实操一)
数据结构(实操二)
数据结构(实操三)
数据结构(实操四)
在Python入门课| 01. 绪论中,我们给大家介绍了python的特点与用途,同时Python入门课| 02. python下载与安装手把手带领大家在不同系统中安装和下载Python;在Python入门课| 03. 变量与数据类型中的了解了变量与数据类型,主要是整数、浮点数、字符串和布尔值;在Python入门课| 04. 类型转换中,python实现数据类型相互转换;接下来学习python中的数据结构,主要包括:列表与元组、字典、集合、数组、Series、数据框DataFrame、AnnData。

图文内容


1. 数据结构
1.1 列表与元组
列表: 可修改的有序集合,使用方括号 [] 定义,适用于储存动态变化的数据
元组:不可修改的有序集合,使用 {} 定义,用于储存固定不变的信息
# 列表gene_list=['BRCA1','TP53','EGFR']print(gene_list)
['BRCA1', 'TP53', 'EGFR']# 元组codon={'AUG','UAA','UAG'}print(codon)
{'AUG', 'UAG', 'UAA'}gene_list.pop()'EGFR'gene_list['BRCA1', 'TP53']gene_list=['BRCA1','TP53','EGFR']list1=gene_list.pop(0)
list1'BRCA1'gene_list['TP53', 'EGFR']gene_list.append('SOX8')gene_list['TP53', 'EGFR', 'SOX8']列表编辑方法:
append(obj) | obj | lst.append(10) |
count(obj) | obj 出现的次数 | lst.count(2) |
extend(iterable) | lst.extend([4, 5]) | |
index(obj, start=0, end=len(lst)) | obj 第一次出现的索引,可指定范围 | lst.index(3) |
insert(index, obj) | index 位置插入元素 obj | lst.insert(1, 20) |
pop(index=-1) | lst.pop() | |
remove(obj) | obj | lst.remove(2) |
reverse() | lst.reverse() | |
sort(key=None, reverse=False) | key 和是否逆序 | lst.sort(reverse=True) |
# 元组编辑codon
{'AUG', 'UAA', 'UAG'}codon.append('AUG')---------------------------------------------------------------------------AttributeError Traceback (most recent call last) Cell In[27], line 1----> 1codon.append('AUG')AttributeError: 'set' object has no attribute 'append'
codon.pop(1)---------------------------------------------------------------------------TypeError Traceback (most recent call last) Cell In[28], line 1----> 1codon.pop(1)TypeError: set.pop() takes no arguments (1 given)
1.2 字典
是 一种内置的数据结构,属于 容器类型(Container Type),用来存储 键-值(key-value)映射关系
从使用角度来看,你在定义字典时,它会作为一个 变量 存在于内存里,但它的 数据类型(type) 是 dict
利用字典怎样方便地输出基因与表达信息
geneInfo = {'BRCA1': 5.2,'TP53':3.8,'ALK':6.1}
type(geneInfo)dictgeneInfo.items()dict_items([('BRCA1', 5.2), ('TP53', 3.8), ('ALK', 6.1)])geneInfo.keys()dict_keys(['BRCA1', 'TP53', 'ALK'])geneInfo.values()dict_values([5.2, 3.8, 6.1])gene_names=['BRCA1','TP53','ALK']gene_exp=[5.2,3.8,6.1]
expinfo = dict(zip(gene_names, gene_exp))print(expinfo)type(expinfo)
{'BRCA1': 5.2, 'TP53': 3.8, 'ALK': 6.1}dictPython 字典常用方法:
clear() | |
fromkeys(seq, value=None) | seq 创建新字典,所有键的值都是 value |
get(key, default=None) | default(不会报错) |
items() | (键, 值) 视图对象,可迭代 |
keys() | |
pop(key[, default]) | default |
setdefault(key, default=None) | default |
update([other]) | |
values() | |
copy() |
利用字典怎样快速方便地更新基因表达信息
geneInfo={'BRCA1':5.2,'TP53':3.8,'ALK':6.1}geneInfo_new={'TP53':4.6,'MAPK1':7.5,'CLINK':2.1}geneInfo.update(geneInfo_new)geneInfo
{'BRCA1': 5.2, 'TP53': 4.6, 'ALK': 6.1, 'MAPK1': 7.5, 'CLINK': 2.1}假设基因表达信息有部分基因重复出现,如何快速解决这个问题?
names=['BRCA1','BRCA2','BRCA3','BRCA1']1.3 集合
是Python中的一种 无序、元素唯一的可变数据结构,用于快速去重和集合运算
namesSet=set(names)namesSet
{'BRCA1', 'BRCA2', 'BRCA3'}aSet=set('hello')print(aSet)
{'e', 'h', 'l', 'o'}fSet=frozenset('hello')print(fSet)
frozenset({'e', 'h', 'l', 'o'})aSet=set('sunrise')bSet=set('sunset')
aSet & bSet{'e', 'n', 's', 'u'}aSet | bSet{'e', 'i', 'n', 'r', 's', 't', 'u'}aSet - bSet{'i', 'r'}aSet -= set('sun')aSet
{'e', 'i', 'r'}aSet.add('!')aSet
{'!', 'e', 'i', 'r'}aSet.remove('!')aSet
{'e', 'i', 'r'}aSet.update('Yeah')aSet
{'Y', 'a', 'e', 'h', 'i', 'r'}aSet.clear()aSet
set()1.4 数组
NumPy 数组(numpy.ndarray):
使用最广泛的科学计算数组
特点:多维数组、高效、支持向量化操作
array的创建
import numpy as npaArray = np.array([1,2,3])aArray
array([1, 2, 3])bArray = np.array([(1,2,3),(4,5,6),(7,8,9)])bArray
array([[1, 2, 3], [4, 5, 6], [7, 8, 9]])(1) array函数
arange(start, stop, step) | np.arange(0,5,1)[0 1 2 3 4] |
linspace(start, stop, num) | np.linspace(0,1,5)[0. 0.25 0.5 0.75 1.] |
array(object) | np.array([1,2,3])[1 2 3] |
zeros(shape) | np.zeros((2,3))[[0 0 0],[0 0 0]] |
zeros_like(a) | np.zeros_like(np.array([1,2]))[0 0] |
eye(N) | np.eye(3)[[1 0 0],[0 1 0],[0 0 1]] |
identity(n) | np.identity(3)[[1 0 0],[0 1 0],[0 0 1]] |
fromfile(filename) | np.fromfile('data.bin', dtype=int) |
fromfunction(function, shape) | np.fromfunction(lambda i,j: i+j, (3,3))[[0 1 2],[1 2 3],[2 3 4]] |
copy(a) | b = np.copy(a) |
np.arange()---------------------------------------------------------------------------TypeError Traceback (most recent call last) Cell In[55], line 1----> 1np.arange()TypeError: arange() requires stop to be specified.
np.arange(0,5,1)array([0, 1, 2, 3, 4])np.linspace(0,1,5)array([0. , 0.25, 0.5 , 0.75, 1. ])np.array([1,2,3])array([1, 2, 3])np.zeros((2,3))array([[0., 0., 0.], [0., 0., 0.]])np.zeros_like(np.array([1,2]))array([0, 0])np.ones((4))array([1., 1., 1., 1.])np.eye(2,4,0)array([[1., 0., 0., 0.], [0., 1., 0., 0.]])np.identity(3)array([[1., 0., 0.], [0., 1., 0.], [0., 0., 1.]])np.random.rand(5)array([0.63772951, 0.81217848, 0.20310379, 0.92996627, 0.087836 ])np.random.rand(5,5)array([[0.6905823 , 0.25951312, 0.88697466, 0.71435988, 0.39357782], [0.82124649, 0.95459649, 0.83051724, 0.94359563, 0.63488875], [0.45909436, 0.74779059, 0.35560115, 0.28928883, 0.98640251], [0.80774419, 0.99356694, 0.65280914, 0.12160228, 0.03459244], [0.10477458, 0.20987793, 0.6466776 , 0.41415308, 0.38370915]])np.random.randn(2)array([-1.0325992 , -1.13576414])arr = np.random.randint(1,100,10)arr
array([56, 94, 9, 54, 81, 65, 48, 88, 12, 14])arr.reshape(2,5)array([[56, 94, 9, 54, 81], [65, 48, 88, 12, 14]])arr.max()np.int64(94)arr.argmax()np.int64(1)(2) array索引和选择
arr_2d = np.array([[5,10,15],[20,25,30],[35,40,45]])arr_2darray([[ 5, 10, 15], [20, 25, 30], [35, 40, 45]])arr_2d[0]array([ 5, 10, 15])arr_2d[1][1]np.int64(25)arr_2d[:2,1:]array([[10, 15], [25, 30]])(3) array间的计算
aArray = np.array([(5,5,5),(5,5,5)])bArray = np.array([(2,2,2),(2,2,2)])
cArray = aArray * bArraycArray
array([[10, 10, 10], [10, 10, 10]])aArray += bArrayprint(aArray)
[[7 7 7] [7 7 7]]arr = np.arange(1,11)arr
array([ 1, 2, 3, 4, 5, 6, 7, 8, 9, 10])bool_arr = arr > 5bool_arr
array([False, False, False, False, False, True, True, True, True, True])arr[bool_arr]array([ 6, 7, 8, 9, 10])arr / arrarray([1., 1., 1., 1., 1., 1., 1., 1., 1., 1.])xarr = np.arange(0,10)xarr
array([0, 1, 2, 3, 4, 5, 6, 7, 8, 9])0 / 0---------------------------------------------------------------------------ZeroDivisionError Traceback (most recent call last) Cell In[84], line 1----> 10/0ZeroDivisionError: division by zero
xarr / xarr/tmp/ipykernel_33593/727807742.py:1: RuntimeWarning: invalid value encountered in divide xarr / xarrarray([nan, 1., 1., 1., 1., 1., 1., 1., 1., 1.])1 / xarr/tmp/ipykernel_33593/3789554754.py:1: RuntimeWarning: divide by zero encountered in divide 1 / xarrarray([ inf, 1. , 0.5 , 0.33333333, 0.25 , 0.2 , 0.16666667, 0.14285714, 0.125 , 0.11111111])np.max(arr)np.int64(10)np.min(arr)np.int64(1)np.sqrt(arr)array([1. , 1.41421356, 1.73205081, 2. , 2.23606798, 2.44948974, 2.64575131, 2.82842712, 3. , 3.16227766])np.exp(arr)array([2.71828183e+00, 7.38905610e+00, 2.00855369e+01, 5.45981500e+01, 1.48413159e+02, 4.03428793e+02, 1.09663316e+03, 2.98095799e+03, 8.10308393e+03, 2.20264658e+04])Test:怎么利用array生成九九乘法表? fromfunction(): - 索引生成法 - 每个元素的值由它在数组中的 坐标 决定 - 常用来生成规律性矩阵(乘法表、网格函数等)def fun(x,y):return (x+1)*(y+1)xArray = np.fromfunction(fun,(9,9))print(xArray)
[[ 1. 2. 3. 4. 5. 6. 7. 8. 9.] [ 2. 4. 6. 8. 10. 12. 14. 16. 18.] [ 3. 6. 9. 12. 15. 18. 21. 24. 27.] [ 4. 8. 12. 16. 20. 24. 28. 32. 36.] [ 5. 10. 15. 20. 25. 30. 35. 40. 45.] [ 6. 12. 18. 24. 30. 36. 42. 48. 54.] [ 7. 14. 21. 28. 35. 42. 49. 56. 63.] [ 8. 16. 24. 32. 40. 48. 56. 64. 72.] [ 9. 18. 27. 36. 45. 54. 63. 72. 81.]]1.5 Series
一种 一维带标签的数组。它既类似于 数组/列表,又类似于 字典
一维数据结构:存储整数、浮点数、字符串等 带索引(index):每个元素都有标签 可以通过索引访问:支持数字索引或自定义标签
import pandas as pd# 从列表创建 Seriess1 = pd.Series([10, 20, 30, 40])print(s1)
0 10 1 20 2 30 3 40 dtype: int64访问 Series 数据
# 按位置访问print(s1[0]) # 输出 10# 统计操作print(s1.sum()) # 输出 100print(s1.mean()) # 输出 25.0
10 10025.0如果你希望自定义索引:s2 = pd.Series([10, 20, 30, 40], index=['a','b','c','d'])print(s2)
a 10 b 20 c 30 d 40 dtype: int64Series 就是 带标签的一维数组,可以理解为 带索引的列表或简单的字典1.6 数据框 DataFrame
是二维表格数据结构,可以看作是由多列 Series 组成的表格,每列可以有不同的数据类型,大致可看成共享同一个index的Series集合
(1) DataFrame的基本结构
二维(行 × 列)
每列是一个 Series
行列都有索引
支持各种操作:筛选、排序、统计、合并等
import pandas as pdimport numpy as np
# 从字典创建 DataFramedf = pd.DataFrame({"Name": ["Alice", "Bob", "Charlie"],"Age": [25, 30, 35],"Score": [85.5, 90.0, 88.0]})print(df)
Name Age Score0 Alice 25 85.5 1 Bob 30 90.0 2 Charlie 35 88.0默认行索引是 0,1,2
每列可以是不同类型(字符串、整数、浮点数等)
(2) 访问数据
# 获取一列(返回 Series)print(df["Name"])
0 Alice 1 Bob 2 Charlie Name: Name, dtype: object# 获取多列(返回 DataFrame)print(df[["Name", "Score"]])
Name Score 0 Alice 85.5 1 Bob 90.0 2 Charlie 88.0# 按行索引获取print(df.iloc[1]) # 第二行
Name Bob Age 30 Score 90.0 Name: 1, dtype: object# 按条件筛选print(df[df["Score"] > 89])
Name Age Score 1 Bob 30 90.0(3) 数据处理实战
import pandas as pdimport numpy as np# 基因名genes = ["GeneA", "GeneB", "GeneC", "GeneD", "GeneE"]# 样本名samples = ["Sample1", "Sample2", "Sample3", "Sample4"]# 随机生成 5 个基因在 4 个样本中的表达量(整数模拟 TPM/Counts)np.random.seed(1212) # 固定随机种子,结果可复现data = np.random.randint(50, 200, size=(len(genes), len(samples)))# 构造 DataFramedf = pd.DataFrame(data, index=genes, columns=samples)print(df)
Sample1 Sample2 Sample3 Sample4 GeneA 186 116 151 191 GeneB 155 83 77 89 GeneC 55 192 67 134 GeneD 198 69 157 168 GeneE 129 122 132 173# 显示形状df.shape
(5, 4)# 显示索引df.index
Index(['GeneA', 'GeneB', 'GeneC', 'GeneD', 'GeneE'], dtype='object')# 显示列名df.columns
Index(['Sample1', 'Sample2', 'Sample3', 'Sample4'], dtype='object')# 显示数据的值df.values
array([[186, 116, 151, 191], [155, 83, 77, 89], [ 55, 192, 67, 134], [198, 69, 157, 168], [129, 122, 132, 173]])# 数据描述df.describe()
# 数据查看df.head(2)
df.tail(4)# 数据选择df[u'GeneA':u'GeneE']
df['Sample2']GeneA 116 GeneB 83 GeneC 192 GeneD 69 GeneE 122 Name: Sample2, dtype: int64df.Sample2GeneA 116 GeneB 83 GeneC 192 GeneD 69 GeneE 122 Name: Sample2, dtype: int64df.iloc[0:6,]df.loc['GeneA':'GeneE',]df.loc[:,['Sample1','Sample3']]df.iloc[:1,2]GeneA 151 Name: Sample3, dtype: int64df[df>150]bool_df=df>150df
bool_dfdf[bool_df]df[df>150]df[df['Sample1']>150][['Sample2','Sample3']]df['Sample1']>150GeneA True GeneB True GeneC False GeneD True GeneE False Name: Sample1, dtype: booldf[df['Sample1']>150]df[df['Sample1']>150][['Sample2','Sample3']]boolsers=df['Sample1']>150result = df[boolsers]my_cols = ['Sample2','Sample3']result[my_cols]
dfdf[(df['Sample1']>150)|(df['Sample2']<150)]df.reset_index()newind = 'sa y my na mes'.split()newind
['sa', 'y', 'my', 'na', 'mes']df['word'] = newinddf
df.set_index('word')data = np.random.randn(6,2)data
array([[-0.19228917, 0.1381977 ], [-0.79620222, -1.47975643], [ 0.00552813, -1.16490799], [-0.48173024, -1.64570701], [-0.02612605, 0.49249298], [-0.65343868, -0.69494063]])outside = ['G1','G1','G1','G2','G2','G2']inside = [1,2,3,1,2,3]
list(zip(outside,inside))[('G1', 1), ('G1', 2), ('G1', 3), ('G2', 1), ('G2', 2), ('G2', 3)]# 多层次索引 index levelsoutside = ['G1','G1','G1','G2','G2','G2']inside = [1,2,3,1,2,3]hier_index = list(zip(outside,inside))hier_index = pd.MultiIndex.from_tuples(hier_index)
df = pd.DataFrame(data,index=hier_index,columns=['A','B'])df
df.loc['G1'].loc[2]A -0.796202 B -1.479756 Name: 2, dtype: float64df.index.names=['Group','Sample']df
df.loc['G1'].loc[2]['A']-0.7962022239827933df.xs('G1',level='Group')再进行一些综合实际的运算测试
import pandas as pdimport numpy as np# 构造一个简单的基因表达矩阵data = {"Gene": ["GeneA","GeneB","GeneC","GeneD","GeneE","GeneF"],"Sample1": [10,50,30,80,5,60],"Sample2": [20,45,25,70,8,55],"Sample3": [15,55,28,90,3,65],"CellType": ["T","B","T","B","NK","T"]}df = pd.DataFrame(data)print(df)
Gene Sample1 Sample2 Sample3 CellType 0 GeneA 10 20 15 T 1 GeneB 50 45 55 B 2 GeneC 30 25 28 T 3 GeneD 80 70 90 B 4 GeneE 5 8 3 NK 5 GeneF 60 55 65 T简单统计与筛选
df.describe()# 筛选:找出表达量 > 50 的基因df[df["Sample1"] > 50]
df# 排序:按 Sample3 表达量排序(ascending升序)df.sort_values(by="Sample3",ascending=False)
# 计数统计:各细胞类型基因数目df["CellType"].value_counts()
CellType T 3 B 2 NK 1 Name: count, dtype: int64df.groupby("CellType")[["Sample1","Sample2","Sample3"]]<pandas.core.groupby.generic.DataFrameGroupBy object at 0x7fdb1040ffa0># 分组:按 CellType 计算平均表达量df.groupby("CellType")[["Sample1","Sample2","Sample3"]].mean()
new_row = pd.DataFrame({"Gene":['GeneG'],"Sample1": [40], "Sample2": [35], "Sample3": [50], "CellType": ["NK"]}, index=["6"])print(new_row)
Gene Sample1 Sample2 Sample3 CellType 6 GeneG 40 35 50 NK# 如果新测了一个基因GeneG,可以追加进去new_row = pd.DataFrame({"Gene":['GeneG'],"Sample1": [40], "Sample2": [35], "Sample3": [50], "CellType": ["NK"]}, index=["6"])df_concat = pd.concat([df, new_row])print(df_concat)
Gene Sample1 Sample2 Sample3 CellType 0 GeneA 10 20 15 T 1 GeneB 50 45 55 B 2 GeneC 30 25 28 T 3 GeneD 80 70 90 B 4 GeneE 5 8 3 NK 5 GeneF 60 55 65 T 6 GeneG 40 35 50 NK# join(像 SQL 合并)print(df)df_info = pd.DataFrame({"Gene": ["GeneA", "GeneB", "GeneC", "GeneD", "GeneF"],"Description": ["Signal", "Receptor", "Kinase", "TF", "Enzyme"]}).set_index("Gene")df_join = df.join(df_info, on = "Gene", how="left") # 对左表进行链接print(df_join)
Gene Sample1 Sample2 Sample3 CellType 0 GeneA 10 20 15 T 1 GeneB 50 45 55 B 2 GeneC 30 25 28 T 3 GeneD 80 70 90 B 4 GeneE 5 8 3 NK 5 GeneF 60 55 65 T Gene Sample1 Sample2 Sample3 CellType Description 0 GeneA 10 20 15 T Signal 1 GeneB 50 45 55 B Receptor 2 GeneC 30 25 28 T Kinase 3 GeneD 80 70 90 B TF 4 GeneE 5 8 3 NK NaN 5 GeneF 60 55 65 T Enzymedf_info = pd.DataFrame({"Gene": ["GeneA", "GeneB", "GeneC", "GeneD","GeneE","GeneF"],"Description": ["Signal", "Receptor", "Kinase","Gene","TF", "Enzyme"]}).set_index("Gene")print(df_info)
Description Gene GeneA Signal GeneB Receptor GeneC Kinase GeneD Gene GeneE TF GeneF Enzymedf_join = df.join(df_info, on = "Gene", how="left")df_join
# 合并:把基因注释表 merge 进来gene_info = pd.DataFrame({"Gene": ["GeneA","GeneB","GeneC","GeneD","GeneE","GeneF"],"Pathway": ["Path1","Path1","Path2","Path2","Path3","Path1"]})df_merge = pd.merge(df, gene_info, on="Gene")print(df_merge)
Gene Sample1 Sample2 Sample3 CellType Pathway 0 GeneA 10 20 15 T Path1 1 GeneB 50 45 55 B Path1 2 GeneC 30 25 28 T Path2 3 GeneD 80 70 90 B Path2 4 GeneE 5 8 3 NK Path3 5 GeneF 60 55 65 T Path1gene_info = pd.DataFrame({"Gene": ["GeneA","GeneB","GeneC","GeneD","GeneE","GeneF"],"Pathway": ["Path1","Path1","Path2","Path2","Path3","Path1"]})print(gene_info)
Gene Pathway 0 GeneA Path1 1 GeneB Path1 2 GeneC Path2 3 GeneD Path2 4 GeneE Path3 5 GeneF Path11.7 Anndata
(Annotated data)
单细胞/空间分析中最常用的数据结构,尤其是在 Scanpy / scvelo / Squidpy 里,用来存储单细胞或空间转录组数据。它本质上是 带行列注释的二维矩阵,可以存储表达矩阵、元数据、降维结果等
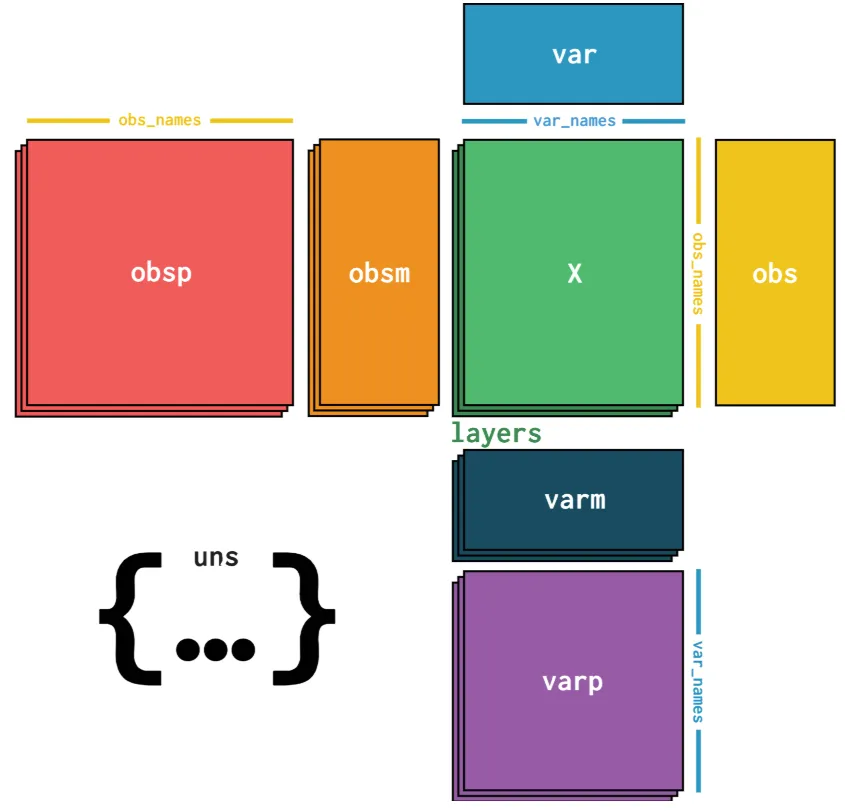
特点
X:主表达矩阵(细胞 × 基因)
obs:行注释(每个细胞的元信息,如 cell type、nUMI)
var:列注释(每个基因的信息,如基因名、类型)
obsm:行的多维注释(如 PCA、UMAP 坐标)
varm:列的多维注释
layers:不同版本的表达矩阵(如原始 counts、归一化后的表达)
创建示例
import anndataimport pandas as pdimport numpy as np
# 构建表达矩阵 5 个细胞 × 3 个基因X = np.random.rand(5,3)X
array([[0.19465879, 0.75363168, 0.67011092], [0.6730949 , 0.1981402 , 0.5818332 ], [0.19600538, 0.90684518, 0.77806403], [0.93672809, 0.19048208, 0.63820134], [0.03492986, 0.69859281, 0.49401032]])# 行注释:细胞信息obs = pd.DataFrame({"cell_type": ["A","A","B","B","C"],"nUMI": [1000, 1200, 900, 1100, 1050]}, index=[f"cell{i}" for i in range(5)])
obs# 列注释:基因信息var = pd.DataFrame({"gene_name": ["Gene1", "Gene2", "Gene3"]}, index=["Gene1","Gene2","Gene3"])var
# 创建 AnnData 对象adata = anndata.AnnData(X=X,obs=obs,var=var)print(adata)
AnnData object with n_obs × n_vars = 5 × 3 obs: 'cell_type', 'nUMI' var: 'gene_name'# 访问表达矩阵print(adata.X)
[[0.19465879 0.75363168 0.67011092] [0.6730949 0.1981402 0.5818332 ] [0.19600538 0.90684518 0.77806403] [0.93672809 0.19048208 0.63820134] [0.03492986 0.69859281 0.49401032]]# 访问行注释print(adata.obs)
cell_type nUMI cell0 A 1000 cell1 A 1200 cell2 B 900 cell3 B 1100 cell4 C 1050# 访问列注释print(adata.var)
gene_name Gene1 Gene1 Gene2 Gene2 Gene3 Gene3# 添加降维坐标adata.obsm["X_umap"] = np.random.rand(5,2)
adata.obsm["X_umap"]array([[0.65570112, 0.95325181], [0.92487895, 0.28615184], [0.84072823, 0.18507465], [0.88428376, 0.67256536], [0.62252519, 0.11358681]])AnnData 是 带注释的二维矩阵
非常适合单细胞、空间转录组数据
支持存储多种层(counts、归一化表达、降维、TCR/BCR 信息等)


Python入门课


1、课程简介
生信基地希望能够给大家提供系统性、形成性、规范性的生信教学。本次《Python入门课》可针对性的指导、答疑,分为"Python课程绪论"、"Python下载与安装"、"变量与数据变型"、"类型转换"、"数据结构"、"运算符和表达式"、"语法与语句"、"数据的读取与保存"、"模块与包"、"基于Matplotlib的基础可视化"、"简单机器学习入门"十一个模块共21节课。当然,我们也不做生信快餐,课程视频剪辑完毕,永久回放。后续我们会持续拉群在群里进行课程内容的答疑。
2、Python介绍
Python作为本次课程核心编程语言,语法简洁、库生态丰富、计算高效,是数据科学与自动化开发的主流选择,兼顾入门友好与高效开发。随着研究数据量,Python可弥补R语言在处理规模与扩展性上的不足,更好适合现科研需求。
我们制作的单细胞和空间转录组教程几乎也全是基于Python环境。很多同学找我们学习单细胞的时候都表示不想学习编程语言,直接学习单细胞/空间转录组分析,不积跬步无以至千里,这显然是不现实的,所以,欢迎大家来参加此次的课程。

报名/缴费二维码:


资料&课表


课程目录:
1. Python课程绪论
2. Python下载与安装
2.2 安装(以 Windows 为例)
2.3 Linux / macOS 安装
2.4 Miniconda 安装 python(虚拟环境)
3. 变量与数据类型
3.1 整数
3.2 浮点数
3.3 字符串
3.4 布尔值
4. 类型转换
5. 数据结构
5.1 列表与元组
5.2 字典
5.3 集合
5.4 数组
5.5 Series
5.6 数据框 DataFrame
5.7 Anndata
6. 运算符和表达式
6.1 算数运算符
6.2 比较运算符
6.3 逻辑运算符
6.4 位运算符
6.5 赋值运算符
7. 语法与语句
7.1 if条件语句
7.2 for循环语句
7.3 while循环语句
7.4 跳转语句
7.5 函数定义与调用
8. 数据的读取与保存
8.1 基础信息
8.2 不同格式文件读取
9. 模块与包
10. 基于Matplotlib的基础可视化
10.1 基础可视化
10.2 图像大小和 DPI 设置
10.3 设置图例
10.4 实战练习
11. 简单机器学习入门


如何联系我们


已有生信基地联系方式的同学无需重复添加


随机文章
-
 10个月宝宝每天需要喝多少奶粉?
- Python类型提示:写了三年,我终于敢说实话了
- Python基础笔记6——函数
- 起底 QLNX:这款 Linux 远控木马是如何玩转 LD_PRELOAD 和 7 种权限维持的?
- 自动生成直链接口!这款AI写的PHP轻量网盘,简直就是IPTV玩家的神器
- 很多人学Python的Flask,连路由到底怎么工作的都没搞明白
- Python/财务自动化之日记账往来自动勾稽
- 【python3.7.0】python3.7.0下载安装与激活教程,零基础轻松上手!激活安装
- 【python3.7.2】python3.7.2下载安装与激活教程,零基础轻松上手!激活安装
- 【python3.9.5】python3.9.5下载安装与激活教程,零基础轻松上手!激活安装
- Python-11-双y轴的图形
