前言
大数据进行分析的时候,有时候需要在散点图中添加回归线,而seaborn中regplot自带的Lowess拟合的效果比较差,因此本文利用python的statsmodels.api中的sm.nonparametric.lowess(y, x, frac=k)进行按需的lowess拟合。
Lowess介绍?
statemodels 笔记: lowess
import statsmodels.api as smlowess = sm.nonparametric.lowesslowess( endog = y值(一维numpy数组), exog = x值(一维numpy数组), frac = 使用多少比例的数据来拟合曲线(0~1, 值越大平滑的力度越大), is_sorted = 告诉程序数据是否按 x值 排序(True, False默认), 默认会把数据排序, missing = (‘none’, ‘drop’, and ‘raise’) 'none'不进行缺失值检查,'drop'丢弃含有缺失值的样本(默认), 'raise'有缺失值会报错, return_sorted = (True(默认), False) 返回的数据按 x值 排序)
使用步骤
1.引入库
代码如下(示例):
iimport numpy as npimport warningswarnings.filterwarnings('ignore')import matplotlib.pyplot as pltimport pandas as pdfrom scipy.interpolate import interp1dimport statsmodels.api as sm
2.读入数据并绘制图片
代码如下(示例):
data=sns.load_dataset("tips")data.head(5) df1 = data.set_index(['sex','day'])#设置两层索引方式'time','size'def findxy(df1,sex,day,k,n): Y=df1.loc[(sex,day),'total_bill']#提取横纵坐标值 X=df1.loc[(sex,day),'tip'] x=np.array(X[:]) y=np.array(Y[:]) # lowess will return our "smoothed" data with a y value for at every x-value lowess = sm.nonparametric.lowess(y, x, frac=k) # unpack the lowess smoothed points to their values lowess_x = list(zip(*lowess))[0] lowess_y = list(zip(*lowess))[1] ax[n].plot(y, x, 'o',markersize=1.2,color='b') ax[n].plot( lowess_y,lowess_x, '-',linewidth=1.5,color='r') return(x,y,lowess_x,lowess_y)r=['Male','Female']s=['Sun','Sat','Thur','Fri']# 创建一个2*3网格子图,每行的3个子图使用相同的y轴坐标,每列的2个子图使用相同的x轴坐标fig, ax = plt.subplots(2,4, figsize=(18, 14),sharex='col', sharey=True)ax = ax.ravel()for i in range(2): for j in range(4): ax[i*4].set(ylabel=r[i], #title='About as simple as it gets, folks' ) ax[j].set_title(s[j])#设置上标题 #ax[i].set_xlabel('Temperature trend($^\circ$C/10y)', font1)#for i in range(16,20):# ax[i].set(xlabel='Temperature trend($^\circ$C/10y)'# )#fig.suptitle('Temperature trend($^\circ$C/10y)',x=0.5, y=0.05, fontsize=12)fig.text(0.06, 0.5, 'Total bill (yuan)', va='center', rotation='vertical', fontsize=12)fig.text(0.5, 0.05, 'Tip', va='center', ha='center', fontsize=12)#fig.suptitle('Elevation(m)',x=0.05, y=0.5, fontsize=12)for i in range(2): for j in range(4): n=i*4+j findxy(df1,r[i],s[j],0.5,n)
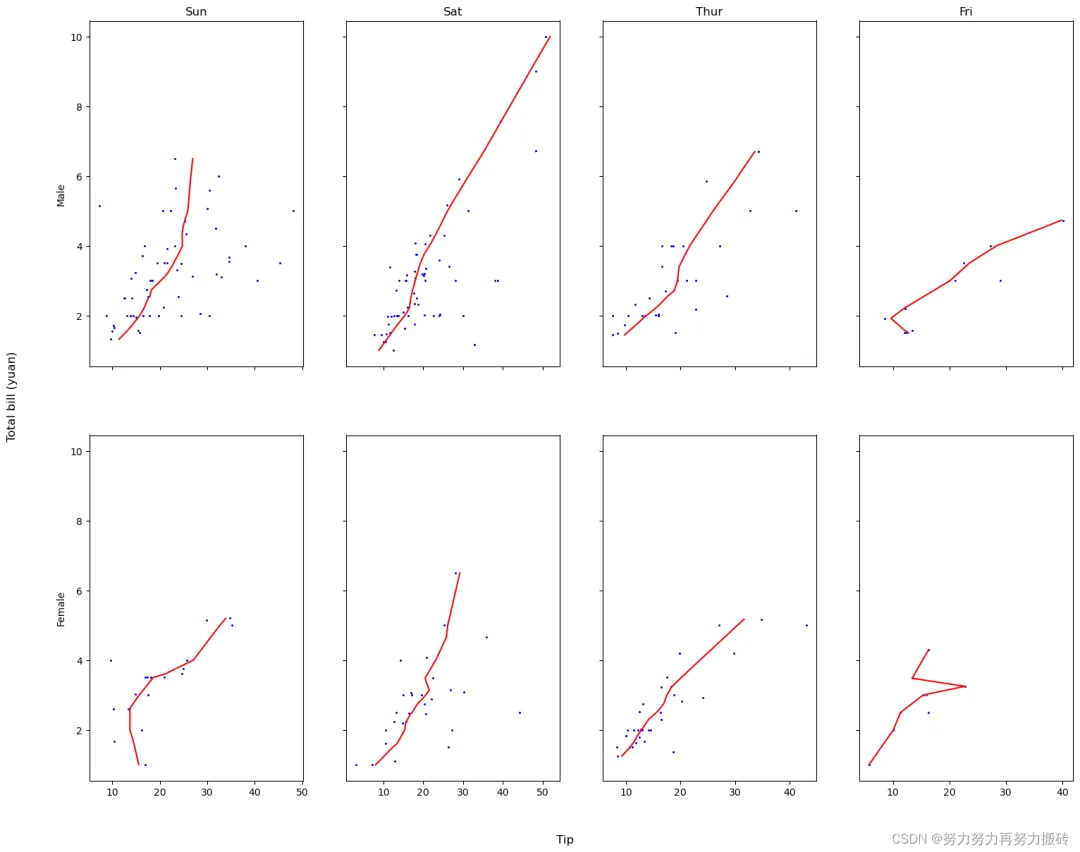
其中值得注意的是,可以先将自己感兴趣的两层设置成索引层。
df1 = data.set_index(['sex','day'])#设置两层索引方式'time','size'df1.index#提取横纵坐标值Y=df1.loc[('Male','Sun'),'tip']X=df1.loc[('Male','Sun'),'total_bill']
总结
以上就是今天要讲的内容,本文仅仅简单介绍了pandas于Lowess的使用,完善了seaborn.regplot()中lowess无法自己按照需求选择的问题。
————————————————
版权声明:本文为CSDN博主「努力努力再努力搬砖」的原创文章,转载请附上原文出处链接及本声明。
原文链接:https://blog.csdn.net/weixin_43347581/article/details/129141416
 10个月宝宝每天需要喝多少奶粉?
