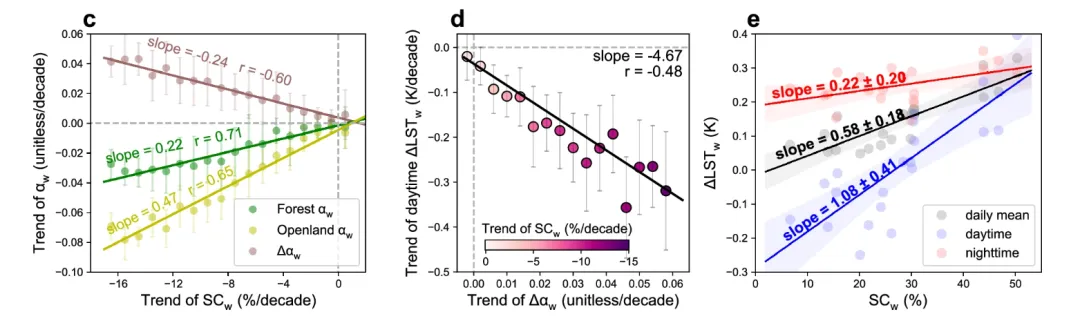
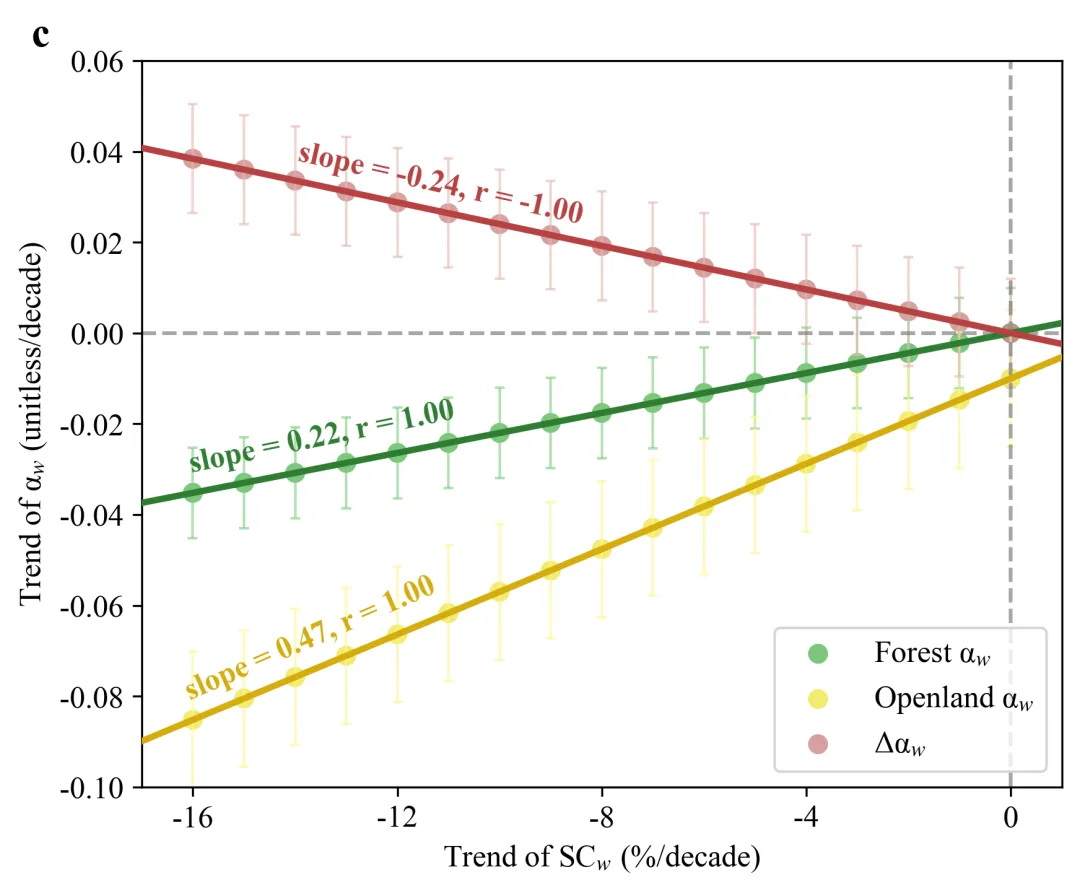
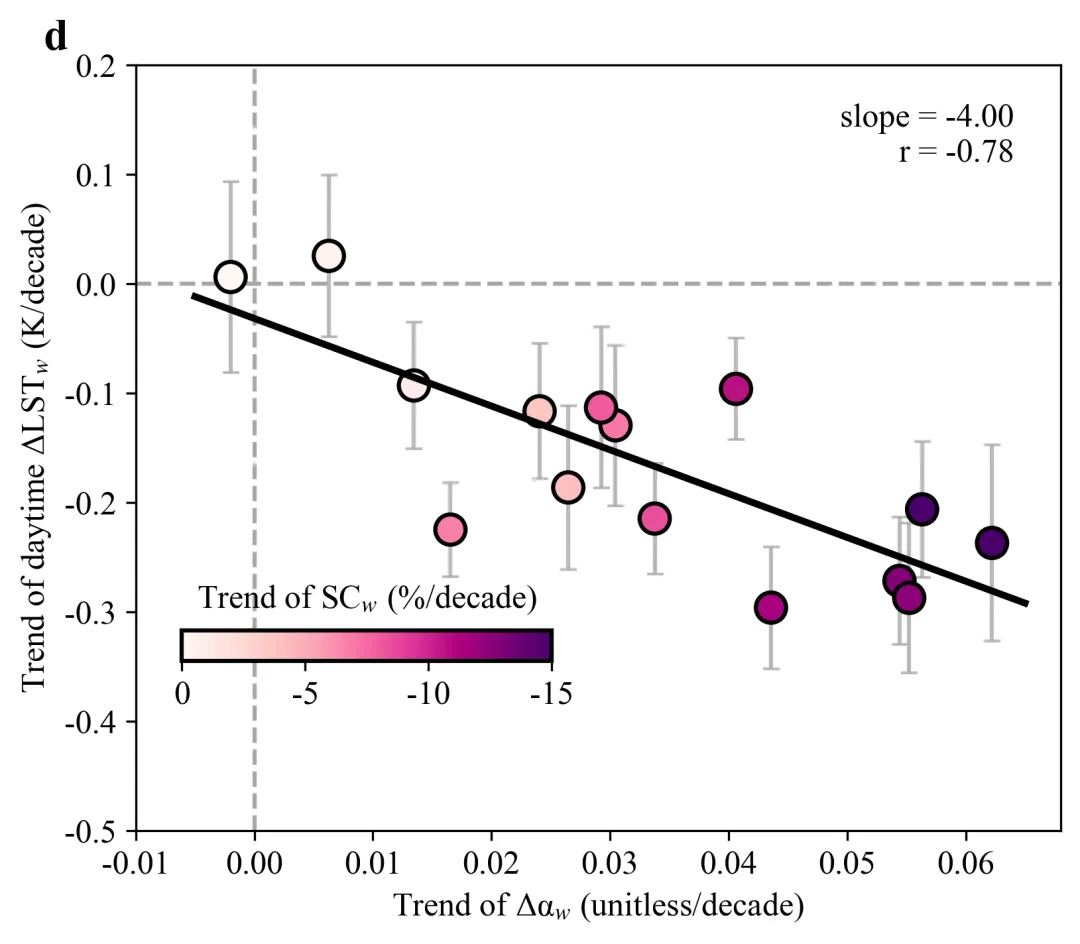
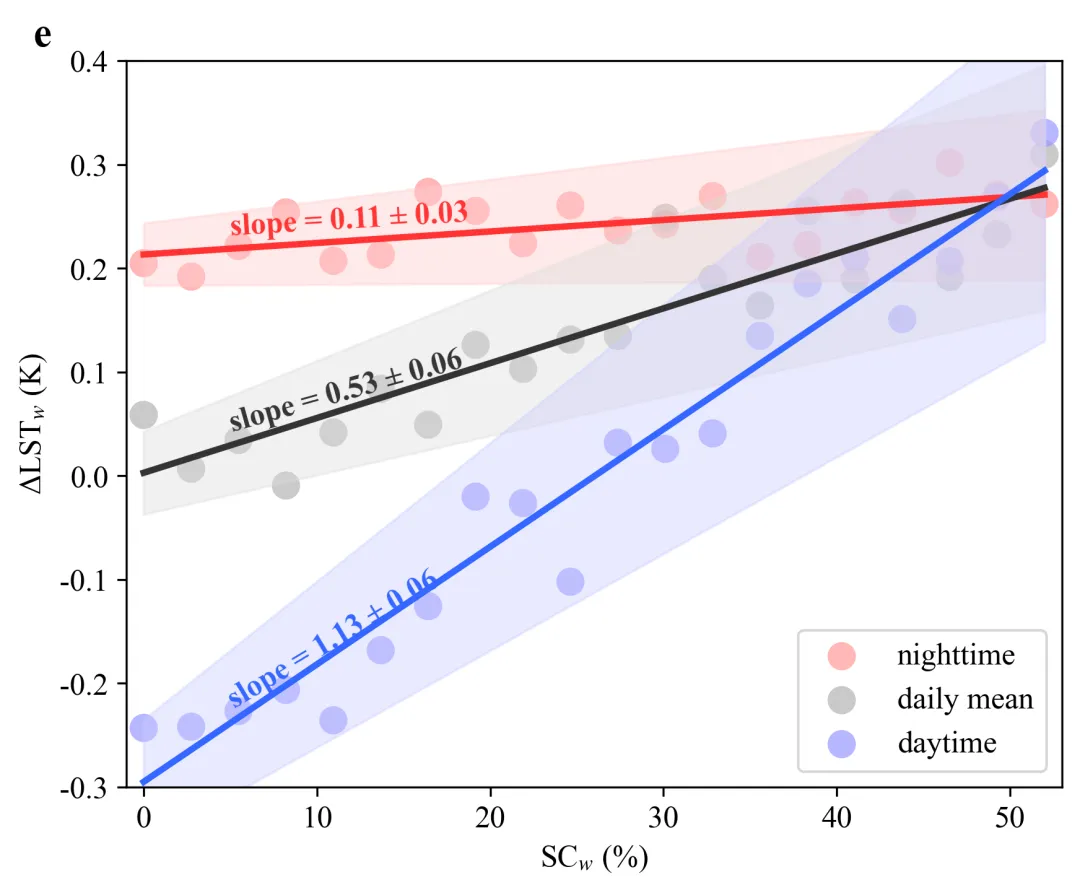
import matplotlib.pyplot as pltimport numpy as npimport pandas as pdfrom scipy import statsfrom mpl_toolkits.axes_grid1.inset_locator import inset_axesimport osimport matplotlibfrom PIL import Image# 全局配置plt.rcParams['font.family'] = 'Times New Roman'plt.rcParams['mathtext.fontset'] = 'stix'plt.rcParams['axes.unicode_minus'] = Falseplt.rcParams['font.size'] = 12matplotlib.rcParams['pdf.fonttype'] = 42matplotlib.rcParams['ps.fonttype'] = 42COLOR_SCHEMES = {1: 'RdPu'}SELECTED_SCHEME = 1selected_cmap = COLOR_SCHEMES.get(SELECTED_SCHEME, 'RdPu')SAVE_BASE_DIR = os.path.join(os.getcwd(), "图表")if not os.path.exists(SAVE_BASE_DIR): os.makedirs(SAVE_BASE_DIR)LABEL_FONT_SIZE = 16# 工具函数def add_rotated_label(ax, x1, y1, x2, y2, text, color, txt_x, offset=0.02): p1 = ax.transData.transform((x1, y1)) p2 = ax.transData.transform((x2, y2)) angle = np.degrees(np.arctan2(p2[1] - p1[1], p2[0] - p1[0])) txt_y = (y2 - y1) / (x2 - x1) * txt_x + y1 + offset ax.text(txt_x, txt_y, text, color=color, fontsize=12, fontweight='bold', rotation=angle, rotation_mode='anchor', transform=ax.transData, va='center', ha='left', zorder=10)def add_rotated_text(ax, line, slope, intercept, r_value, color, txt_x, offset=0.005): x1, y1 = line.get_xydata()[0] x2, y2 = line.get_xydata()[-1] p1 = ax.transData.transform((x1, y1)) p2 = ax.transData.transform((x2, y2)) dx = p2[0] - p1[0] dy = p2[1] - p1[1] angle = np.degrees(np.arctan2(dy, dx)) txt_y = slope * txt_x + intercept + offset ax.text(txt_x, txt_y, f"slope = {slope * 100:.2f}, r = {r_value:.2f}", color=color, fontsize=12, fontweight='bold', rotation=angle, rotation_mode='anchor', transform=ax.transData, va='bottom', ha='left', zorder=10)# 图表Cdef plot_chart_c(data_path="data1.xlsx"): df = pd.read_excel(data_path) x = df['Trend of SC_w (%/decade)'].values y_forest = df['Forest α_w (unitless/decade)'].values err_forest = df['Forest α_w Error'].values y_openland = df['Openland α_w (unitless/decade)'].values err_openland = df['Openland α_w Error'].values y_delta = df['Δα_w (unitless/decade)'].values err_delta = df['Δα_w Error'].values fig, ax = plt.subplots(figsize=(6, 5), dpi=150) ax.errorbar(x, y_forest, yerr=err_forest, fmt='none', ecolor='#7ccd7c', elinewidth=1, capsize=2, alpha=0.6) ax.scatter(x, y_forest, color='#5cb85c', label='Forest α$_w$', s=60, edgecolors='none', alpha=0.8) ax.errorbar(x, y_openland, yerr=err_openland, fmt='none', ecolor='#fff68f', elinewidth=1, capsize=2, alpha=0.6) ax.scatter(x, y_openland, color='#f0e64c', label='Openland α$_w$', s=60, edgecolors='none', alpha=0.8) ax.errorbar(x, y_delta, yerr=err_delta, fmt='none', ecolor='#e6b8af', elinewidth=1, capsize=2, alpha=0.6) ax.scatter(x, y_delta, color='#cc8888', label='Δα$_w$', s=60, edgecolors='none', alpha=0.8) slope_f, intercept_f, r_f, _, _ = stats.linregress(x, y_forest) x_fit = np.array([-17, 1]) y_fit_f = slope_f * x_fit + intercept_f line_f, = ax.plot(x_fit, y_fit_f, color='#2e7d32', linewidth=2.5, zorder=5) slope_o, intercept_o, r_o, _, _ = stats.linregress(x, y_openland) y_fit_o = slope_o * x_fit + intercept_o line_o, = ax.plot(x_fit, y_fit_o, color='#d4ac0d', linewidth=2.5, zorder=5) slope_d, intercept_d, r_d, _, _ = stats.linregress(x, y_delta) y_fit_d = slope_d * x_fit + intercept_d line_d, = ax.plot(x_fit, y_fit_d, color='#b74141', linewidth=2.5, zorder=5) ax.axhline(0, color='gray', linestyle='--', alpha=0.7, lw=1.5) ax.axvline(0, color='gray', linestyle='--', alpha=0.7, lw=1.5) ax.set_xlim(-17, 1) ax.set_ylim(-0.10, 0.06) ax.set_xticks(np.arange(-16, 2, 4)) ax.set_xlabel('Trend of SC$_w$ (%/decade)', fontsize=12) ax.set_ylabel('Trend of α$_w$ (unitless/decade)', fontsize=12) ax.tick_params(axis='both', labelsize=12) ax.legend(loc='lower right', fontsize=12) ax.text(-0.12, 1.02, 'c', transform=ax.transAxes, fontsize=LABEL_FONT_SIZE, fontweight='bold') fig.canvas.draw() add_rotated_text(ax, line_f, slope_f, intercept_f, r_f, '#2e7d32', txt_x=-16, offset=0.003) add_rotated_text(ax, line_o, slope_o, intercept_o, r_o, '#d4ac0d', txt_x=-16, offset=0.003) add_rotated_text(ax, line_d, slope_d, intercept_d, r_d, '#b74141', txt_x=-14, offset=0.003) plt.tight_layout() save_path = os.path.join(SAVE_BASE_DIR, 'chart_c.png') plt.savefig(save_path, dpi=300, bbox_inches='tight') plt.close()# 图表Ddef plot_chart_d(data_path="data2.xlsx"): df_data = pd.read_excel(data_path) x_data = df_data['x_data'].values y_data = df_data['y_data'].values y_error = df_data['y_error'].values color_data = df_data['color_data'].values cbar_ticks = [0, -5, -10, -15] vmin_val = -15 vmax_val = 0 fig, ax = plt.subplots(figsize=(6, 5)) ax.axhline(0, color='gray', linestyle='--', alpha=0.7, lw=1.5) ax.axvline(0, color='gray', linestyle='--', alpha=0.7, lw=1.5) scatter = ax.scatter(x_data, y_data, c=color_data, cmap=selected_cmap + '_r', s=120, edgecolors='black', linewidth=1.5, zorder=2, vmin=vmin_val, vmax=vmax_val) ax.errorbar(x_data, y_data, yerr=y_error, fmt='none', ecolor='darkgray', elinewidth=1.5, capsize=3, alpha=0.8, zorder=1) slope, intercept, r_value, p_value, std_err = stats.linregress(x_data, y_data) x_fit = np.array([-0.005, 0.065]) y_fit = slope * x_fit + intercept ax.plot(x_fit, y_fit, color='black', linewidth=2.5, zorder=3) annotation_text = f"slope = {slope:.2f}\nr = {r_value:.2f}" ax.text(0.95, 0.95, annotation_text, transform=ax.transAxes, fontsize=12, ha='right', va='top') cbaxes = inset_axes(ax, width="40%", height="4%", loc='lower center', bbox_to_anchor=(-0.25, 0.2, 1, 1), bbox_transform=ax.transAxes) cbar = fig.colorbar(scatter, cax=cbaxes, orientation='horizontal', extend='neither') cbar.outline.set_edgecolor('black') cbar.outline.set_linewidth(1.5) cbar.set_label('Trend of SC$_w$ (%/decade)', fontsize=12, labelpad=8) cbar.ax.xaxis.set_label_position('top') cbar.ax.tick_params(labelsize=12) cbar.set_ticks(cbar_ticks) cbar.ax.invert_xaxis() ax.set_xlim(-0.01, 0.068) ax.set_ylim(-0.5, 0.2) ax.set_xlabel('Trend of Δα$_w$ (unitless/decade)', fontsize=12) ax.set_ylabel('Trend of daytime ΔLST$_w$ (K/decade)', fontsize=12) ax.tick_params(axis='both', which='major', labelsize=12) ax.text(-0.1, 1.02, 'd', transform=ax.transAxes, fontsize=LABEL_FONT_SIZE, fontweight='bold') save_path = os.path.join(SAVE_BASE_DIR, 'chart_d.png') plt.savefig(save_path, dpi=300, bbox_inches='tight') plt.close()# 图表Edef plot_chart_e(data_path="data3.xlsx", save_filename="chart_e.png"): if not os.path.exists(data_path): raise FileNotFoundError(f"未找到Excel文件:{data_path}") df = pd.read_excel(data_path) required_columns = ['SC_w (%)', 'ΔLST_w (Nighttime)', 'ΔLST_w (Daily Mean)', 'ΔLST_w (Daytime)'] for col in required_columns: if col not in df.columns: raise ValueError(f"缺少列:{col}") sc_w = df['SC_w (%)'].values night_y = df['ΔLST_w (Nighttime)'].values daily_y = df['ΔLST_w (Daily Mean)'].values day_y = df['ΔLST_w (Daytime)'].values night_reg = stats.linregress(sc_w / 100, night_y) night_slope, night_intercept, night_slope_err = night_reg.slope, night_reg.intercept, night_reg.stderr daily_reg = stats.linregress(sc_w / 100, daily_y) daily_slope, daily_intercept, daily_slope_err = daily_reg.slope, daily_reg.intercept, daily_reg.stderr day_reg = stats.linregress(sc_w / 100, day_y) day_slope, day_intercept, day_slope_err = day_reg.slope, day_reg.intercept, day_reg.stderr fig, ax = plt.subplots(figsize=(6, 5), dpi=150) ax.scatter(sc_w, night_y, color='#ff9999', label='nighttime', s=120, alpha=0.7, edgecolors='none') ax.scatter(sc_w, daily_y, color='#b3b3b3', label='daily mean', s=120, alpha=0.7, edgecolors='none') ax.scatter(sc_w, day_y, color='#9999ff', label='daytime', s=120, alpha=0.7, edgecolors='none') x_fit = np.linspace(sc_w.min(), sc_w.max(), 100) y_n = night_slope * (x_fit / 100) + night_intercept band_n = 0.03 + 0.001 * x_fit ax.plot(x_fit, y_n, color='#ff3333', linewidth=2.5, zorder=5) ax.fill_between(x_fit, y_n - band_n, y_n + band_n, color='#ffcccc', alpha=0.4) y_d = daily_slope * (x_fit / 100) + daily_intercept band_d = 0.04 + 0.0015 * x_fit ax.plot(x_fit, y_d, color='#333333', linewidth=2.5, zorder=5) ax.fill_between(x_fit, y_d - band_d, y_d + band_d, color='#dddddd', alpha=0.4) y_t = day_slope * (x_fit / 100) + day_intercept band_t = 0.06 + 0.002 * x_fit ax.plot(x_fit, y_t, color='#3366ff', linewidth=2.5, zorder=5) ax.fill_between(x_fit, y_t - band_t, y_t + band_t, color='#ccccff', alpha=0.4) fig.canvas.draw() add_rotated_label(ax, sc_w.min(), night_intercept, sc_w.max(), night_slope * (sc_w.max() / 100) + night_intercept, f"slope = {night_slope:.2f} ± {night_slope_err:.2f}", '#ff3333', txt_x=sc_w.min() + 5, offset=0.02) add_rotated_label(ax, sc_w.min(), daily_intercept, sc_w.max(), daily_slope * (sc_w.max() / 100) + daily_intercept, f"slope = {daily_slope:.2f} ± {daily_slope_err:.2f}", '#333333', txt_x=sc_w.min() + 5, offset=0.02) add_rotated_label(ax, sc_w.min(), day_intercept, sc_w.max(), day_slope * (sc_w.max() / 100) + day_intercept, f"slope = {day_slope:.2f} ± {day_slope_err:.2f}", '#3366ff', txt_x=sc_w.min() + 5, offset=0.02) ax.set_xlim(sc_w.min() - 1, sc_w.max() + 1) ax.set_ylim(-0.3, 0.4) ax.set_xlabel('SC$_w$ (%)', fontsize=12) ax.set_ylabel('ΔLST$_w$ (K)', fontsize=12) ax.tick_params(axis='both', labelsize=12) ax.legend(loc='lower right', fontsize=12, frameon=True) ax.text(-0.1, 1.02, 'e', transform=ax.transAxes, fontsize=LABEL_FONT_SIZE, fontweight='bold') plt.tight_layout() save_path = os.path.join(SAVE_BASE_DIR, save_filename) plt.savefig(save_path, dpi=300, bbox_inches='tight') plt.close()# 拼接总图def merge_three_plots(): p1 = os.path.join(SAVE_BASE_DIR, "chart_c.png") p2 = os.path.join(SAVE_BASE_DIR, "chart_d.png") p3 = os.path.join(SAVE_BASE_DIR, "chart_e.png") im1 = Image.open(p1) im2 = Image.open(p2) im3 = Image.open(p3) height = im1.height im2 = im2.resize((int(im2.width * height / im2.height), height)) im3 = im3.resize((int(im3.width * height / im3.height), height)) total_width = im1.width + im2.width + im3.width new_im = Image.new('RGB', (total_width, height), (255, 255, 255)) new_im.paste(im1, (0, 0)) new_im.paste(im2, (im1.width, 0)) new_im.paste(im3, (im1.width + im2.width, 0)) merge_path = os.path.join(SAVE_BASE_DIR, "合并总图.png") new_im.save(merge_path, dpi=(300, 300))# 主入口if __name__ == "__main__": DATA1_PATH = "data1.xlsx" DATA2_PATH = "data2.xlsx" DATA3_PATH = "data3.xlsx" try: plot_chart_c(DATA1_PATH) plot_chart_d(DATA2_PATH) plot_chart_e(DATA3_PATH) merge_three_plots() except Exception as e: pass


 10个月宝宝每天需要喝多少奶粉?
