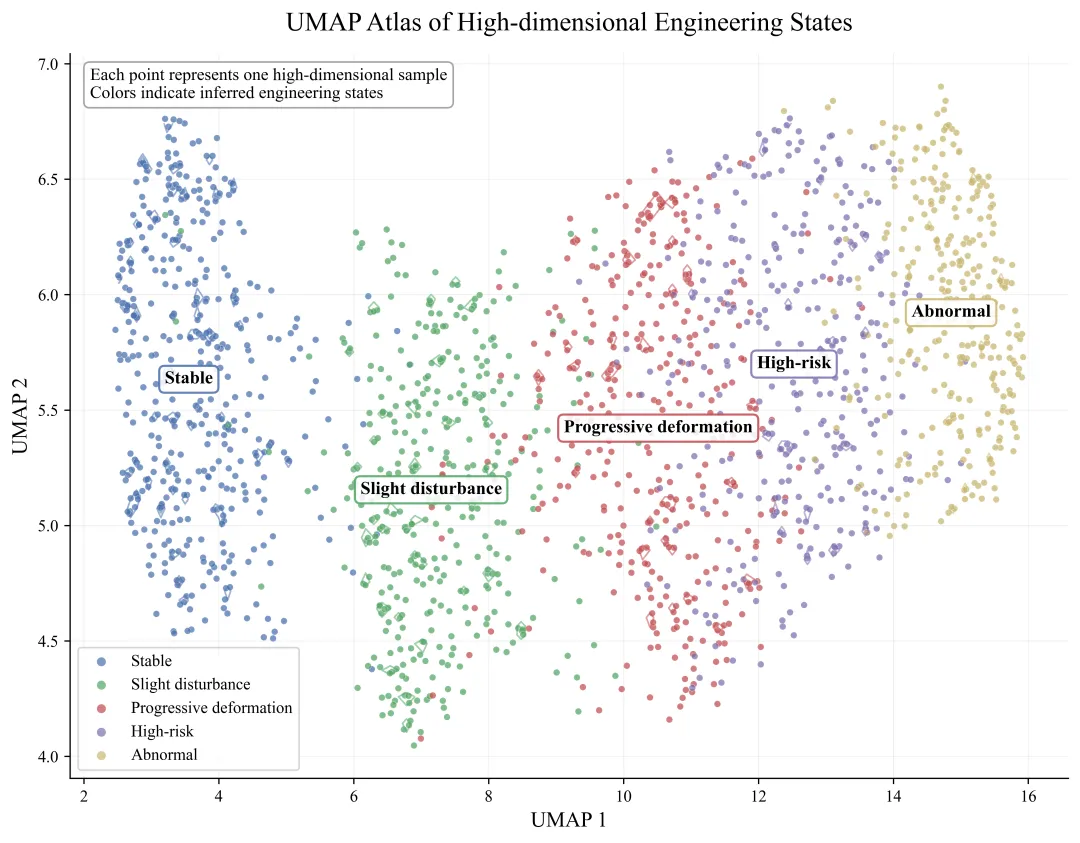
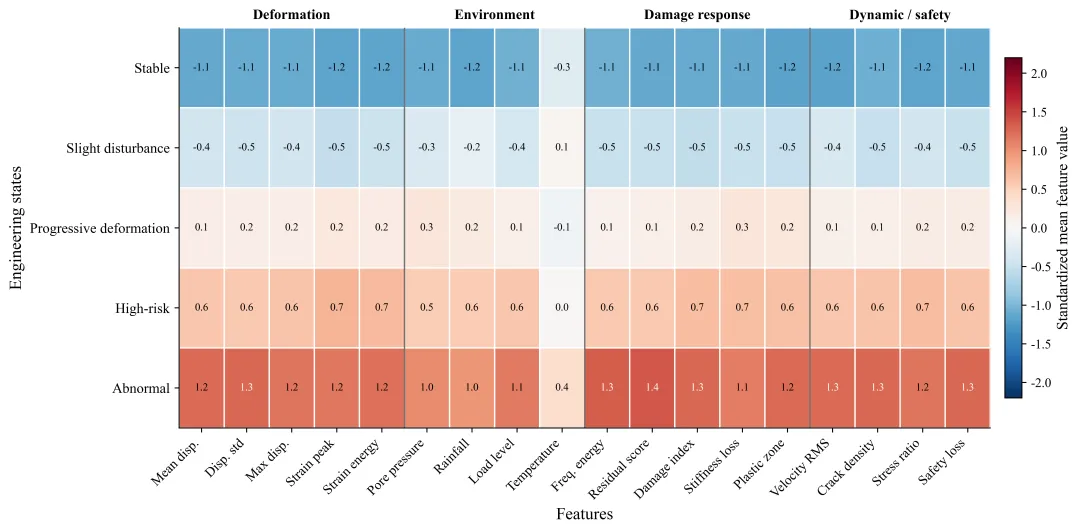
import osimport numpy as npimport matplotlib.pyplot as pltfrom sklearn.preprocessing import StandardScalerfrom umap import UMAPnp.random.seed(2026)plt.rcParams["font.family"] = "Times New Roman"plt.rcParams["axes.unicode_minus"] = Falseplt.rcParams["figure.dpi"] = 160plt.rcParams["savefig.dpi"] = 600out_dir = "python_umap_heatmap_figures"os.makedirs(out_dir, exist_ok=True)# 随机生成高维科研数据# 假设这是工程监测 / 材料试验 / 模型诊断数据state_names = [ "Stable", "Slight disturbance", "Progressive deformation", "High-risk", "Abnormal"]feature_names = [ "Mean disp.", "Disp. std", "Max disp.", "Strain peak", "Strain energy", "Pore pressure", "Rainfall", "Load level", "Temperature", "Freq. energy", "Residual score", "Damage index", "Stiffness loss", "Plastic zone", "Velocity RMS", "Crack density", "Stress ratio", "Safety loss"]n_states = len(state_names)n_features = len(feature_names)# 每类样本数量n_per_state = [420, 380, 360, 330, 310]# 构造每个状态的特征均值模式# 行:状态;列:特征state_mean = np.array([ # Stable [-1.1, -1.0, -1.0, -1.1, -1.0, -0.7, -0.8, -0.6, 0.0, -0.8, -1.1, -1.1, -1.0, -1.1, -0.8, -1.0, -0.8, -1.2], # Slight disturbance [-0.3, -0.2, -0.2, -0.3, -0.2, 0.1, 0.2, -0.1, 0.2, -0.2, -0.3, -0.4, -0.2, -0.3, 0.0, -0.3, -0.1, -0.3], # Progressive deformation [ 0.4, 0.5, 0.5, 0.7, 0.6, 0.7, 0.6, 0.4, 0.1, 0.4, 0.5, 0.6, 0.7, 0.6, 0.5, 0.5, 0.5, 0.6], # High-risk [ 1.0, 1.1, 1.1, 1.4, 1.3, 1.1, 1.0, 0.8, 0.2, 0.9, 1.1, 1.3, 1.2, 1.2, 1.0, 1.2, 1.0, 1.3], # Abnormal [ 1.7, 1.9, 1.8, 2.0, 1.9, 1.5, 1.4, 1.3, 0.4, 1.6, 2.1, 2.0, 1.7, 1.9, 1.6, 2.0, 1.5, 2.1],])X_list = []y_list = []for k, n in enumerate(n_per_state): # 基础噪声 Xk = np.random.normal(loc=0, scale=0.55, size=(n, n_features)) # 状态均值 Xk += state_mean[k] # 构造一些相关结构,让数据更像真实高维数据 latent_deformation = np.random.normal(0, 0.55, size=n) latent_environment = np.random.normal(0, 0.45, size=n) latent_damage = np.random.normal(0, 0.50, size=n) # 位移与应变相关 Xk[:, [0, 1, 2, 3, 4]] += latent_deformation[:, None] * np.array([0.8, 0.7, 0.9, 0.8, 0.7]) # 环境相关:孔压、降雨、温度 Xk[:, [5, 6, 8]] += latent_environment[:, None] * np.array([0.8, 0.9, 0.5]) # 损伤相关:残差、损伤、刚度损失、塑性区、裂隙、安全损失 Xk[:, [10, 11, 12, 13, 15, 17]] += latent_damage[:, None] * np.array([0.8, 0.9, 0.8, 0.7, 0.9, 1.0]) X_list.append(Xk) y_list.append(np.full(n, k))X = np.vstack(X_list)y = np.concatenate(y_list)# 标准化scaler = StandardScaler()X_scaled = scaler.fit_transform(X)# 2. UMAP 降维umap_model = UMAP( n_components=2, n_neighbors=35, min_dist=0.12, metric="euclidean", random_state=2026)embedding = umap_model.fit_transform(X_scaled)# 3. 图1:UMAP 高维状态图谱colors = [ "#4C72B0", "#55A868", "#C44E52", "#8172B2", "#CCB974"]fig, ax = plt.subplots(figsize=(9.2, 7.2))# 先画所有点的灰色背景,增加“图谱感”ax.scatter( embedding[:, 0], embedding[:, 1], s=8, color="#D0D0D0", alpha=0.25, linewidths=0)# 分状态绘制for k, name in enumerate(state_names): idx = y == k ax.scatter( embedding[idx, 0], embedding[idx, 1], s=16, color=colors[k], alpha=0.72, edgecolor="white", linewidth=0.20, label=name ) # 状态中心标签 cx = np.median(embedding[idx, 0]) cy = np.median(embedding[idx, 1]) ax.text( cx, cy, name, fontsize=11, weight="bold", ha="center", va="center", bbox=dict( boxstyle="round,pad=0.30", facecolor="white", edgecolor=colors[k], linewidth=1.3, alpha=0.88 ), zorder=8 ) # 密度等值线:用二维直方图模拟局部密度 xs = embedding[idx, 0] ys = embedding[idx, 1] H, xedges, yedges = np.histogram2d(xs, ys, bins=60) H = H.T if np.max(H) > 0: xcenters = (xedges[:-1] + xedges[1:]) / 2 ycenters = (yedges[:-1] + yedges[1:]) / 2 nonzero = H[H > 0] if len(nonzero) > 10: levels = np.quantile(nonzero, [0.72, 0.88]) levels = np.unique(levels) if len(levels) >= 1: ax.contour( xcenters, ycenters, H, levels=levels, colors=[colors[k]], linewidths=1.0, alpha=0.55 )ax.set_title( "UMAP Atlas of High-dimensional Engineering States", fontsize=16, pad=14)ax.set_xlabel("UMAP 1", fontsize=13)ax.set_ylabel("UMAP 2", fontsize=13)ax.legend( frameon=True, fontsize=10, loc="best", markerscale=1.4)ax.grid(alpha=0.18, linewidth=0.6)ax.spines["top"].set_visible(False)ax.spines["right"].set_visible(False)ax.text( 0.02, 0.98, "Each point represents one high-dimensional sample\nColors indicate inferred engineering states", transform=ax.transAxes, ha="left", va="top", fontsize=10.5, bbox=dict( boxstyle="round,pad=0.35", facecolor="white", edgecolor="#999999", alpha=0.88 ))plt.tight_layout()plt.savefig( os.path.join(out_dir, "01_umap_state_atlas.png"), bbox_inches="tight", facecolor="white")# 4. 计算各状态的标准化特征均值cluster_means = np.zeros((n_states, n_features))for k in range(n_states): cluster_means[k, :] = X_scaled[y == k].mean(axis=0)# 为了让热图更清楚,对数值做轻微截断heat_values = np.clip(cluster_means, -2.2, 2.2)# 5. 图2:状态—特征聚类热图fig, ax = plt.subplots(figsize=(12.5, 5.8))im = ax.imshow( heat_values, cmap="RdBu_r", aspect="auto", vmin=-2.2, vmax=2.2)# 坐标标签ax.set_xticks(np.arange(n_features))ax.set_xticklabels( feature_names, rotation=45, ha="right", fontsize=10.5)ax.set_yticks(np.arange(n_states))ax.set_yticklabels(state_names, fontsize=11)# 网格线ax.set_xticks(np.arange(-0.5, n_features, 1), minor=True)ax.set_yticks(np.arange(-0.5, n_states, 1), minor=True)ax.grid(which="minor", color="white", linestyle="-", linewidth=1.1)ax.tick_params(which="minor", bottom=False, left=False)# 数值标注for i in range(n_states): for j in range(n_features): value = heat_values[i, j] txt_color = "white" if abs(value) > 1.25 else "black" ax.text( j, i, f"{value:.1f}", ha="center", va="center", fontsize=8.3, color=txt_color )# 给特征分组加浅色背景带# 这里用竖线划分几类特征group_edges = [5, 9, 14, 18]for edge in group_edges[:-1]: ax.axvline(edge - 0.5, color="black", linewidth=1.1, alpha=0.55)# 顶部特征组标签group_labels = [ ("Deformation", 0, 4), ("Environment", 5, 8), ("Damage response", 9, 13), ("Dynamic / safety", 14, 17)]for label, start, end in group_labels: xpos = (start + end) / 2 ax.text( xpos, -0.65, label, ha="center", va="center", fontsize=11, weight="bold" )cbar = fig.colorbar(im, ax=ax, shrink=0.85, pad=0.015)cbar.set_label("Standardized mean feature value", fontsize=12)cbar.ax.tick_params(labelsize=10)ax.set_xlabel("Features", fontsize=13)ax.set_ylabel("Engineering states", fontsize=13)ax.spines["top"].set_visible(False)ax.spines["right"].set_visible(False)plt.tight_layout()plt.savefig( os.path.join(out_dir, "02_state_feature_heatmap.png"), bbox_inches="tight", facecolor="white")# 保存数据# 保存高维数据header = ",".join(feature_names) + ",state_id,state_name,UMAP_1,UMAP_2"state_name_array = np.array([state_names[i] for i in y], dtype=object)# 因为 np.savetxt 不方便混合字符串,这里分两份保存numeric_data = np.column_stack([ X, y, embedding[:, 0], embedding[:, 1]])numeric_header = ",".join(feature_names) + ",state_id,UMAP_1,UMAP_2"

 10个月宝宝每天需要喝多少奶粉?
