量化系列(九十八) Python 获取 A 股历史股票池完整行情数据|附可直接运行完整源码
- 2026-10-11 06:19:57
量化系列(九十八) Python 获取 A 股历史股票池完整行情数据|附可直接运行完整源码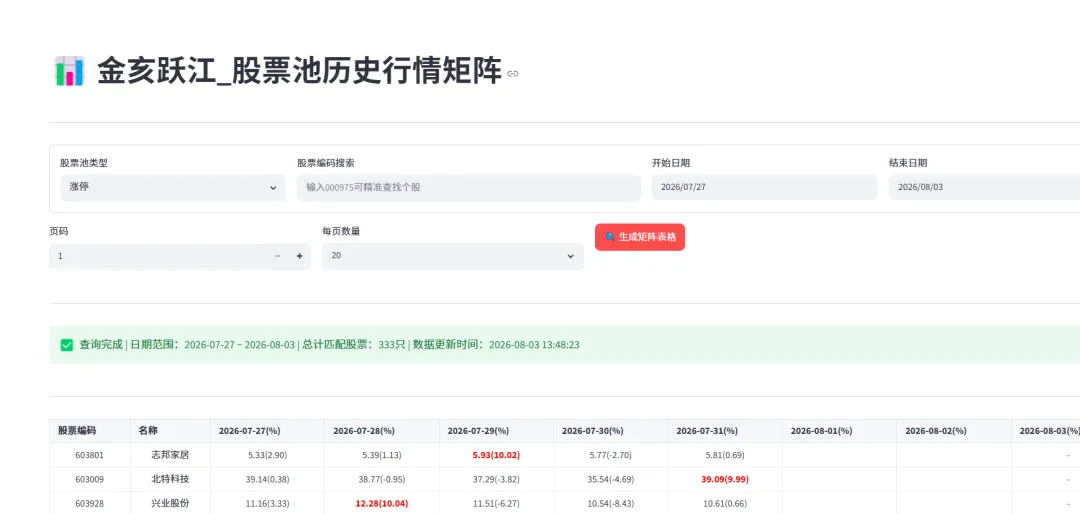
一. 认真学完这一章节,你可以做什么?
这一章节,我们来获取历史的股票池数据信息,并且将其友好的展示出来, 方便后续的统计处理。
可以将其存在这段时间内的数据展示出来,并且标记展示出来。
这样可以很方便的看到 涨停的股票 前几天的涨幅是什么样子的,后几天的涨幅是什么样子的。
这个功能,是非常强大的,大家一定要学会应用。
本文含系统自动匹配的广告,广告收入用于支持持续创作,感谢理解
二. 数据源和响应信息
获取历史的股票池数据信息,可以调用 POST
https://www.yueshushu.top/StockApi/stockPool/listPool?sign=stock请求参数是:
{ "pageNum": 1, "pageSize": 10, "keywords":null, "poolType": "1", "startDate": "2026-07-27", "endDate": "2026-08-03"}其中 keywords 为 股票的编码关键词。
响应参数形式是:
{ "code": 20000, "success": true, "message": null, "timestamp": 1785736242053, "traceId": "18d1f200-ecf5-4271-9764-bb216f30cd05", "timestampStr": "2026-08-03 13:50:42", "exceptionMessage": null, "customInfo": "如果你对我的接口感兴趣,请联系我:+v: yueshushu_top", "data": { "total": 333, "list": [ { "code": "603801", "name": "志邦家居", "wxCode": null, "bkCode": null, "bkName": null, "bkUrl": null, "score": null, "zt": null, "predicateScore": null, "aiScore": null, "jaiScore": null, "scoreMessage": null, "currDate": null, "amplitudeProportion": null, "detailList": [ { "currDate": "2026-07-27", "type": 1, "amplitudeProportion": "2.90", "closePrice": "5.33", "sign": 0, "redShow": 0, "totalProportion": null, "wxTotalProportion": null }, { "currDate": "2026-07-28", "type": 1, "amplitudeProportion": "1.13", "closePrice": "5.39", "sign": 0, "redShow": 0, "totalProportion": null, "wxTotalProportion": null }, { "currDate": "2026-07-29", "type": 1, "amplitudeProportion": "10.02", "closePrice": "5.93", "sign": 1, "redShow": 0, "totalProportion": null, "wxTotalProportion": null }, { "currDate": "2026-07-30", "type": -1, "amplitudeProportion": "-2.70", "closePrice": "5.77", "sign": 0, "redShow": 0, "totalProportion": null, "wxTotalProportion": null }, { "currDate": "2026-07-31", "type": 1, "amplitudeProportion": "0.69", "closePrice": "5.81", "sign": 0, "redShow": 0, "totalProportion": null, "wxTotalProportion": null }, { "currDate": "2026-08-03", "type": null, "amplitudeProportion": null, "closePrice": null, "sign": 0, "redShow": 0, "totalProportion": null, "wxTotalProportion": null } ], "webUrl": null, "showCode": null, "maxGainPercent": null, "maxGainDate": null, "finalGainPercent": null, "maxLossPercent": null, "maxLossDate": null, "avgGainPercent": null, "maxDailyGainPercent": null, "maxDailyGainDate": null, "maxDailyLossPercent": null, "maxDailyLossDate": null, "dailyReturnList": null, "dailyDateList": null, "expiryProfitPercent": null, "expiryProfitAmount": null, "buyPrice": null } ] }}三. Python 实现获取股票的实时股票池数据信息
为了方便大家理解和使用, 小亥将采用 streamlit 进行编写相关的脚本, 这样有页面,也方便点击
大家可以通过 AI 自行实现, 小亥这儿提供一个简单的版本。
脚本名称为 stock_pool_history.py
直接复制粘贴即可
import streamlit as stimport requestsimport pandas as pdfrom datetime import date, timedelta# ===================== 全局配置 =====================HEADERS = { "Authorization": "stock", "Content-Type": "application/json", "Accept": "*/*", "Host": "www.yueshushu.top", "Connection": "keep-alive"}API_URL = "https://www.yueshushu.top/StockApi/stockPool/listPool"# 股票池类型枚举POOL_TYPES = [ {"code": "1", "name": "涨停"}, {"code": "2", "name": "跌停"}, {"code": "3", "name": "昨日涨停"}, {"code": "4", "name": "强势"}, {"code": "5", "name": "次新"}, {"code": "6", "name": "炸板"}, {"code": "7", "name": "热门股"},]# 页面初始化st.set_page_config( page_title="金亥跃江_股票池历史矩阵表格查询", page_icon="📊", layout="wide")# ===================== 接口请求函数(携带起止日期) =====================def request_stock_data(page_num: int, page_size: int, pool_type: str, keywords: str, start_dt: date, end_dt: date): payload = { "pageNum": page_num, "pageSize": page_size, "poolType": pool_type, "keywords": keywords.strip(), "startDate": start_dt.strftime("%Y-%m-%d"), "endDate": end_dt.strftime("%Y-%m-%d") } try: resp = requests.post(API_URL, headers=HEADERS, json=payload, timeout=25) res = resp.json() if res["success"] and res["code"] == 20000: total = res["data"]["total"] stock_list = res["data"]["list"] update_time = res["timestampStr"] return stock_list, total, update_time else: st.warning(f"接口返回异常:{res.get('message','无数据')}") return [], 0, "" except Exception as e: st.error(f"请求失败:{str(e)}") return [], 0, ""# ===================== 生成HTML表格 + 空值容错 =====================def build_html_table(stock_raw_list, start_dt: date, end_dt: date): # 生成区间内所有日期 date_range = pd.date_range(start=start_dt, end=end_dt, freq="D") date_str_list = [d.strftime("%Y-%m-%d") for d in date_range] # 表格样式 html = ''' <style> table {border-collapse: collapse; width:100%; font-size:14px;} th,td {border:1px solid #ddd; padding:8px; text-align:center;} th {background-color:#f5f7fa; white-space:nowrap;} td {white-space:nowrap;} </style> <table> <thead> <tr> <th>股票编码</th> <th>名称</th> ''' # 拼接日期表头 for day in date_str_list: html += f"<th>{day}(%)</th>" html += "</tr></thead><tbody>" # 逐只股票遍历 for stock in stock_raw_list: code = stock["code"] name = stock["name"] daily_map = {} for day_info in stock["detailList"]: d = day_info["currDate"] # 空值兼容:None则赋值0或者横线标识 close_raw = day_info.get("closePrice") pct_raw = day_info.get("amplitudeProportion") if close_raw is None or pct_raw is None: content = "-" daily_map[d] = content continue close = float(close_raw) pct = float(pct_raw) content = f"{close:.2f}({pct:.2f})" # 涨跌幅超±9.95%标红加粗 if abs(pct) >= 9.95: content = f'<span style="color:red;font-weight:bold">{content}</span>' daily_map[d] = content # 拼装一行tr html += f"<tr><td>{code}</td><td>{name}</td>" for day in date_str_list: cell_content = daily_map.get(day, "") html += f"<td>{cell_content}</td>" html += "</tr>" html += "</tbody></table>" return html# ===================== 页面主体 =====================def main(): st.title("📊 金亥跃江_股票池历史行情矩阵") st.divider() # 默认时间区间:近7天 today = date.today() week_before = today - timedelta(days=7) with st.container(border=True): c1, c2, c3, c4 = st.columns([2, 3, 2, 2]) pool_map = {item["name"]: item["code"] for item in POOL_TYPES} with c1: pool_name = st.selectbox("股票池类型", list(pool_map.keys())) pool_code = pool_map[pool_name] with c2: search_key = st.text_input("股票编码搜索", placeholder="输入000975可精准查找个股") with c3: s_date = st.date_input("开始日期", value=week_before) with c4: e_date = st.date_input("结束日期", value=today) col_q1, col_q2, col_q3 = st.columns([1,1,2]) with col_q1: page = st.number_input("页码", min_value=1, value=1) with col_q2: page_size = st.selectbox("每页数量", [10,20,30,50], index=1) with col_q3: query_btn = st.button("🔍 生成矩阵表格", type="primary") st.divider() if query_btn: with st.spinner("正在拉取数据并生成日期矩阵表格..."): stock_list, total_count, update_time = request_stock_data( page_num=page, page_size=page_size, pool_type=pool_code, keywords=search_key, start_dt=s_date, end_dt=e_date ) if not stock_list: st.info("暂无匹配数据,请修改筛选条件(日期区间/股票池/股票代码)重试") return st.success(f"✅ 查询完成 | 日期范围:{s_date} ~ {e_date} | 总计匹配股票:{total_count}只 | 数据更新时间:{update_time}") st.divider() table_html = build_html_table(stock_list, s_date, e_date) st.markdown(table_html, unsafe_allow_html=True) st.caption("说明:单元格格式=收盘价(涨跌幅%),±10%涨跌停文字标红;无数据单元格显示横线")if __name__ == "__main__": main()运行前 需要先安装一下 依赖
pip install streamlit requests pandas -i https://pypi.tuna.tsinghua.edu.cn/simple运行方式是:
streamlit run stock_pool_history.pyGoogle 浏览器会自动打开
免责声明:本文仅供技术交流,不构成任何投资建议。股市有风险,投资需谨慎。
如果你觉得这篇文章说到了心坎里,请点个“在看”,点个关注,并转发给身边的朋友,让更多人支持小亥!
本文来自网友投稿或网络内容,如有侵犯您的权益请联系我们删除,联系邮箱:596563534@qq.com 。
