Python绘制花瓣状多组相关性热图
- 2026-10-11 06:15:05
Python绘制花瓣状多组相关性热图

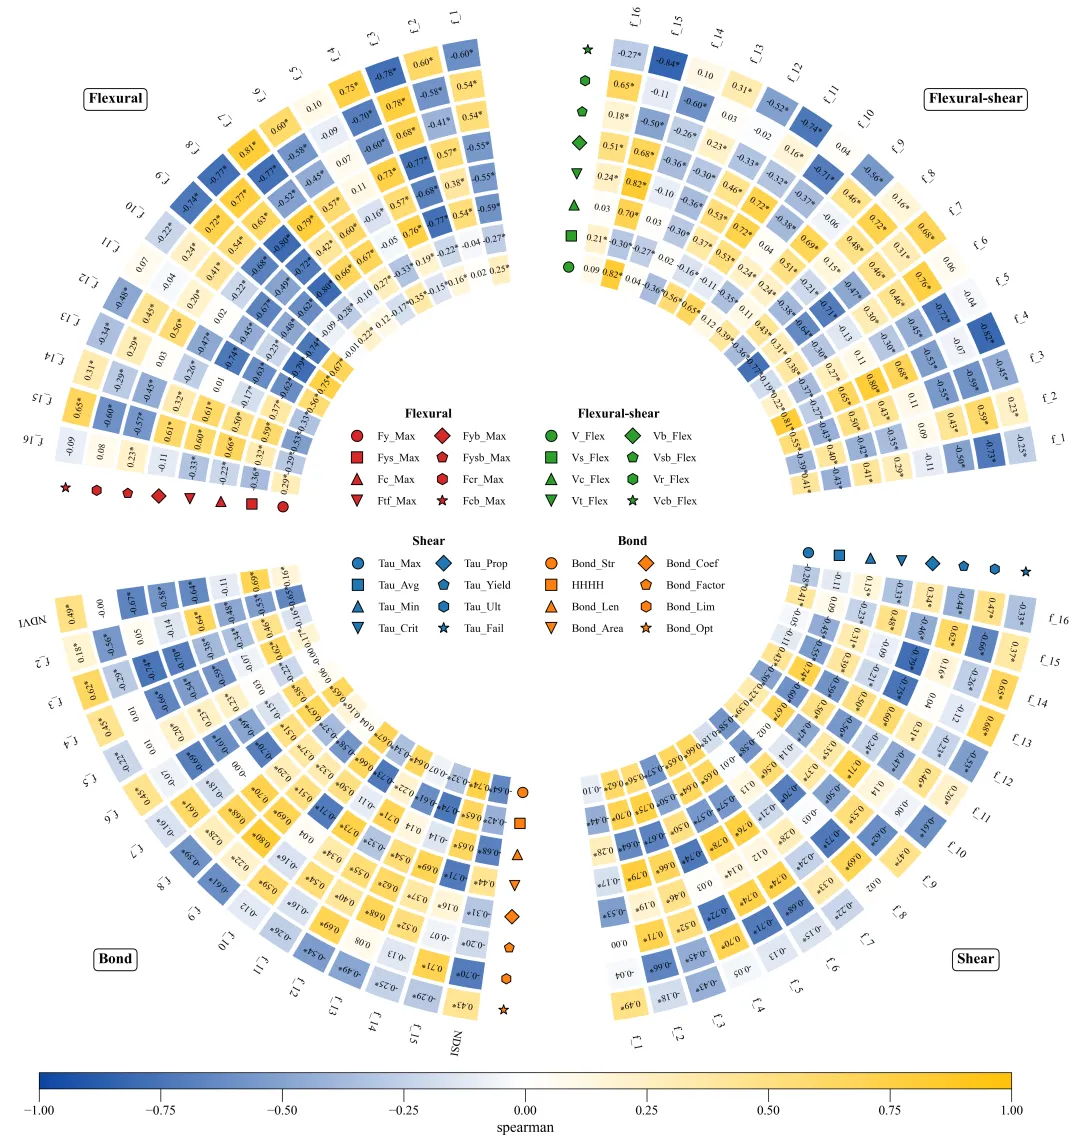
此图是一个花瓣状的相关性分析热图,用于展示四组独立的斯皮尔曼秩相关性分析结果,分别四种不同的区域。每一个扇形/花瓣/区域都分析了16个特征变量与该区域内多个不同的目标之间的单调相关关系。图中,相关系数的强度与正负通过颜色和数值来展示,黄色代表正相关,蓝色代表负相关,颜色越深表示相关性越强。每个单元格内的数字为斯皮尔曼相关系数值,*则表示通过了p<0.05的显著性检验。 



导入库与全局样式配置,是代码实现的基础同时也是绘图前的准备工作。 

颜色库 

绘图前需要做的准备 主要就是修改这里,包括颜色的选择、分析的方法,总共设置了3种,使用的数据的输入地址,结果的保存的文件夹,这两个是一个文件夹我这设置的,你可以自己改一下,那个字典里是要用的那几个文件的名称,这个要跟你得实际的数据名一样,后面的是特征列和目标列,也要跟你的实际数据一样,这里所有数据要一致,要是不一致会跳过的。 

绘图函数 包括5个参数:分析后的所有数据、特征的名称、目标的名称、颜色方案和定义扇区几何形状的参数。 













期刊图片复现|python绘制六边形相关性矩阵图 告别传统热力图!Python绘制的带百分比填充扇形+数值标注结合的高级相关性分析矩阵图 



需要的请后台私信我获取详细信息,注意只会分享练习数据和代码文件,不会提供答疑服务,代码文件中已经包含了每行代码的完整注释!!!
代码绘制成果展示
代码解释
第一部分
# =========================================================================================# ====================================== 1. 库的导入 =========================================# =========================================================================================import pandas as pdimport numpy as npimport matplotlib.pyplot as pltfrom matplotlib.colors import LinearSegmentedColormapfrom matplotlib.patches import Wedge, Patchfrom matplotlib.lines import Line2Dfrom scipy import statsimport matplotlibimport osmatplotlib.rcParams['pdf.fonttype'] = 42matplotlib.rcParams['ps.fonttype'] = 42plt.rcParams['font.family'] = 'Times New Roman'
第二部分
# =========================================================================================# ======================================2.颜色库设置=========================================# =========================================================================================COLOR_THEMES = {1: {'group_colors': {...}, 'heatmap_colors': [...], 'group_label_color': 'white'},}
第三部分
# =========================================================================================# ======================================3.绘图前需要做的准备=========================================# =========================================================================================#选择配色方案selected_scheme = 5#选择分析方法spearman, pearson,kendallselected_method = 'spearman'#输入文件的地址,输出结果的路径data_directory = r"E:\公众号素材\花瓣状热图"#每个数据文件的特征和目标data_slices = {'Flexural': {'features': slice(0, 16), 'targets': slice(16, 24)},'Flexural-shear': {'features': slice(0, 16), 'targets': slice(16, 24)},'Shear': {'features': slice(0, 16), 'targets': slice(16, 24)},'Bond': {'features': slice(0, 16), 'targets': slice(16, 24)}}#从颜色库里提取配色方案,如果没有就是用默认的颜色select_color = COLOR_THEMES.get(selected_scheme, 1)
第四部分
# =========================================================================================# ======================================4.绘图函数=========================================# =========================================================================================def create_full_ring_plot(all_data,all_feature_names,all_target_names,color_palette,sector_params, ):
第五部分
创建画布,设置颜色映射。
fig, ax = plt.subplots(figsize=(24, 24), subplot_kw={'aspect': 'equal'})ax.axis('off')heatmap_colors_value = color_palette['heatmap_colors']if isinstance(heatmap_colors_value, str):cmap = plt.get_cmap(heatmap_colors_value)else:cmap = LinearSegmentedColormap.from_list("custom_cmap", list(zip([0.0, 0.5, 1.0], heatmap_colors_value)))norm = plt.Normalize(vmin=-1, vmax=1)
第六部分
遍历每个数据分组,绘制对应的扇形区域
for idx, group_name in enumerate(group_names):features = all_feature_names[group_name]df, df_sig = all_data[group_name]['correlation_df'], all_data[group_name]['p_value_df']current_targets = all_target_names[group_name]start_angle_deg = sector_params[group_name]['start']end_angle_deg = sector_params[group_name]['end']theta_deg = np.linspace(start_angle_deg, end_angle_deg, len(features))theta_rad = np.deg2rad(theta_deg)angle_span_deg = abs(end_angle_deg - start_angle_deg) / len(features) * 0.95current_group_color = group_legend_colors[idx
第七部分
绘制出每一个扇区的每一层图
在每两个循环,先绘制出每一层,然后绘制每一层环上的每一个列的区域,然后在小区域的位置上面添加上相关性系数和显著性标记,在最外面的一圈上面加上特正名称的标注
for i, target_name in enumerate(current_targets):r_inner = radii[i]r_outer = radii[i] + 0.9values = df[target_name]sig_values = df_sig[target_name]cell_colors = cmap(norm(values))marker_angle_rad = np.deg2rad(sector_params[group_name]['marker_angle'])marker_radius = r_inner + 0.45for j in range(len(features)):ax.add_patch(wedge)text_angle_rad = theta_rad[j]text_radius = r_inner + 0.45x = text_radius * np.cos(text_angle_rad)y = text_radius * np.sin(text_angle_rad)sig_marker = '*' if sig_values.iloc[j] else ''text_val = f'{val:.2f}{sig_marker}'rot = theta_deg[j] - 90 if np.cos(text_angle_rad) > -0.01 else theta_deg[j] - 90label_radius = radii.max() + 1.7for i in range(len(features)):text_angle_rad = theta_rad[i]x = label_radius * np.cos(text_angle_rad)y = label_radius * np.sin(text_angle_rad)rot = theta_deg[i] if np.cos(text_angle_rad) > -0.01 else theta_deg[i] # - 180
第八部分
创建图例和颜色条
在中心的位置加上目标标记的图例,在主图的下面加上相关性数值大小的颜色条
group_label_angle_deg = (start_angle_deg + end_angle_deg) / 2group_label_angle_rad = np.deg2rad(group_label_angle_deg)group_label_radius = radii.max() + 4.5x = group_label_radius * np.cos(group_label_angle_rad)y = group_label_radius * np.sin(group_label_angle_rad)legend_positions = [{'bbox_to_anchor': (0.5, 0.5), 'loc': 'lower right'},{'bbox_to_anchor': (0.5, 0.5), 'loc': 'lower left'},{'bbox_to_anchor': (0.5, 0.5), 'loc': 'upper right'},{'bbox_to_anchor': (0.5, 0.5), 'loc': 'upper left'}]#遍历每个分组,为其单独创建图例for i, group_name in enumerate(group_names):#创建一个空列表,用于存放当前分组的图例句柄handles_for_group = []#获取当前分组的目标名称列表current_targets = all_target_names[group_name]#获取当前分组的标记的颜色current_group_color = group_legend_colors[i]#遍历当前分组的每个目标,为其创建图例项for j, target_name in enumerate(current_targets):handles_for_group.append(handle)leg.get_title().set_fontweight('bold')cax = fig.add_axes([0.2, 0.15, 0.6, 0.01]) # [左, 下, 宽, 高]sm = plt.cm.ScalarMappable(cmap=cmap, norm=norm)cbar = fig.colorbar(sm, cax=cax, orientation='horizontal')cbar.set_label("spearman", size=16)cbar.ax.tick_params(size=14, labelsize=14)
第九部分
执行函数
这里也有一些需要进行修改的部分,这部分是实际的执行部分,包括数据的读取,特征数据和目标数据的去读,相关性分析、绘图等
def main():group_names = ['Flexural', 'Flexural-shear', 'Shear', 'Bond']sector_params = {group_names[0]: {'start': 100, 'end': 170, 'marker_angle': 175},group_names[1]: {'start': 10, 'end': 80, 'marker_angle': 85},group_names[2]: {'start': 280, 'end': 350, 'marker_angle': 355},group_names[3]: {'start': 190, 'end': 260, 'marker_angle': 265},}all_correlation_data = {}all_features_dict = {}generic_targets_dict = {}is_first_group = Truenum_features = 0num_targets = 0for group in group_names:feature_slice = data_slices[group]['features']target_slice = data_slices[group]['targets']excel_path = os.path.join(data_directory, f"{group}.xlsx")data = pd.read_excel(excel_path)feature_data = data.iloc[:, feature_slice]target_data = data.iloc[:, target_slice]current_features = data.columns[feature_slice].tolist()current_targets = data.columns[target_slice].tolist()all_features_dict[group] = current_featuresgeneric_targets_dict[group] = current_targetsif is_first_group:num_features = len(current_features)num_targets = len(current_targets)is_first_group = Falseelif len(current_features) != num_features or len(current_targets) != num_targets:print(f"文件 {excel_path} 的数据维度与第一个文件不匹配")del all_features_dict[group]del generic_targets_dict[group]continuefor i in range(num_features):for j in range(num_targets):feature_col_numeric = pd.to_numeric(feature_col, errors='coerce')target_col_numeric = pd.to_numeric(target_col, errors='coerce')combined = pd.concat([feature_col_numeric, target_col_numeric], axis=1).dropna()if len(combined) < 2:corr, p_value = np.nan, np.nanelse:if selected_method == 'spearman':corr, p_value = stats.spearmanr(combined.iloc[:, 0], combined.iloc[:, 1])elif selected_method == 'pearson':corr, p_value = stats.pearsonr(combined.iloc[:, 0], combined.iloc[:, 1])else:corr, p_value = stats.kendalltau(combined.iloc[:, 0], combined.iloc[:, 1])correlation_matrix[i, j] = corrp_value_matrix[i, j] = p_valuedf_corr = pd.DataFrame(correlation_matrix, index=current_features, columns=current_targets)df_sig = pd.DataFrame(p_value_matrix < 0.05, index=current_features, columns=current_targets)print("\n相关性系数:")print(df_corr.to_string())print("\n显著性:")print(df_sig.to_string())all_correlation_data[group] = {'correlation_df': df_corr,'p_value_df': df_sig}create_full_ring_plot(all_data=all_correlation_data,all_feature_names=all_features_dict,all_target_names=generic_targets_dict,color_palette=select_color,sector_params=sector_params,)
如何应用?
1.选择配色方案:
selected_scheme = 392.选择分析方法:
selected_method = 'spearman'3.设置文件夹的位置:
data_directory = r"E:\公众号素材\花瓣状热图"4.设置文件名、特征列、目标列:
data_slices = {'Flexural': {'features': slice(0, 16), 'targets': slice(16, 24)},'Flexural-shear': {'features': slice(0, 16), 'targets': slice(16, 24)},'Shear': {'features': slice(0, 16), 'targets': slice(16, 24)},'Bond': {'features': slice(0, 16), 'targets': slice(16, 24)}}
5.设置文件名(目标名):
group_names = ['Flexural', 'Flexural-shear', 'Shear', 'Bond']推荐
预告
获取方式
本文来自网友投稿或网络内容,如有侵犯您的权益请联系我们删除,联系邮箱:596563534@qq.com 。
