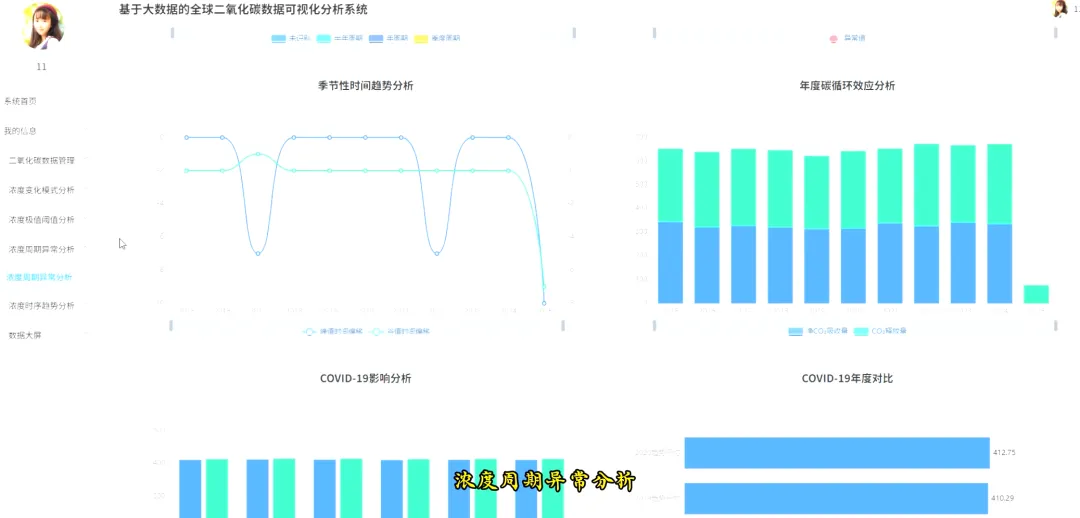
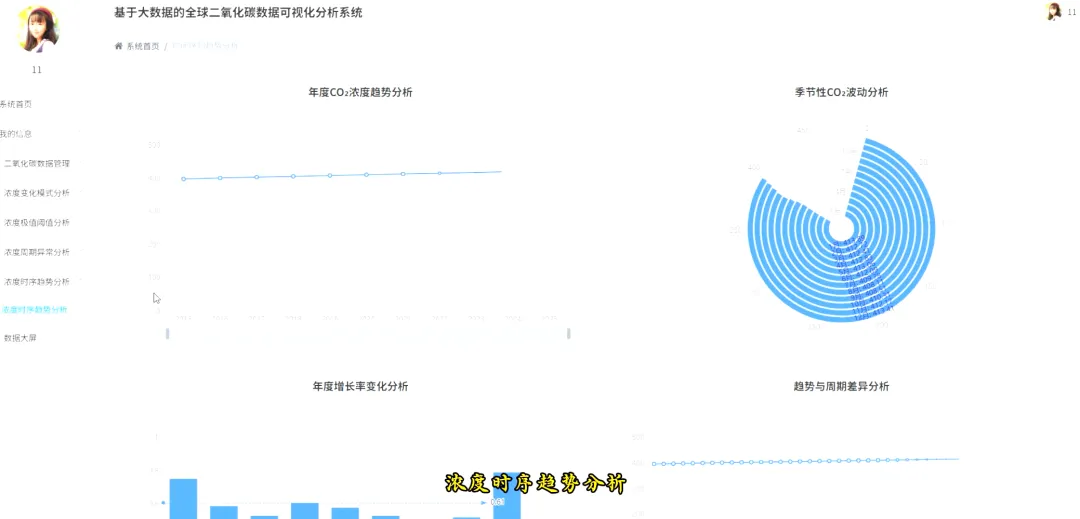
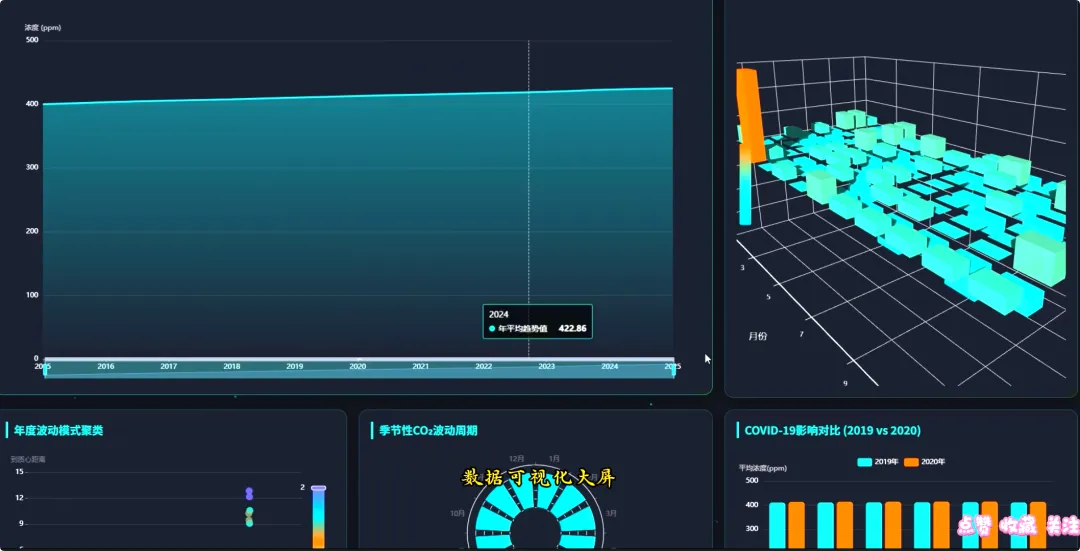
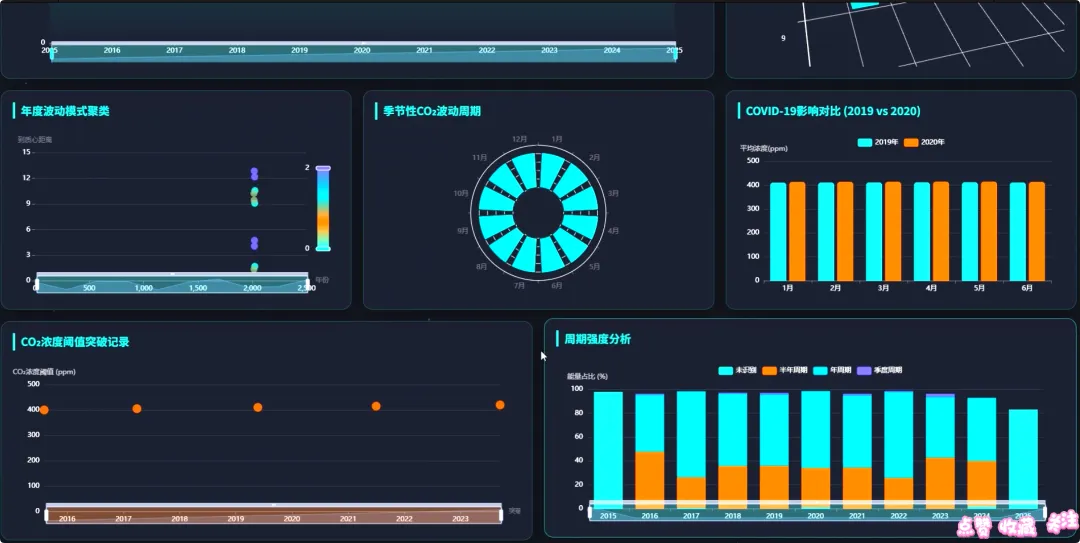
from pyspark.sql import SparkSessionfrom pyspark.sql.functions import col, avg, max, min, count, when, lag, month, yearfrom pyspark.sql.window import Windowimport pandas as pdfrom django.http import JsonResponsefrom django.views import Viewspark = SparkSession.builder.appName("CO2AnalysisSystem").master("local[*]").getOrCreate()class AnnualTrendAnalysisView(View): def get(self, request): spark_df = spark.read.csv("hdfs://localhost:9000/data/co2_data.csv", header=True, inferSchema=True) yearly_trend = spark_df.groupBy("year").agg(avg("trend").alias("avg_trend"), max("cycle").alias("max_cycle"), min("cycle").alias("min_cycle")) yearly_trend = yearly_trend.withColumn("next_year_trend", lag("avg_trend", -1).over(Window.orderBy("year"))) yearly_trend = yearly_trend.withColumn("growth_rate", (col("next_year_trend") - col("avg_trend")) / col("avg_trend") * 100) pandas_df = yearly_trend.dropna().toPandas() result_data = [] for index, row in pandas_df.iterrows(): result_data.append({"year": int(row['year']), "avg_trend": round(row['avg_trend'], 2), "growth_rate": round(row['growth_rate'], 2)}) return JsonResponse({"code": 200, "data": result_data})class ThresholdBreakthroughView(View): def post(self, request): threshold_value = float(request.POST.get('threshold', 400.0)) spark_df = spark.read.csv("hdfs://localhost:9000/data/co2_data.csv", header=True, inferSchema=True) spark_df = spark_df.withColumn("exceed_status", when(col("trend") > threshold_value, 1).otherwise(0)) daily_stats = spark_df.groupBy("year", "month").agg(count(when(col("exceed_status") == 1, True)).alias("exceed_days"), avg("trend").alias("monthly_avg")) window_spec = Window.partitionBy("year").orderBy("month") monthly_stats = daily_stats.withColumn("prev_month_avg", lag("monthly_avg", 1).over(window_spec)) monthly_stats = monthly_stats.withColumn("mom_change", (col("monthly_avg") - col("prev_month_avg")) / col("prev_month_avg") * 100) pandas_df = monthly_stats.dropna().toPandas() result_data = [] for index, row in pandas_df.iterrows(): result_data.append({"year_month": f"{int(row['year'])}-{int(row['month'])}", "exceed_days": int(row['exceed_days']), "mom_change": round(row['mom_change'], 2)}) return JsonResponse({"code": 200, "threshold": threshold_value, "data": result_data})class SeasonalPatternView(View): def get(self, request): spark_df = spark.read.csv("hdfs://localhost:9000/data/co2_data.csv", header=True, inferSchema=True) monthly_avg = spark_df.groupBy("month").agg(avg("cycle").alias("avg_cycle"), avg("trend").alias("avg_trend")) monthly_avg = monthly_avg.withColumn("cycle_trend_ratio", col("avg_cycle") / col("avg_trend")) window_spec = Window.orderBy("month") monthly_avg = monthly_avg.withColumn("prev_cycle", lag("avg_cycle", 1).over(window_spec)) monthly_avg = monthly_avg.withColumn("acceleration", (col("avg_cycle") - col("prev_cycle"))) pandas_df = monthly_avg.dropna().toPandas() result_data = [] for index, row in pandas_df.iterrows(): result_data.append({"month": int(row['month']), "avg_cycle": round(row['avg_cycle'], 2), "ratio": round(row['cycle_trend_ratio'], 4), "acceleration": round(row['acceleration'], 2)}) return JsonResponse({"code": 200, "data": result_data})