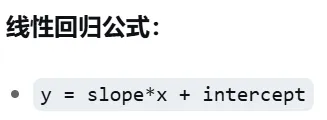
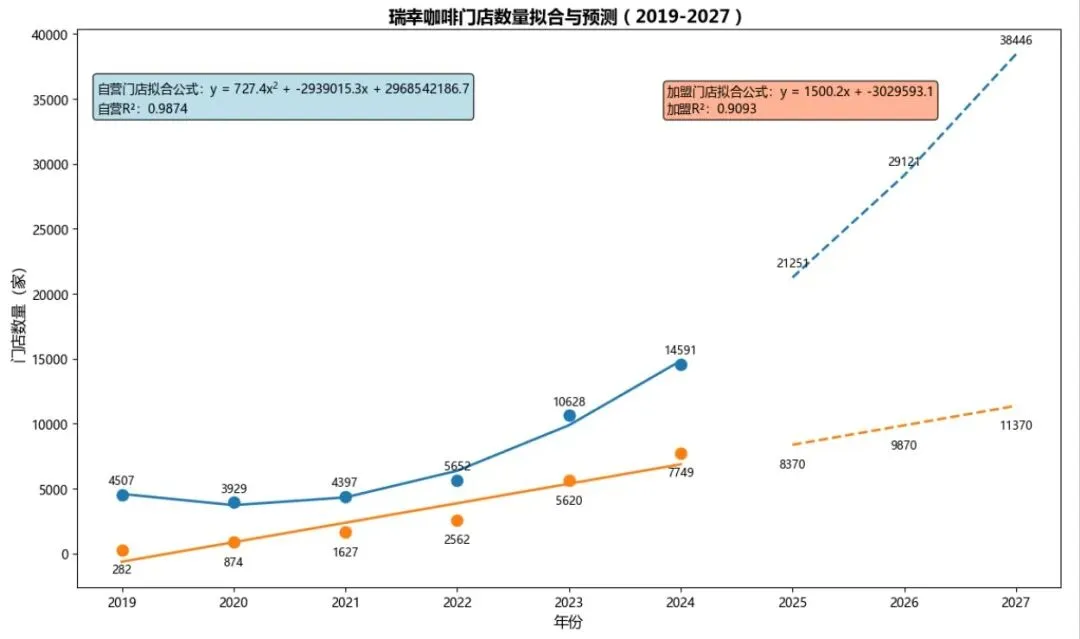
本来是打算考完直接开始写的,结果不知道咋了生病两天,直接轻了4斤。不过今天已经完全好了,先来讲一下之前大作业做到的一个吧,属于是分析瑞幸门店数量的。嗯,但是做的很基础,所以仅仅是提供一个线性回归和多元回归的案例,对于实际门店数量的预测极其不准确。完整的代码在文末,接下来就是先讲一下什么是线性回归什么是多项式回归,然后逐步拆分一下代码。多项式回归方程就是可以表示为多项式的形式像是几次方啊这种拟合优度系数是模型好不好的第一判断,拟合优度系数的值是在0到1之间的,数值越大说明拟合效果越好,模型也越好,不过太高的话也可能有过拟合的问题,什么是过拟合,该如何解决过拟合的问题后续也会慢慢有介绍,边学边写咯~然后下面是我的一个最终成品图,这就可以看出来我刚刚说的拟合优度系数这些内容了。
import numpy as npfrom sklearn.linear_model import LinearRegressionfrom sklearn.preprocessing import PolynomialFeaturesimport matplotlib.pyplot as pltfrom sklearn.metrics import r2_score
plt.rcParams['font.sans-serif'] = ['Microsoft YaHei'] # 微软雅黑plt.rcParams['axes.unicode_minus'] = False # 修复负号plt.rcParams['mathtext.fontset'] = 'custom' # 自定义数学符号字体plt.rcParams['mathtext.rm'] = 'Microsoft YaHei' # 数学符号用微软雅黑plt.rcParams['mathtext.it'] = 'Microsoft YaHei:italic' # 斜体用微软雅黑plt.rcParams['figure.dpi'] = 100
years_original = np.array([2019, 2020, 2021, 2022, 2023, 2024])self_operated = np.array([4507, 3929, 4397, 5652, 10628, 14591]) # 自营franchise = np.array([282, 874, 1627, 2562, 5620, 7749]) # 加盟predict_years = np.array([2025, 2026, 2027])all_years = np.concatenate([years_original, predict_years])
## 3.1 自营门店:2次多项式回归poly = PolynomialFeatures(degree=2)X_poly_self = poly.fit_transform(years_original.reshape(-1, 1))poly_self = LinearRegression()poly_self.fit(X_poly_self, self_operated)self_fit = poly_self.predict(X_poly_self)X_poly_predict = poly.fit_transform(predict_years.reshape(-1, 1))self_pred = poly_self.predict(X_poly_predict)r2_self = r2_score(self_operated, self_fit)# 提取系数+构建公式coeffs = poly_self.coef_intercept = poly_self.intercept_a, b = coeffs[2], coeffs[1]self_formula = f'y = {a:.1f}x$^2$ + {b:.1f}x + {intercept:.1f}'
lr_franchise = LinearRegression()lr_franchise.fit(years_original.reshape(-1, 1), franchise)fran_fit = lr_franchise.predict(years_original.reshape(-1, 1))fran_pred = lr_franchise.predict(predict_years.reshape(-1, 1))r2_fran = r2_score(franchise, fran_fit)slope_fran = lr_franchise.coef_[0]intercept_fran = lr_franchise.intercept_fran_formula = f'y = {slope_fran:.1f}x + {intercept_fran:.1f}'
# 4. 绘图fig, ax = plt.subplots(figsize=(14, 8))# 4.1 绘制自营门店ax.scatter(years_original, self_operated, color='#1f77b4', s=80, label='自营门店(实际)', zorder=5)ax.plot(years_original, self_fit, color='#1f77b4', linewidth=2, label='自营门店(拟合,2次多项式)')ax.plot(predict_years, self_pred, color='#1f77b4', linewidth=2, linestyle='--', label='自营门店(预测)')# 4.2 绘制加盟门店ax.scatter(years_original, franchise, color='#ff7f0e', s=80, label='加盟门店(实际)', zorder=5)ax.plot(years_original, fran_fit, color='#ff7f0e', linewidth=2, label='加盟门店(拟合,线性)')ax.plot(predict_years, fran_pred, color='#ff7f0e', linewidth=2, linestyle='--', label='加盟门店(预测)')
# 4.3 标注数值## 自营实际值for x, y in zip(years_original, self_operated): ax.text(x, y + 800, f'{y}', ha='center', fontsize=9, fontfamily='Microsoft YaHei')## 自营预测值for x, y in zip(predict_years, self_pred): ax.text(x, y + 800, f'{round(y)}', ha='center', fontsize=9, style='italic', fontfamily='Microsoft YaHei')## 加盟实际值for x, y in zip(years_original, franchise): ax.text(x, y - 1800, f'{y}', ha='center', fontsize=9, fontfamily='Microsoft YaHei')## 加盟预测值for x, y in zip(predict_years, fran_pred): ax.text(x, y - 1800, f'{round(y)}', ha='center', fontsize=9, style='italic', fontfamily='Microsoft YaHei')# 4.4 标注公式和R²(核心修改:垂直位置从0.95下调到0.85)# 自营公式(左上角,y轴位置从0.95→0.85)ax.text(0.02, 0.85, f'自营门店拟合公式:{self_formula}\n自营R²:{r2_self:.4f}', transform=ax.transAxes, fontsize=10, fontfamily='Microsoft YaHei', bbox=dict(boxstyle='round', facecolor='lightblue', alpha=0.8))# 加盟公式(右上角,y轴位置从0.95→0.85)ax.text(0.60, 0.85, f'加盟门店拟合公式:{fran_formula}\n加盟R²:{r2_fran:.4f}', transform=ax.transAxes, fontsize=10, fontfamily='Microsoft YaHei', bbox=dict(boxstyle='round', facecolor='lightsalmon', alpha=0.8))# 4.5 基础设置ax.set_xlabel('年份', fontsize=12, fontfamily='Microsoft YaHei')ax.set_ylabel('门店数量(家)', fontsize=12, fontfamily='Microsoft YaHei')ax.set_title('瑞幸咖啡门店数量拟合与预测(2019-2027)', fontsize=14, fontweight='bold', fontfamily='Microsoft YaHei')ax.legend(loc='lower right', fontsize=10, fontfamily='Microsoft YaHei')ax.grid(True, alpha=0.3)ax.set_xticks(all_years)ax.set_ylim(0, max(self_pred) + 2500)
# 1. 导入所需库import numpy as npfrom sklearn.linear_model import LinearRegressionfrom sklearn.preprocessing import PolynomialFeaturesimport matplotlib.pyplot as pltfrom sklearn.metrics import r2_score# Windows系统字体配置 plt.rcParams['font.sans-serif'] = ['Microsoft YaHei'] # 微软雅黑plt.rcParams['axes.unicode_minus'] = False # 修复负号plt.rcParams['mathtext.fontset'] = 'custom' # 自定义数学符号字体plt.rcParams['mathtext.rm'] = 'Microsoft YaHei' # 数学符号用微软雅黑plt.rcParams['mathtext.it'] = 'Microsoft YaHei:italic' # 斜体用微软雅黑plt.rcParams['figure.dpi'] = 100 # 适配Notebook显示# 2. 准备数据years_original = np.array([2019, 2020, 2021, 2022, 2023, 2024])self_operated = np.array([4507, 3929, 4397, 5652, 10628, 14591]) # 自营franchise = np.array([282, 874, 1627, 2562, 5620, 7749]) # 加盟predict_years = np.array([2025, 2026, 2027])all_years = np.concatenate([years_original, predict_years])# 3. 模型构建## 3.1 自营门店:2次多项式回归poly = PolynomialFeatures(degree=2)X_poly_self = poly.fit_transform(years_original.reshape(-1, 1))poly_self = LinearRegression()poly_self.fit(X_poly_self, self_operated)self_fit = poly_self.predict(X_poly_self)X_poly_predict = poly.fit_transform(predict_years.reshape(-1, 1))self_pred = poly_self.predict(X_poly_predict)r2_self = r2_score(self_operated, self_fit)# 提取系数+构建公式coeffs = poly_self.coef_intercept = poly_self.intercept_a, b = coeffs[2], coeffs[1]self_formula = f'y = {a:.1f}x$^2$ + {b:.1f}x + {intercept:.1f}'## 3.2 加盟门店:线性回归lr_franchise = LinearRegression()lr_franchise.fit(years_original.reshape(-1, 1), franchise)fran_fit = lr_franchise.predict(years_original.reshape(-1, 1))fran_pred = lr_franchise.predict(predict_years.reshape(-1, 1))r2_fran = r2_score(franchise, fran_fit)slope_fran = lr_franchise.coef_[0]intercept_fran = lr_franchise.intercept_fran_formula = f'y = {slope_fran:.1f}x + {intercept_fran:.1f}'# 4. 绘图fig, ax = plt.subplots(figsize=(14, 8))# 4.1 绘制自营门店ax.scatter(years_original, self_operated, color='#1f77b4', s=80, label='自营门店(实际)', zorder=5)ax.plot(years_original, self_fit, color='#1f77b4', linewidth=2, label='自营门店(拟合,2次多项式)')ax.plot(predict_years, self_pred, color='#1f77b4', linewidth=2, linestyle='--', label='自营门店(预测)')# 4.2 绘制加盟门店ax.scatter(years_original, franchise, color='#ff7f0e', s=80, label='加盟门店(实际)', zorder=5)ax.plot(years_original, fran_fit, color='#ff7f0e', linewidth=2, label='加盟门店(拟合,线性)')ax.plot(predict_years, fran_pred, color='#ff7f0e', linewidth=2, linestyle='--', label='加盟门店(预测)')# 4.3 标注数值## 自营实际值for x, y in zip(years_original, self_operated): ax.text(x, y + 800, f'{y}', ha='center', fontsize=9, fontfamily='Microsoft YaHei')## 自营预测值for x, y in zip(predict_years, self_pred): ax.text(x, y + 800, f'{round(y)}', ha='center', fontsize=9, style='italic', fontfamily='Microsoft YaHei')## 加盟实际值for x, y in zip(years_original, franchise): ax.text(x, y - 1800, f'{y}', ha='center', fontsize=9, fontfamily='Microsoft YaHei')## 加盟预测值for x, y in zip(predict_years, fran_pred): ax.text(x, y - 1800, f'{round(y)}', ha='center', fontsize=9, style='italic', fontfamily='Microsoft YaHei')# 4.4 标注公式和R²(核心修改:垂直位置从0.95下调到0.85)# 自营公式(左上角,y轴位置从0.95→0.85)ax.text(0.02, 0.85, f'自营门店拟合公式:{self_formula}\n自营R²:{r2_self:.4f}', transform=ax.transAxes, fontsize=10, fontfamily='Microsoft YaHei', bbox=dict(boxstyle='round', facecolor='lightblue', alpha=0.8))# 加盟公式(右上角,y轴位置从0.95→0.85)ax.text(0.60, 0.85, f'加盟门店拟合公式:{fran_formula}\n加盟R²:{r2_fran:.4f}', transform=ax.transAxes, fontsize=10, fontfamily='Microsoft YaHei', bbox=dict(boxstyle='round', facecolor='lightsalmon', alpha=0.8))# 4.5 基础设置ax.set_xlabel('年份', fontsize=12, fontfamily='Microsoft YaHei')ax.set_ylabel('门店数量(家)', fontsize=12, fontfamily='Microsoft YaHei')ax.set_title('瑞幸咖啡门店数量拟合与预测(2019-2027)', fontsize=14, fontweight='bold', fontfamily='Microsoft YaHei')ax.legend(loc='lower right', fontsize=10, fontfamily='Microsoft YaHei')ax.grid(True, alpha=0.3)ax.set_xticks(all_years)ax.set_ylim(0, max(self_pred) + 2500)plt.tight_layout()plt.savefig('瑞幸门店预测图.png', dpi=300, bbox_inches='tight', fontfamily='Microsoft YaHei')plt.show()# 6. 输出结果print("=== 拟合与预测结果汇总 ===")print(f"自营门店(2次多项式回归)R²:{r2_self:.4f}")print(f"加盟门店(线性回归)R²:{r2_fran:.4f}")print("\n=== 预测数值(2025-2027)===")for year, s, f in zip(predict_years, self_pred, fran_pred): print(f"{year}年:自营≈{round(s)}家,加盟≈{round(f)}家,总门店≈{round(f+s)}家")

 10个月宝宝每天需要喝多少奶粉?