# pip install pandas numpy matplotlib seaborn statsmodels scikit-learn joblibimport osimport pandas as pdimport numpy as npimport matplotlib.pyplot as pltimport seaborn as snsfrom datetime import datetime, timedeltaimport warningswarnings.filterwarnings('ignore')# 时间序列分析相关库from statsmodels.tsa.holtwinters import ExponentialSmoothingfrom statsmodels.tsa.seasonal import seasonal_decomposefrom statsmodels.tsa.stattools import acffrom statsmodels.tsa.arima.model import ARIMAfrom sklearn.metrics import mean_squared_error, mean_absolute_error, r2_scoreimport joblib# 设置中文字体plt.rcParams['font.sans-serif'] = ['SimHei', 'Microsoft YaHei', 'DejaVu Sans']plt.rcParams['axes.unicode_minus'] = Falsedef get_desktop_path():"""获取桌面路径"""return os.path.join(os.path.expanduser("~"), "Desktop")def create_directories(base_path):"""创建必要的目录结构""" directories = ["Models","Predictions","Plots","Residuals_Analysis","Decomposition" ]for directory in directories: dir_path = os.path.join(base_path, directory)if not os.path.exists(dir_path): os.makedirs(dir_path)print(f"创建目录: {dir_path}")def prepare_time_series(data, disease_col, date_col='timestamp'):"""准备时间序列数据"""# 确保日期格式正确 data[date_col] = pd.to_datetime(data[date_col])# 创建完整的时间序列 full_dates = pd.date_range(start=data[date_col].min(), end=data[date_col].max(), freq='D') full_df = pd.DataFrame({date_col: full_dates})# 合并数据 disease_data = data[[date_col, disease_col]].merge( full_df, on=date_col, how='right' ).sort_values(date_col).reset_index(drop=True)# 处理缺失值 disease_data[disease_col] = disease_data[disease_col].interpolate(method='linear') disease_data[disease_col] = disease_data[disease_col].ffill().bfill()return disease_datadef simple_auto_arima(train_data, seasonal_period=12):"""简化的自动ARIMA实现""" best_aic = np.inf best_order = (0, 0, 0) best_model = None# 尝试一些常见的ARIMA参数组合 p_values = [0, 1, 2] d_values = [0, 1] q_values = [0, 1, 2]for p in p_values:for d in d_values:for q in q_values: try: model = ARIMA(train_data, order=(p, d, q)) fitted_model = model.fit() aic = fitted_model.aicif aic < best_aic: best_aic = aic best_order = (p, d, q) best_model = fitted_model except:continuereturn best_model, best_order, best_aic

try:# 2. 乘法季节性模型if all(train_data > 0): hw_multiplicative = ExponentialSmoothing( train_data, seasonal_periods=frequency, trend='add', seasonal='mul', initialization_method="estimated" ).fit() models["HW_Multiplicative"] = hw_multiplicative model_names.append("HW_Multiplicative")print(" 乘法季节性模型拟合成功")else:print(" 数据包含零或负值,跳过乘法季节性模型") except Exception as e:print(f" 乘法季节性模型拟合失败: {e}") try:# 3. 简化的ARIMA模型 arima_model, order, aic = simple_auto_arima(train_data, frequency)if arima_model is not None: models["ARIMA"] = arima_model model_names.append("ARIMA")print(f" ARIMA模型拟合成功, order={order}, AIC={aic:.2f}") except Exception as e:print(f" ARIMA模型拟合失败: {e}") try:# 4. 简单季节性模型(无趋势) hw_seasonal = ExponentialSmoothing( train_data, seasonal_periods=frequency, trend=None, seasonal='add', initialization_method="estimated" ).fit() models["HW_Seasonal"] = hw_seasonal model_names.append("HW_Seasonal")print(" 简单季节性模型拟合成功") except Exception as e:print(f" 简单季节性模型拟合失败: {e}")return models, model_namesdef select_best_model(models, train_data):"""选择最佳模型""" best_model_name = None best_model = None best_aic = np.inffor model_name, model in models.items(): try:if model_name.startswith("HW_"):# Holt-Winters模型使用AIC aic_val = model.aicelif model_name == "ARIMA":# ARIMA模型使用AIC aic_val = model.aicelse:# 其他模型使用MSE fitted_values = model.fittedvalues if hasattr(model, 'fittedvalues') else model.predict() aic_val = np.sum((fitted_values - train_data) ** 2)if aic_val < best_aic: best_aic = aic_val best_model_name = model_name best_model = model except Exception as e:print(f" 评估模型 {model_name} 时出错: {e}")continuereturn best_model_name, best_modeldef calculate_metrics(y_true, y_pred):"""计算评估指标"""# 处理可能的NaN值 mask = ~(np.isnan(y_true) | np.isnan(y_pred)) y_true_clean = y_true[mask] y_pred_clean = y_pred[mask]if len(y_true_clean) == 0:return np.nan, np.nan, np.nan rmse = np.sqrt(mean_squared_error(y_true_clean, y_pred_clean)) mae = mean_absolute_error(y_true_clean, y_pred_clean) r2 = r2_score(y_true_clean, y_pred_clean)return rmse, mae, r2def plot_predictions(pred_df, disease, model_type, test_r2, test_rmse, save_path):"""绘制预测结果图""" fig, axes = plt.subplots(2, 2, figsize=(16, 12)) fig.suptitle(f'{disease} - 时间序列模型分析结果', fontsize=16)
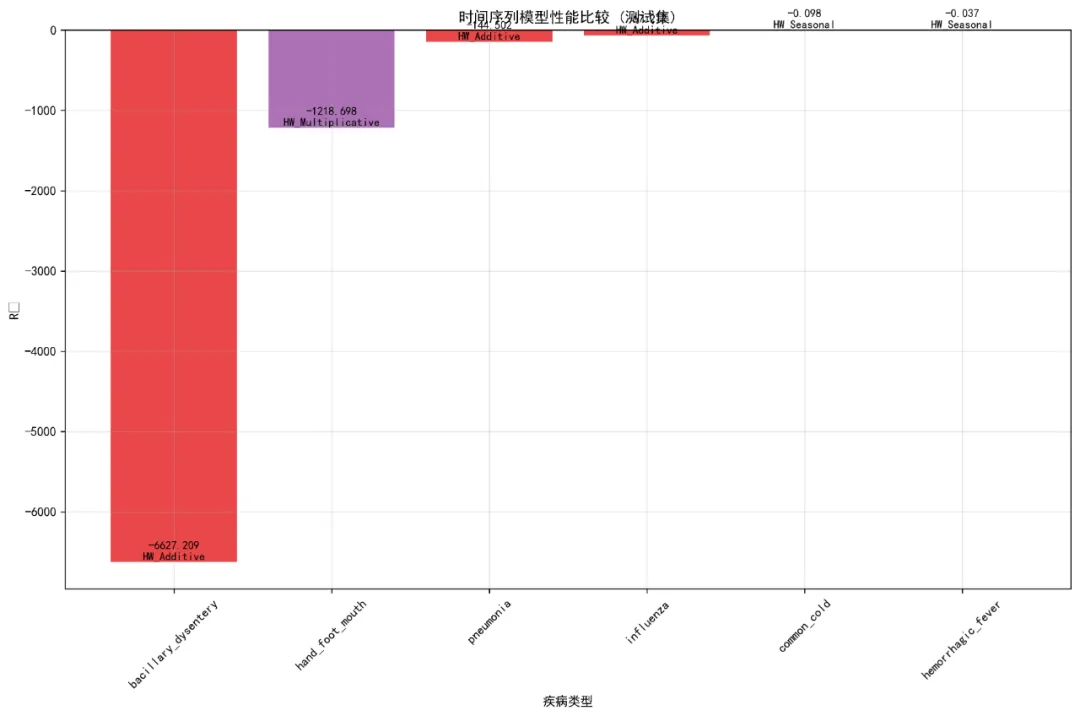
# 1. 预测结果对比图 axes[0, 0].plot(pred_df['Date'], pred_df['Actual'], label='真实值', color='blue', linewidth=1) axes[0, 0].plot(pred_df['Date'], pred_df['Predicted'], label='预测值', color='red', linestyle='--', linewidth=1)if'Lower_95'in pred_df.columns and not all(pd.isna(pred_df['Lower_95'])): axes[0, 0].fill_between(pred_df['Date'], pred_df['Lower_95'], pred_df['Upper_95'], alpha=0.3, color='lightblue', label='95%置信区间') axes[0, 0].set_title(f'预测结果对比 (R²={test_r2:.3f}, RMSE={test_rmse:.1f})') axes[0, 0].set_xlabel('日期') axes[0, 0].set_ylabel('病例数') axes[0, 0].legend() axes[0, 0].grid(True, alpha=0.3)# 2. 实际值 vs 预测值散点图 valid_data = pred_df.dropna(subset=['Actual', 'Predicted'])if len(valid_data) > 1: correlation = valid_data['Actual'].corr(valid_data['Predicted']) axes[0, 1].scatter(valid_data['Actual'], valid_data['Predicted'], alpha=0.6, color='darkgreen') min_val = min(valid_data['Actual'].min(), valid_data['Predicted'].min()) max_val = max(valid_data['Actual'].max(), valid_data['Predicted'].max()) axes[0, 1].plot([min_val, max_val], [min_val, max_val], 'r--', linewidth=2) axes[0, 1].set_title(f'实际值 vs 预测值 (相关系数: {correlation:.3f})')else: axes[0, 1].text(0.5, 0.5, '无有效数据', ha='center', va='center', transform=axes[0, 1].transAxes) axes[0, 1].set_title('实际值 vs 预测值') axes[0, 1].set_xlabel('实际病例数') axes[0, 1].set_ylabel('预测病例数') axes[0, 1].grid(True, alpha=0.3)
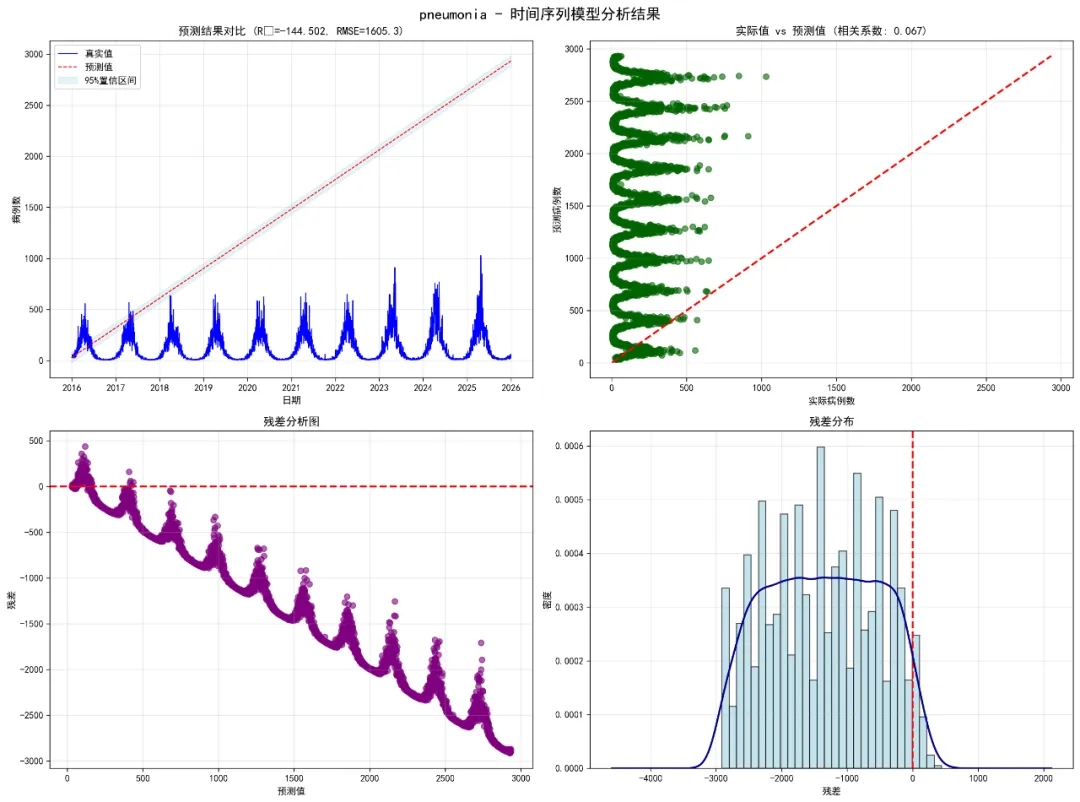
# 3. 残差分析图if'Residuals'in pred_df.columns: valid_residuals = pred_df.dropna(subset=['Predicted', 'Residuals'])if len(valid_residuals) > 0: axes[1, 0].scatter(valid_residuals['Predicted'], valid_residuals['Residuals'], alpha=0.6, color='purple') axes[1, 0].axhline(y=0, color='red', linestyle='--', linewidth=2) axes[1, 0].set_title('残差分析图') axes[1, 0].set_xlabel('预测值') axes[1, 0].set_ylabel('残差') axes[1, 0].grid(True, alpha=0.3)# 4. 残差分布图if'Residuals'in pred_df.columns: residuals_clean = pred_df['Residuals'].dropna()if len(residuals_clean) > 0: axes[1, 1].hist(residuals_clean, bins=30, density=True, alpha=0.7, color='lightblue', edgecolor='black') axes[1, 1].axvline(x=0, color='red', linestyle='--', linewidth=2)# 添加密度曲线 try: residuals_clean.plot.density(ax=axes[1, 1], color='darkblue', linewidth=2) except: pass axes[1, 1].set_title('残差分布') axes[1, 1].set_xlabel('残差') axes[1, 1].set_ylabel('密度') axes[1, 1].grid(True, alpha=0.3) plt.tight_layout() plt.savefig(os.path.join(save_path, f'{disease}_TS_Results.png'), dpi=300, bbox_inches='tight') plt.close()def plot_decomposition(train_data, disease, dates, frequency=12, save_path=None):"""绘制时间序列分解图""" try:if len(train_data) > 2 * frequency: decomposition = seasonal_decompose(train_data, model='additive', period=frequency) fig, axes = plt.subplots(4, 1, figsize=(12, 10))# 原始序列 axes[0].plot(dates, train_data, color='black', linewidth=1) axes[0].set_title('原始时间序列') axes[0].set_ylabel('病例数') axes[0].grid(True, alpha=0.3)# 趋势成分 axes[1].plot(dates, decomposition.trend, color='darkblue', linewidth=1) axes[1].set_title('趋势成分') axes[1].set_ylabel('趋势') axes[1].grid(True, alpha=0.3)# 季节性成分 axes[2].plot(dates, decomposition.seasonal, color='darkgreen', linewidth=1) axes[2].set_title('季节性成分') axes[2].set_ylabel('季节性') axes[2].grid(True, alpha=0.3)# 残差成分 axes[3].plot(dates, decomposition.resid, color='darkred', linewidth=1) axes[3].set_title('残差成分') axes[3].set_xlabel('日期') axes[3].set_ylabel('残差') axes[3].grid(True, alpha=0.3) plt.tight_layout()if save_path: plt.savefig(os.path.join(save_path, f'{disease}_Decomposition.png'), dpi=300, bbox_inches='tight') plt.close()return decomposition except Exception as e:print(f" 时间序列分解失败: {e}")return Nonedef plot_seasonal_pattern(decomposition, disease, frequency=12, save_path=None):"""绘制季节性模式图""" try:if decomposition is not None and hasattr(decomposition, 'seasonal'): seasonal_data = decomposition.seasonal[:frequency] plt.figure(figsize=(10, 6)) plt.plot(range(1, frequency + 1), seasonal_data, color='darkgreen', linewidth=2, marker='o') plt.title(f'{disease} - 季节性模式') plt.xlabel('月份'if frequency == 12 else'周期') plt.ylabel('季节性成分') plt.grid(True, alpha=0.3)if save_path: plt.savefig(os.path.join(save_path, f'{disease}_Seasonal_Pattern.png'), dpi=300, bbox_inches='tight') plt.close() except Exception as e:print(f" 季节性模式图生成失败: {e}")def plot_residual_acf(residuals, disease, save_path):"""绘制残差自相关图""" try: residuals_clean = residuals.dropna()if len(residuals_clean) > 1: acf_values = acf(residuals_clean, nlags=min(40, len(residuals_clean) - 1), fft=False) lags = range(len(acf_values)) plt.figure(figsize=(10, 6)) plt.bar(lags, acf_values, width=0.1, color='steelblue') plt.axhline(y=0, color='black') plt.axhline(y=1.96 / np.sqrt(len(residuals_clean)), color='red', linestyle='--', label='95%置信界限') plt.axhline(y=-1.96 / np.sqrt(len(residuals_clean)), color='red', linestyle='--') plt.title(f'{disease} - 残差自相关图') plt.xlabel('滞后') plt.ylabel('自相关系数') plt.legend() plt.grid(True, alpha=0.3) plt.savefig(os.path.join(save_path, f'{disease}_Residuals_ACF.png'), dpi=300, bbox_inches='tight') plt.close() except Exception as e:print(f" 残差自相关图生成失败: {e}")def main():"""主函数"""print("开始时间序列疾病预测建模...")# 设置路径 desktop_path = get_desktop_path() data_path = os.path.join(desktop_path, "Results时间", "combined_weather_disease_data.csv") results_path = os.path.join(desktop_path, "Results时间HW")# 创建目录 create_directories(results_path)# 目标疾病 target_diseases = ["influenza", "common_cold", "pneumonia","bacillary_dysentery", "hand_foot_mouth","hemorrhagic_fever" ]print(f"目标疾病: {', '.join(target_diseases)}")# 读取数据 try: combined_data = pd.read_csv(data_path) combined_data['timestamp'] = pd.to_datetime(combined_data['timestamp'])print("数据读取成功")print(f"数据时间范围: {combined_data['timestamp'].min()} 到 {combined_data['timestamp'].max()}") except Exception as e:print(f"数据读取失败: {e}")return# 存储结果 results_summary = [] predictions_list = [] models_dict = {}# 对每种疾病进行建模for disease in target_diseases:print(f"\n正在处理疾病: {disease}") try:# 检查疾病列是否存在if disease not in combined_data.columns:print(f" 疾病列 '{disease}' 不存在,跳过")continue# 准备时间序列数据 disease_data = prepare_time_series(combined_data, disease)# 划分训练集和测试集 train_data = disease_data[disease_data['timestamp'] < pd.to_datetime('2016-01-01')] test_data = disease_data[disease_data['timestamp'] >= pd.to_datetime('2016-01-01')]print(f" 训练集大小: {len(train_data)}, 测试集大小: {len(test_data)}")if len(train_data) == 0 or len(test_data) == 0:print(f" 数据不足,跳过疾病: {disease}")continue# 提取时间序列数据(使用月度频率) train_ts = train_data[disease].values test_ts = test_data[disease].values frequency = 12 # 月度频率# 拟合时间序列模型print(" 拟合时间序列模型...") models, model_names = fit_time_series_models(train_ts, frequency)if not models:print(f" 所有时间序列模型都拟合失败,跳过疾病: {disease}")continue# 选择最佳模型 best_model_name, best_model = select_best_model(models, train_ts)print(f" 选择的最佳模型: {best_model_name}")# 预测 forecast_period = len(test_ts)if best_model_name.startswith("HW_"):# Holt-Winters模型预测 forecast_result = best_model.forecast(forecast_period) test_pred = forecast_result# 获取训练集拟合值 train_fitted = best_model.fittedvalues# 简化置信区间计算 std_error = np.std(train_ts - train_fitted) if len(train_fitted) > 0 else 1 lower_95 = test_pred - 1.96 * std_error upper_95 = test_pred + 1.96 * std_error lower_80 = test_pred - 1.28 * std_error upper_80 = test_pred + 1.28 * std_errorelif best_model_name == "ARIMA":# ARIMA模型预测 forecast_result = best_model.forecast(forecast_period) test_pred = forecast_result train_fitted = best_model.fittedvalues# 简化置信区间 std_error = np.std(train_ts - train_fitted) if len(train_fitted) > 0 else 1 lower_95 = test_pred - 1.96 * std_error upper_95 = test_pred + 1.96 * std_error lower_80 = test_pred - 1.28 * std_error upper_80 = test_pred + 1.28 * std_error# 确保预测值和实际值长度一致 min_length = min(len(test_pred), len(test_ts)) test_pred = test_pred[:min_length] y_test = test_ts[:min_length] test_dates = test_data['timestamp'].values[:min_length]# 计算测试集指标 test_rmse, test_mae, test_r2 = calculate_metrics(y_test, test_pred)# 计算训练集指标 y_train = train_ts[:len(train_fitted)] train_rmse, train_mae, train_r2 = calculate_metrics(y_train, train_fitted)# 存储结果 disease_results = {'Disease': disease,'Model_Type': best_model_name,'Train_Size': len(train_data),'Test_Size': min_length,'Train_RMSE': train_rmse,'Test_RMSE': test_rmse,'Train_MAE': train_mae,'Test_MAE': test_mae,'Train_R2': train_r2,'Test_R2': test_r2,'AIC': best_model.aic if hasattr(best_model, 'aic') else np.nan }# 添加Holt-Winters参数if best_model_name.startswith("HW_"): disease_results.update({'Alpha': getattr(best_model.params, 'smoothing_level', np.nan),'Beta': getattr(best_model.params, 'smoothing_trend', np.nan),'Gamma': getattr(best_model.params, 'smoothing_seasonal', np.nan) })else: disease_results.update({'Alpha': np.nan,'Beta': np.nan,'Gamma': np.nan }) results_summary.append(disease_results)# 存储预测结果 pred_df = pd.DataFrame({'Date': test_dates,'Actual': y_test,'Predicted': test_pred,'Lower_80': lower_80[:min_length],'Upper_80': upper_80[:min_length],'Lower_95': lower_95[:min_length],'Upper_95': upper_95[:min_length],'Disease': disease })# 计算残差 pred_df['Residuals'] = pred_df['Actual'] - pred_df['Predicted'] predictions_list.append(pred_df)# 存储模型 models_dict[disease] = {'model': best_model,'model_type': best_model_name,'train_ts': train_ts }# 生成图表 plots_path = os.path.join(results_path, "Plots") decomposition_path = os.path.join(results_path, "Decomposition") residuals_path = os.path.join(results_path, "Residuals_Analysis")# 1. 主要结果图 plot_predictions(pred_df, disease, best_model_name, test_r2, test_rmse, plots_path)# 2. 时间序列分解图print(" 生成时间序列分解图...") decomposition = plot_decomposition( train_ts, disease, train_data['timestamp'].values, frequency, decomposition_path )# 3. 季节性模式图if decomposition is not None: plot_seasonal_pattern(decomposition, disease, frequency, plots_path)# 4. 训练集拟合效果图 train_fit_df = pd.DataFrame({'Date': train_data['timestamp'].values[:len(train_fitted)],'Actual': y_train,'Fitted': train_fitted }) plt.figure(figsize=(12, 6)) plt.plot(train_fit_df['Date'], train_fit_df['Actual'], label='真实值', color='blue', linewidth=1) plt.plot(train_fit_df['Date'], train_fit_df['Fitted'], label='拟合值', color='orange', linestyle='--', linewidth=1) plt.title(f'{disease} - 训练集拟合效果 (R²={train_r2:.3f})') plt.xlabel('日期') plt.ylabel('病例数') plt.legend() plt.grid(True, alpha=0.3) plt.savefig(os.path.join(plots_path, f'{disease}_Training_Fit.png'), dpi=300, bbox_inches='tight') plt.close()# 5. 残差自相关图 plot_residual_acf(pred_df['Residuals'], disease, residuals_path)# 6. 模型参数图(如果适用)if best_model_name.startswith("HW_"): params = {'Alpha': getattr(best_model.params, 'smoothing_level', np.nan),'Beta': getattr(best_model.params, 'smoothing_trend', np.nan),'Gamma': getattr(best_model.params, 'smoothing_seasonal', np.nan) }if not all(pd.isna(list(params.values()))): plt.figure(figsize=(8, 6)) param_names = list(params.keys()) param_values = list(params.values()) bars = plt.bar(param_names, param_values, alpha=0.8, color=['skyblue', 'lightgreen', 'lightcoral']) plt.title(f'{disease} - 模型参数') plt.xlabel('参数') plt.ylabel('参数值') plt.grid(True, alpha=0.3)# 添加数值标签for bar, value in zip(bars, param_values): plt.text(bar.get_x() + bar.get_width() / 2, bar.get_height() + 0.01, f'{value:.3f}', ha='center', va='bottom') plt.savefig(os.path.join(plots_path, f'{disease}_Model_Parameters.png'), dpi=300, bbox_inches='tight') plt.close()print(f" {disease} 建模完成") except Exception as e:print(f" 处理疾病 {disease} 时发生错误: {e}") import traceback traceback.print_exc()continue# 保存总体结果if results_summary: results_df = pd.DataFrame(results_summary) results_df.to_csv(os.path.join(results_path, "Model_Performance_Summary.csv"), index=False, encoding='utf-8-sig')# 保存预测结果 all_predictions = pd.concat(predictions_list, ignore_index=True) all_predictions.to_csv(os.path.join(results_path, "Predictions","All_Disease_Predictions.csv"), index=False, encoding='utf-8-sig')# 保存模型 joblib.dump(models_dict, os.path.join(results_path, "Models", "all_ts_models.pkl"))# 生成性能比较图 plt.figure(figsize=(12, 8)) sorted_results = results_df.sort_values('Test_R2')# 为不同模型类型分配颜色 model_types = sorted_results['Model_Type'].unique() color_map = {model: plt.cm.Set1(i / len(model_types)) for i, model in enumerate(model_types)} colors = [color_map[model] for model in sorted_results['Model_Type']] bars = plt.bar(range(len(sorted_results)), sorted_results['Test_R2'], color=colors, alpha=0.8) plt.xticks(range(len(sorted_results)), sorted_results['Disease'], rotation=45) plt.xlabel('疾病类型') plt.ylabel('R²') plt.title('时间序列模型性能比较 (测试集)')# 添加数值标签for i, (bar, r2, model_type) in enumerate(zip(bars, sorted_results['Test_R2'], sorted_results['Model_Type'])): plt.text(bar.get_x() + bar.get_width() / 2, bar.get_height() + 0.01, f'{r2:.3f}\n{model_type}', ha='center', va='bottom', fontsize=9) plt.grid(True, alpha=0.3) plt.tight_layout() plt.savefig(os.path.join(results_path, "Plots", "Model_Performance_Comparison.png"), dpi=300, bbox_inches='tight') plt.close()# 所有疾病预测结果叠加图 fig, axes = plt.subplots(3, 2, figsize=(14, 12)) axes = axes.flatten()for i, disease in enumerate(target_diseases):if i < len(axes): disease_data = all_predictions[all_predictions['Disease'] == disease]if not disease_data.empty: axes[i].plot(disease_data['Date'], disease_data['Actual'], label='真实值', alpha=0.7, linewidth=1) axes[i].plot(disease_data['Date'], disease_data['Predicted'], label='预测值', alpha=0.7, linestyle='--', linewidth=1) axes[i].set_title(disease) axes[i].set_xlabel('日期') axes[i].set_ylabel('病例数') axes[i].legend() axes[i].grid(True, alpha=0.3) plt.suptitle('所有疾病预测结果对比 (2016-2025)', fontsize=16) plt.tight_layout() plt.savefig(os.path.join(results_path, "Plots", "All_Diseases_Predictions.png"), dpi=300, bbox_inches='tight') plt.close()# 参数热力图(如果适用) param_cols = ['Alpha', 'Beta', 'Gamma'] param_data = results_df[['Disease'] + param_cols].dropna(subset=param_cols, how='all')if len(param_data) > 0: param_melted = param_data.melt(id_vars=['Disease'], value_vars=param_cols, var_name='Parameter', value_name='Value') plt.figure(figsize=(10, 8)) pivot_data = param_melted.pivot(index='Disease', columns='Parameter', values='Value') sns.heatmap(pivot_data, annot=True, cmap='coolwarm', center=0.5, cbar_kws={'label': '参数值'}) plt.title('模型参数热力图') plt.tight_layout() plt.savefig(os.path.join(results_path, "Plots", "Model_Parameters_Heatmap.png"), dpi=300, bbox_inches='tight') plt.close()# 生成报告print("\n" + "=" * 50)print("时间序列建模完成")print("=" * 50)print(f"建模疾病数量: {len(target_diseases)}")print("训练集时间范围: 1981-2015")print("测试集时间范围: 2016-2025\n")print("模型性能总结:")print(results_df.round(4))if not results_df.empty: best_model_row = results_df.loc[results_df['Test_R2'].idxmax()]print(f"\n最佳性能模型:")print(f"疾病: {best_model_row['Disease']}, 模型类型: {best_model_row['Model_Type']}, " f"测试集R²: {best_model_row['Test_R2']:.3f}, " f"RMSE: {best_model_row['Test_RMSE']:.1f}") avg_r2 = results_df['Test_R2'].mean() avg_rmse = results_df['Test_RMSE'].mean()print(f"\n平均性能:")print(f"平均测试集R²: {avg_r2:.3f}")print(f"平均测试集RMSE: {avg_rmse:.1f}") model_type_stats = results_df['Model_Type'].value_counts()print(f"\n模型类型分布:")print(model_type_stats)else:print("没有成功训练的模型")print("\n文件输出:")print("1. Results时间HW/Model_Performance_Summary.csv - 模型性能汇总")print("2. Results时间HW/Predictions/All_Disease_Predictions.csv - 所有预测结果")print("3. Results时间HW/Models/all_ts_models.pkl - 所有训练好的模型")print("4. Results时间HW/Plots/ - 各种可视化图表")print("5. Results时间HW/Decomposition/ - 时间序列分解图")print("6. Results时间HW/Residuals_Analysis/ - 残差分析图")print("\n" + "=" * 50)print("时间序列分析完成")print("=" * 50)if __name__ == "__main__": main()