科研绘图之数据绘图-Python版
- 2026-07-04 07:53:16
科研绘图之数据绘图-Python版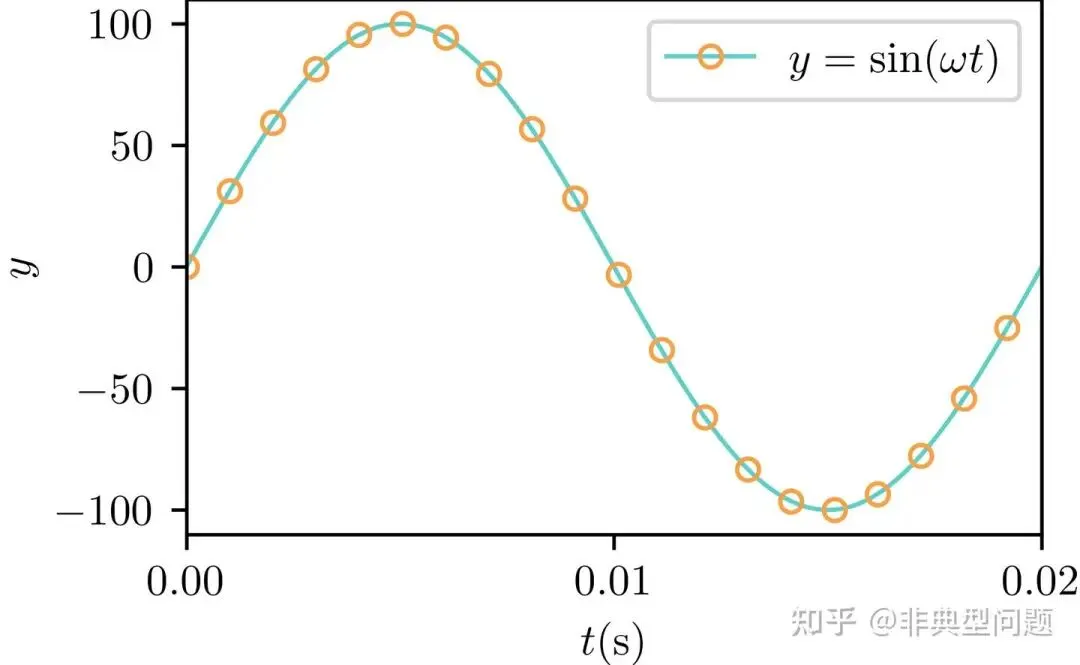
点线图 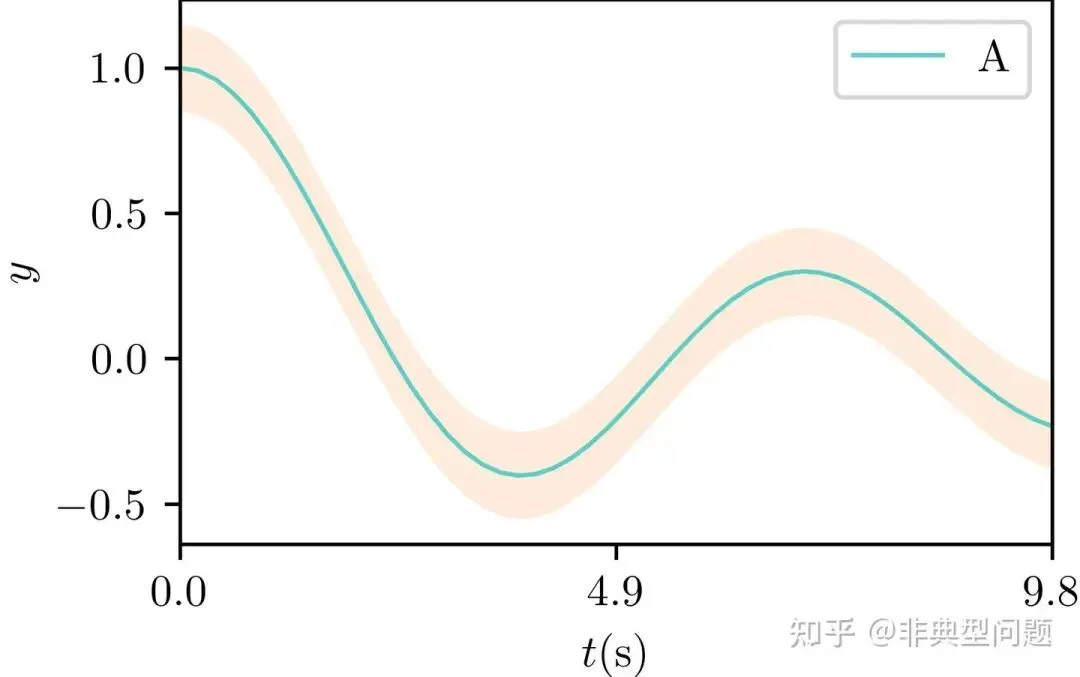
带置信区间的曲线图 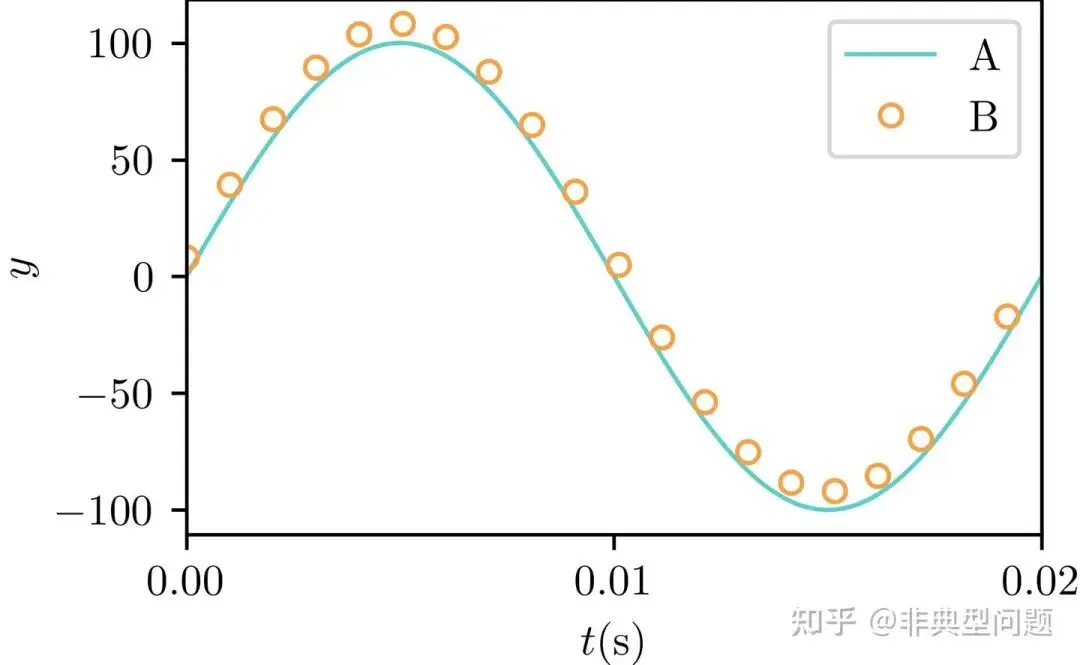
点、线组合图 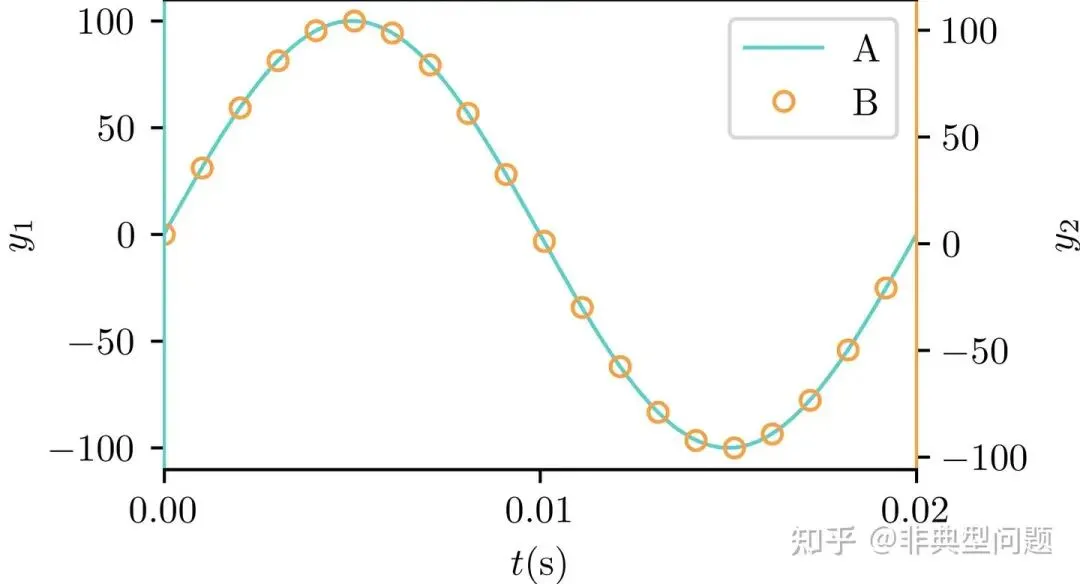
双Y轴折线图 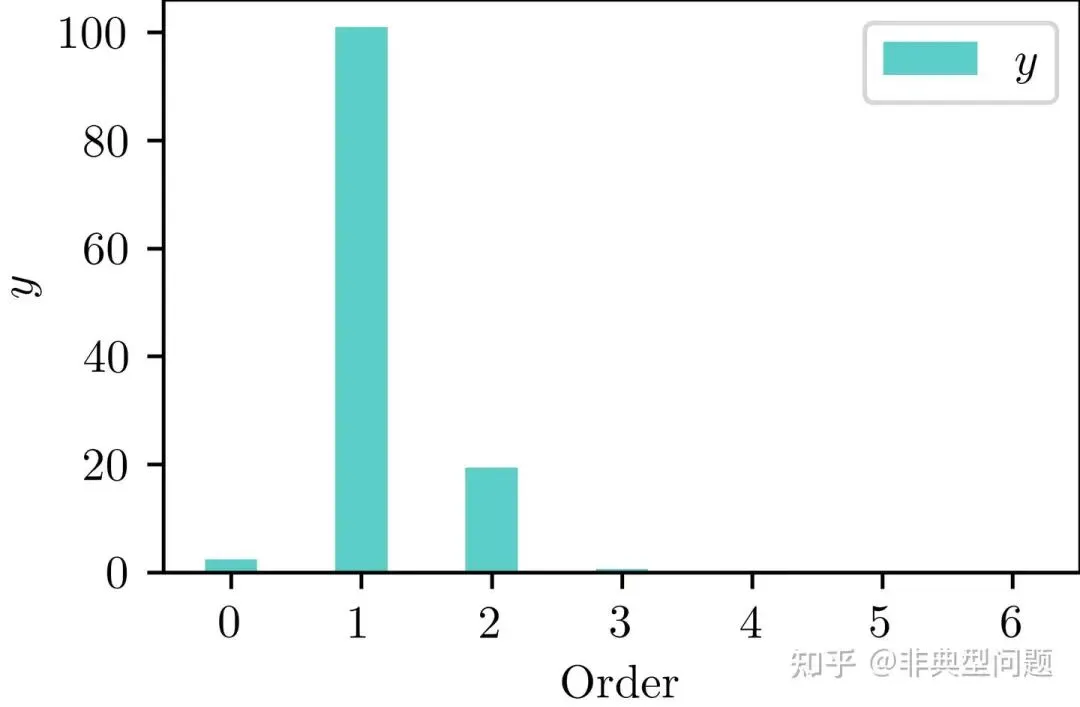
条形图 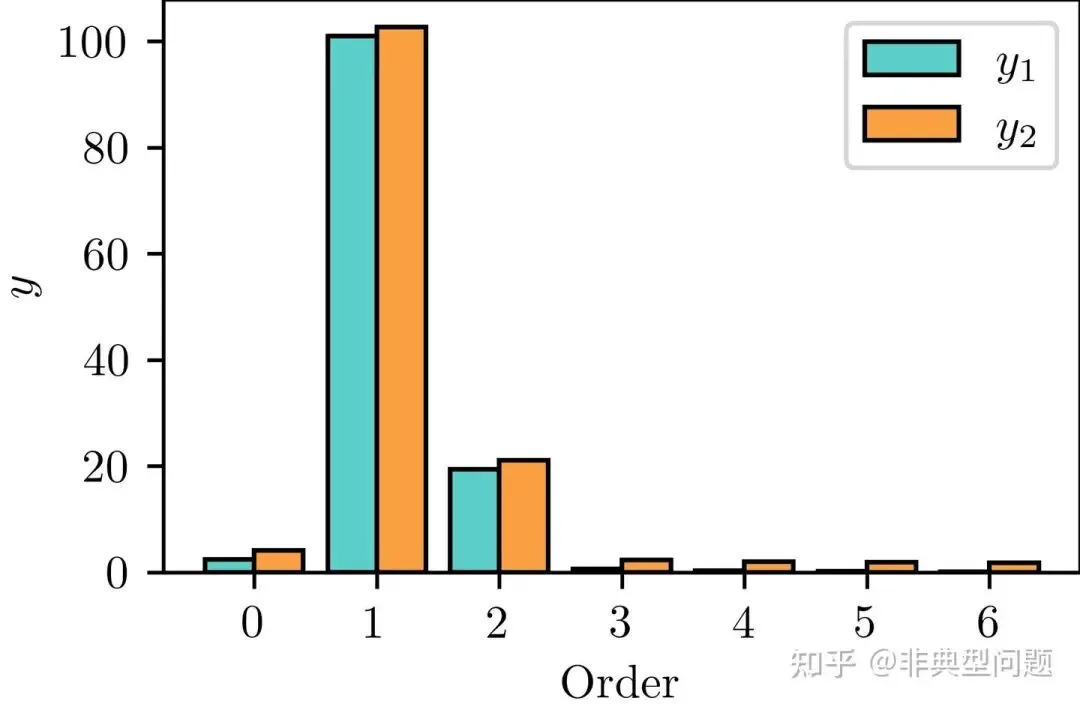
组合条形图 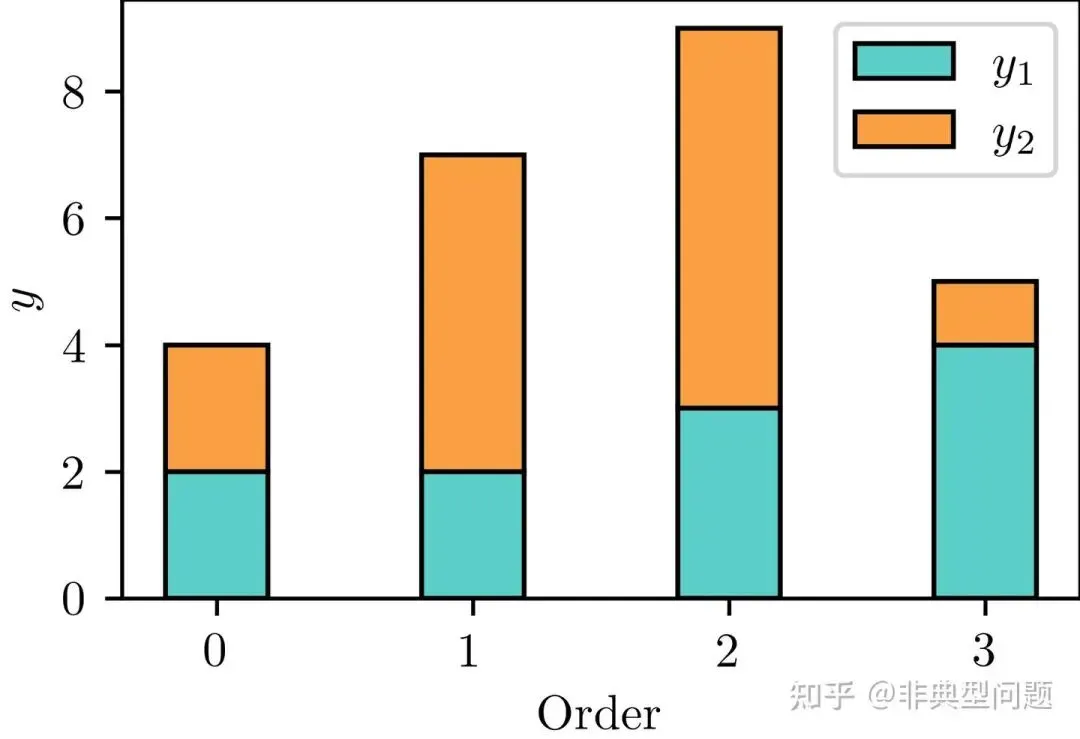
堆叠条形图 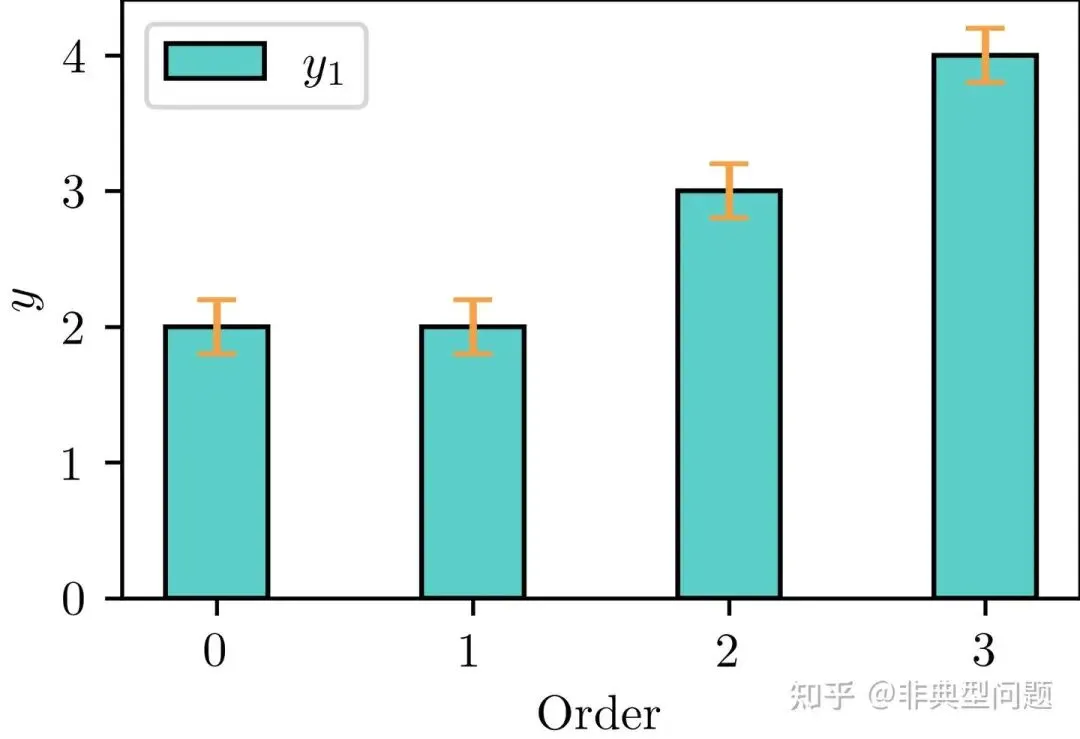
条形图带误差棒 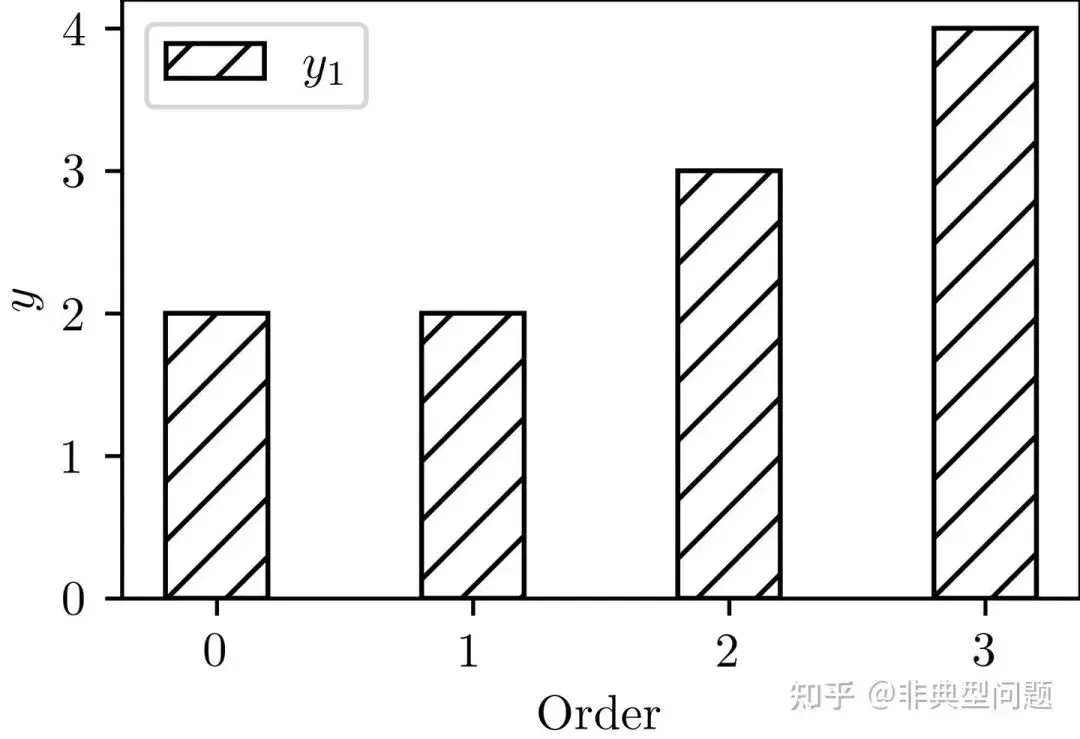
条形图带纹理填充
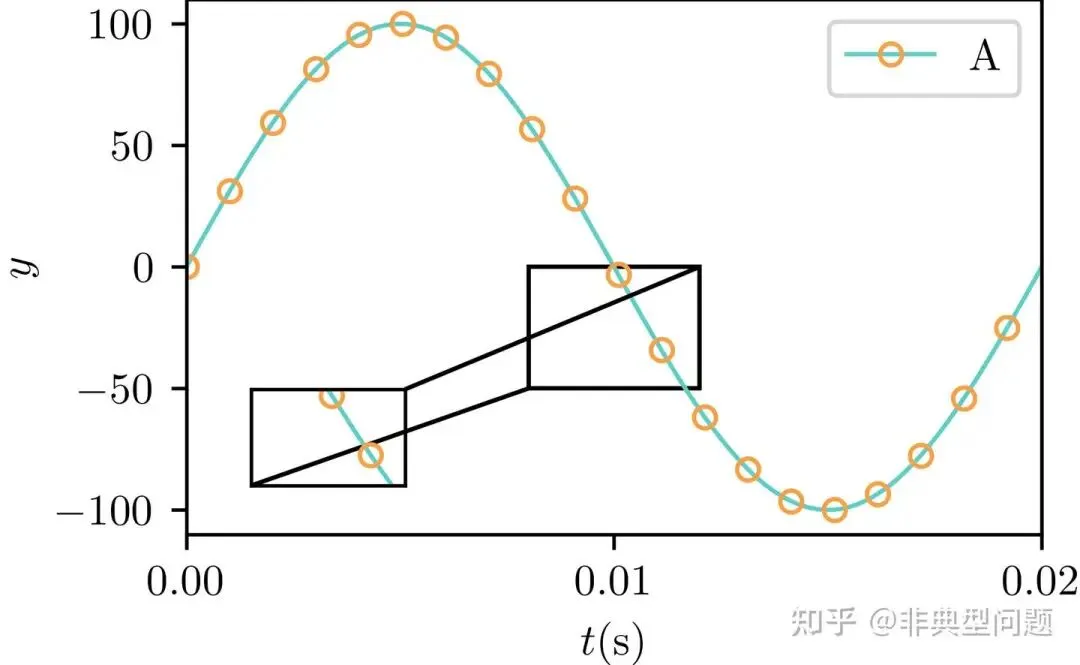
局部放大图 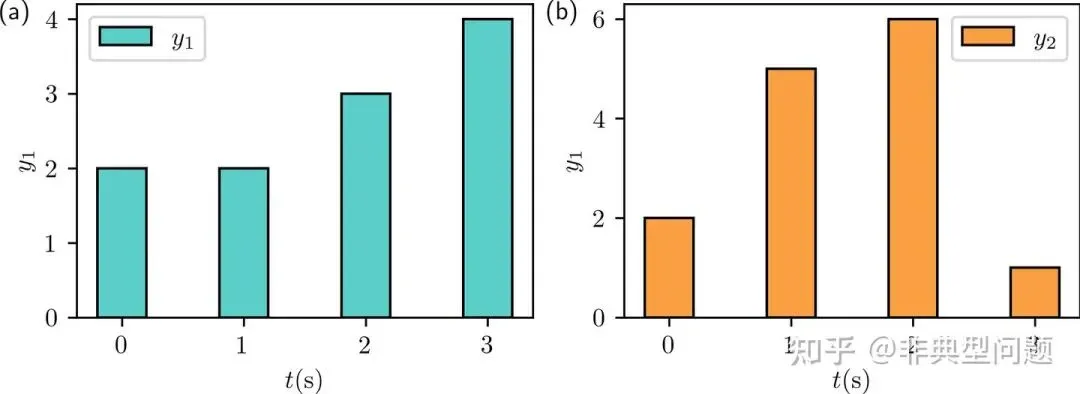
组合图 原文链接:https://zhuanlan.zhihu.com/p/676573903 来源:【非典型问题】知乎文章。内容仅做学术分享之用,不代表本号观点,版权归原作者所有,若涉及侵权等行为,请联系我们删除,万分感谢!
1 点线图
1.1 普通点线图matplotlib.axes.Axes.plot - Matplotlib 3.8.2 documentationmatplotlib.org/stable/api/_as_gen/matplotlib.axes.Axes.plot.html
# 引用包importnumpyasnpimportmatplotlib.pyplotaspltimportmatplotlibasmplfrommatplotlibimportrcParams# 自定义颜色color1=np.divide((91,206,201),255)color2=np.divide((140,215,122),255)color3=np.divide((250,159,66),255)color4=np.divide((243,83,59),255)# 自定义数据,自行修改f=50T=1/fomega=2*np.pi*f# t=np.linspace(0,T,100)# a=100*np.sin(omega*t)# mpl.rcParams['font.sans-serif']='Times New Roman'# 设置字体为新罗马mpl.rcParams['text.usetex']=True# 默认为false,此处设置为TRUEfig,ax=plt.subplots(figsize=(3.5,2.2))# 设置图窗及窗口大小为宽3.5英寸,高2.2英寸ax.plot(t,a,'-o',linewidth=1.0,color=color1,markevery=5,markerfacecolor='none',markeredgecolor=color3,markersize='5',markeredgewidth=1,label='$y = \sin (\omega t)$')# 绘点线图ax.set_xlabel('$t{\mathrm{(s)}}$')# 设置X轴标签ax.set_ylabel('$y$')# 设置Y轴标签ax.minorticks_off()# 取消显示次刻度ax.set_xticks([min(t),(min(t)+max(t))/2,max(t)])# 设置X轴刻度标签,可以手动调节ax.set_xlim([min(t),max(t)])# 设置X轴显示范围ax.legend()# 设置图例plt.savefig('fig1.png',dpi=600,bbox_inches='tight',pad_inches=0.0)# 导出PNG格式图片,600DPI,无白边plt.savefig('fig1.pdf',dpi=600,bbox_inches='tight',pad_inches=0.0)# 导出pdf格式图片,600DPI,无白边plt.show()1.2 带置信区间的曲线图matplotlib.axes.Axes.fill_between - Matplotlib 3.8.2 documentationmatplotlib.org/stable/api/_as_gen/matplotlib.axes.Axes.fill_between.html
# 引用包importnumpyasnpimportmatplotlib.pyplotaspltimportmatplotlibasmplfrommatplotlibimportrcParamsfromscipy.specialimportjv# 自定义颜色color1=np.divide((91,206,201),255)color2=np.divide((140,215,122),255)color3=np.divide((250,159,66),255)color4=np.divide((243,83,59),255)# 自定义数据,自行修改a=np.arange(0,10,0.2)b=jv(0,a)# 贝塞尔函数mpl.rcParams['font.sans-serif']='Times New Roman'# 设置字体为新罗马mpl.rcParams['text.usetex']=True# 默认为false,此处设置为TRUEfig,ax=plt.subplots(figsize=(3.5,2.2))# 设置图窗及窗口大小为宽3.5英寸,高2.2英寸ax.plot(a,b,'-',linewidth=1.0,color=color1,markevery=5,markerfacecolor='none',markeredgecolor=color3,markersize='5',markeredgewidth=1,label='A')# 绘线图ax.fill_between(a,b-0.15,b+0.15,facecolor=color3,alpha=0.2)# 绘制置信范围ax.set_xlabel('$t{\mathrm{(s)}}$')# 设置X轴标签ax.set_ylabel('$y$')# 设置Y轴标签ax.minorticks_off()# 取消显示次刻度ax.set_xticks([min(a),(min(a)+max(a))/2,max(a)])# 设置X轴刻度标签,可以手动调节ax.set_xlim([min(a),max(a)])# 设置X轴显示范围ax.legend()# 设置图例plt.savefig('fig2.png',dpi=600,bbox_inches='tight',pad_inches=0.0)# 导出PNG格式图片,600DPI,无白边plt.savefig('fig2.pdf',dpi=600,bbox_inches='tight',pad_inches=0.0)# 导出pdf格式图片,600DPI,无白边plt.show()1.3 点、线组合图matplotlib.axes.Axes.plot - Matplotlib 3.8.2 documentationmatplotlib.org/stable/api/_as_gen/matplotlib.axes.Axes.plot.html
# 引用包importnumpyasnpimportmatplotlib.pyplotaspltimportmatplotlibasmplfrommatplotlibimportrcParams# 自定义颜色color1=np.divide((91,206,201),255)color2=np.divide((140,215,122),255)color3=np.divide((250,159,66),255)color4=np.divide((243,83,59),255)# 自定义数据,自行修改f=50T=1/fomega=2*np.pi*f# t=np.linspace(0,T,100)# a=100*np.sin(omega*t)# b=a+10*np.random.rand()mpl.rcParams['font.sans-serif']='Times New Roman'# 设置字体为新罗马mpl.rcParams['text.usetex']=True# 默认为false,此处设置为TRUEfig,ax=plt.subplots(figsize=(3.5,2.2))# 设置图窗及窗口大小为宽3.5英寸,高2.2英寸ax.plot(t,a,'-',linewidth=1.0,color=color1,label='$\mathrm{A}$')# 绘线图ax.plot(t,b,'o',linewidth=1.0,color=color3,markevery=5,markerfacecolor='none',markeredgecolor=color3,markersize='5',markeredgewidth=1,label='$\mathrm{B}$')# 绘点图ax.set_xlabel('$t{\mathrm{(s)}}$')# 设置X轴标签ax.set_ylabel('$y$')# 设置Y轴标签ax.minorticks_off()# 取消显示次刻度ax.set_xticks([min(t),(min(t)+max(t))/2,max(t)])# 设置X轴刻度标签,可以手动调节ax.set_xlim([min(t),max(t)])# 设置X轴显示范围ax.legend()# 设置图例plt.savefig('fig3.png',dpi=600,bbox_inches='tight',pad_inches=0.0)# 导出PNG格式图片,600DPI,无白边plt.savefig('fig3.pdf',dpi=600,bbox_inches='tight',pad_inches=0.0)# 导出pdf格式图片,600DPI,无白边plt.show()1.4 双Y轴折线图
matplotlib.axes.Axes.plot — Matplotlib 3.8.2 documentationmatplotlib.org/stable/api/_as_gen/matplotlib.axes.Axes.plot.html
# 引用包importnumpyasnpimportmatplotlib.pyplotaspltimportmatplotlibasmplfrommatplotlibimportrcParams# 自定义颜色color1=np.divide((91,206,201),255)color2=np.divide((140,215,122),255)color3=np.divide((250,159,66),255)color4=np.divide((243,83,59),255)# 自定义数据,自行修改f=50T=1/fomega=2*np.pi*ft=np.linspace(0,T,100)a=100*np.sin(omega*t)b=a+10*np.random.rand()mpl.rcParams['font.sans-serif']='Times New Roman'# 设置字体为新罗马mpl.rcParams['text.usetex']=True# 默认为false,此处设置为TRUEfig,ax1=plt.subplots(figsize=(3.5,2.2))# 设置图窗及窗口大小为宽3.5英寸,高2.2英寸ax2=ax1.twinx()#复制坐标轴line1=ax1.plot(t,a,'-',linewidth=1.0,color=color1,label='$\mathrm{A}$')# 绘线图line2=ax2.plot(t,b,'o',linewidth=1.0,color=color3,markevery=5,markerfacecolor='none',markeredgecolor=color3,markersize='5',markeredgewidth=1,label='$\mathrm{B}$')# 绘点图ax1.set_xlabel('$t{\mathrm{(s)}}$')# 设置X轴标签ax1.set_ylabel('$y_1$')# 设置Y1轴标签ax2.set_ylabel('$y_2$')# 设置Y2轴标签# 设置轴线颜色ax1.spines['left'].set_color(color1)ax2.spines['left'].set_color(color1)ax1.spines['right'].set_color(color3)ax2.spines['right'].set_color(color3)ax1.minorticks_off()# 取消显示次刻度ax1.set_xticks([min(t),(min(t)+max(t))/2,max(t)])# 设置X轴刻度标签,可以手动调节ax1.set_xlim([min(t),max(t)])# 设置X轴显示范围# 合并显示图例lines=line1+line2labels=[h.get_label()forhinlines]ax1.legend(lines,labels,loc='upper right')# 设置图例plt.savefig('fig4.png',dpi=600,bbox_inches='tight',pad_inches=0.0)# 导出PNG格式图片,600DPI,无白边plt.savefig('fig4.pdf',dpi=600,bbox_inches='tight',pad_inches=0.0)# 导出pdf格式图片,600DPI,无白边plt.show()2 条形图
2.1 普通条形图matplotlib.axes.Axes.bar - Matplotlib 3.8.2 documentationmatplotlib.org/stable/api/_as_gen/matplotlib.axes.Axes.bar.html
# 引用包importnumpyasnpimportmatplotlib.pyplotaspltimportmatplotlibasmplfrommatplotlibimportrcParamsfromscipy.specialimportjv# 自定义颜色color1=np.divide((91,206,201),255)color2=np.divide((140,215,122),255)color3=np.divide((250,159,66),255)color4=np.divide((243,83,59),255)# 自定义数据,自行修改f=50# 频率T=1/f# 一周期时间omega=2*np.pi*f# t_data=np.linspace(0,T,100)a=100*np.cos(omega*t_data)+20*np.cos(2*omega*t_data)a_complex=np.fft.fft(a)a_fft=2*abs(a_complex)/len(a_complex)mpl.rcParams['font.sans-serif']='Times New Roman'# 设置字体为新罗马mpl.rcParams['text.usetex']=True# 默认为false,此处设置为TRUEfig,ax=plt.subplots(figsize=(3.5,2.2))# 设置图窗及窗口大小为宽3.5英寸,高2.2英寸x_data=np.linspace(0,6,7)width=0.4# bar宽度ax.bar(x_data,a_fft[0:len(x_data)],width=width,label='$y$',color=color1)ax.set_xlabel('$\mathrm{Order}$')# 设置X轴标签ax.set_ylabel('$y$')# 设置Y轴标签ax.minorticks_off()# 取消显示次刻度ax.set_xticks(x_data)# 设置X轴刻度标签,可以手动调节ax.legend()# 设置图例plt.savefig('fig5.png',dpi=600,bbox_inches='tight',pad_inches=0.0)# 导出PNG格式图片,600DPI,无白边plt.savefig('fig5.pdf',dpi=600,bbox_inches='tight',pad_inches=0.0)# 导出pdf格式图片,600DPI,无白边plt.show()2.2 组合条形图matplotlib.axes.Axes.bar - Matplotlib 3.8.2 documentationmatplotlib.org/stable/api/_as_gen/matplotlib.axes.Axes.bar.html
# 引用包importnumpyasnpimportmatplotlib.pyplotaspltimportmatplotlibasmplfrommatplotlibimportrcParamsfromscipy.specialimportjv# 自定义颜色color1=np.divide((91,206,201),255)color2=np.divide((140,215,122),255)color3=np.divide((250,159,66),255)color4=np.divide((243,83,59),255)# 自定义数据,自行修改f=50# 频率T=1/f# 一周期时间omega=2*np.pi*f# t_data=np.linspace(0,T,100)a=100*np.cos(omega*t_data)+20*np.cos(2*omega*t_data)a_complex=np.fft.fft(a)a_fft=2*abs(a_complex)/len(a_complex)b=a_fft+5*np.random.rand()mpl.rcParams['font.sans-serif']='Times New Roman'# 设置字体为新罗马mpl.rcParams['text.usetex']=True# 默认为false,此处设置为TRUEfig,ax=plt.subplots(figsize=(3.5,2.2))# 设置图窗及窗口大小为宽3.5英寸,高2.2英寸x_data=np.linspace(0,6,7)# X轴标签width=0.4# bar宽度ax.bar(x_data-width/2,a_fft[0:len(x_data)],width=width,label='$y_1$',color=color1,edgecolor='k')ax.bar(x_data+width/2,b[0:len(x_data)],width=width,label='$y_2$',color=color3,edgecolor='k')ax.set_xlabel('$\mathrm{Order}$')# 设置X轴标签ax.set_ylabel('$y$')# 设置Y轴标签ax.minorticks_off()# 取消显示次刻度ax.set_xticks(x_data)# 设置X轴刻度标签,可以手动调节ax.legend()# 设置图例plt.savefig('fig6.png',dpi=600,bbox_inches='tight',pad_inches=0.0)# 导出PNG格式图片,600DPI,无白边plt.savefig('fig6.pdf',dpi=600,bbox_inches='tight',pad_inches=0.0)# 导出pdf格式图片,600DPI,无白边plt.show()2.3 堆叠条形图matplotlib.axes.Axes.bar - Matplotlib 3.8.2 documentationmatplotlib.org/stable/api/_as_gen/matplotlib.axes.Axes.bar.html
# 引用包importnumpyasnpimportmatplotlib.pyplotaspltimportmatplotlibasmplfrommatplotlibimportrcParamsfromscipy.specialimportjv# 自定义颜色color1=np.divide((91,206,201),255)color2=np.divide((140,215,122),255)color3=np.divide((250,159,66),255)color4=np.divide((243,83,59),255)# 自定义数据,自行修改y_1=(2,2,3,4)y_2=(2,5,6,1)mpl.rcParams['font.sans-serif']='Times New Roman'# 设置字体为新罗马mpl.rcParams['text.usetex']=True# 默认为false,此处设置为TRUEfig,ax=plt.subplots(figsize=(3.5,2.2))# 设置图窗及窗口大小为宽3.5英寸,高2.2英寸x_data=(0,1,2,3)width=0.4# bar宽度ax.bar(x_data,y_1,width=width,label='$y_1$',color=color1,edgecolor='k')ax.bar(x_data,y_2,bottom=y_1# 设置第二组bar在Y方向的起始位置,width=width,label='$y_2$',color=color3,edgecolor='k')ax.set_xlabel('$\mathrm{Order}$')# 设置X轴标签ax.set_ylabel('$y$')# 设置Y轴标签ax.minorticks_off()# 取消显示次刻度ax.set_xticks(x_data)# 设置X轴刻度标签,可以手动调节ax.legend()# 设置图例plt.savefig('fig7.png',dpi=600,bbox_inches='tight',pad_inches=0.0)# 导出PNG格式图片,600DPI,无白边plt.savefig('fig7.pdf',dpi=600,bbox_inches='tight',pad_inches=0.0)# 导出pdf格式图片,600DPI,无白边plt.show()2.4 条形图带误差棒matplotlib.axes.Axes.errorbar - Matplotlib 3.8.2 documentationmatplotlib.org/stable/api/_as_gen/matplotlib.axes.Axes.errorbar.html
# 引用包importnumpyasnpimportmatplotlib.pyplotaspltimportmatplotlibasmplfrommatplotlibimportrcParamsfromscipy.specialimportjv# 自定义颜色color1=np.divide((91,206,201),255)color2=np.divide((140,215,122),255)color3=np.divide((250,159,66),255)color4=np.divide((243,83,59),255)# 自定义数据,自行修改x_data=(0,1,2,3)y_1=(2,2,3,4)mpl.rcParams['font.sans-serif']='Times New Roman'# 设置字体为新罗马mpl.rcParams['text.usetex']=True# 默认为false,此处设置为TRUEfig,ax=plt.subplots(figsize=(3.5,2.2))# 设置图窗及窗口大小为宽3.5英寸,高2.2英寸width=0.4ax.bar(x_data,y_1,width=width,label='$y_1$',color=color1,edgecolor='k')# 绘制条形图ax.errorbar(x_data,y_1,yerr=0.2,capsize=4,fmt=' ',color=color3)# 绘制误差棒,不显示折线ax.set_xlabel('$\mathrm{Order}$')# 设置X轴标签ax.set_ylabel('$y$')# 设置Y轴标签ax.minorticks_off()# 取消显示次刻度ax.set_xticks(x_data)# 设置X轴刻度标签,可以手动调节ax.legend()# 设置图例plt.savefig('fig8.png',dpi=600,bbox_inches='tight',pad_inches=0.0)# 导出PNG格式图片,600DPI,无白边plt.savefig('fig8.pdf',dpi=600,bbox_inches='tight',pad_inches=0.0)# 导出pdf格式图片,600DPI,无白边plt.show()2.5 条形图带纹理填充matplotlib.pyplot.bar - Matplotlib 3.8.2 documentationmatplotlib.org/stable/api/_as_gen/matplotlib.pyplot.bar.html
# 引用包importnumpyasnpimportmatplotlib.pyplotaspltimportmatplotlibasmplfrommatplotlibimportrcParamsfromscipy.specialimportjv# 自定义颜色color1=np.divide((91,206,201),255)color2=np.divide((140,215,122),255)color3=np.divide((250,159,66),255)color4=np.divide((243,83,59),255)# 自定义数据,自行修改x_data=(0,1,2,3)y_1=(2,2,3,4)mpl.rcParams['font.sans-serif']='Times New Roman'# 设置字体为新罗马mpl.rcParams['text.usetex']=True# 默认为false,此处设置为TRUEfig,ax=plt.subplots(figsize=(3.5,2.2))# 设置图窗及窗口大小为宽3.5英寸,高2.2英寸width=0.4ax.bar(x_data,y_1,width=width,label='$y_1$',color='white',edgecolor='k',hatch='//')ax.set_xlabel('$\mathrm{Order}$')# 设置X轴标签ax.set_ylabel('$y$')# 设置Y轴标签ax.minorticks_off()# 取消显示次刻度ax.set_xticks(x_data)# 设置X轴刻度标签,可以手动调节ax.legend()# 设置图例plt.savefig('fig9.png',dpi=600,bbox_inches='tight',pad_inches=0.0)# 导出PNG格式图片,600DPI,无白边plt.savefig('fig9.pdf',dpi=600,bbox_inches='tight',pad_inches=0.0)# 导出pdf格式图片,600DPI,无白边plt.show()支持的填充纹理有如下:
3 组合图
3.1 局部放大图
# 引用包importnumpyasnpimportmatplotlib.pyplotaspltimportmatplotlibasmplfrommatplotlibimportrcParamsfrommpl_toolkits.axes_grid1.inset_locatorimportmark_insetfrommpl_toolkits.axes_grid1.inset_locatorimportinset_axes# 自定义颜色color1=np.divide((91,206,201),255)color2=np.divide((140,215,122),255)color3=np.divide((250,159,66),255)color4=np.divide((243,83,59),255)# 自定义数据,自行修改f=50T=1/fomega=2*np.pi*f# t=np.linspace(0,T,100)# a=100*np.sin(omega*t)# b=a+10*np.random.rand()mpl.rcParams['font.sans-serif']='Times New Roman'# 设置字体为新罗马mpl.rcParams['text.usetex']=True# 默认为false,此处设置为TRUEfig,ax1=plt.subplots(figsize=(3.5,2.2))# 设置图窗及窗口大小为宽3.5英寸,高2.2英寸line1=ax1.plot(t,a,'-o',linewidth=1.0,color=color1,markevery=5,markerfacecolor='none',markeredgecolor=color3,markersize='5',markeredgewidth=1,label='$\mathrm{A}$')# 绘线图# 插入放大区域的坐标系ax2=inset_axes(ax1,width="20%",height="20%",loc='lower left',# 参数根据需要自行修改bbox_to_anchor=(0.05,0.05,0.9,0.9),# 参数根据需要自行修改bbox_transform=ax1.transAxes)ax2.plot(t,a,'-o',linewidth=1.0,color=color1,markevery=5,markerfacecolor='none',markeredgecolor=color3,markersize='5',markeredgewidth=1,label='$\mathrm{A}$')# 绘线图# 放大区域xlim_ax2=(0.008,0.012)# X轴显示范围ylim_ax2=(-50,0)# Y轴显示范围ax2.set_xlim(xlim_ax2)# 设置X轴显示范围ax2.set_ylim(ylim_ax2)# 设置Y轴显示范围mark_inset(ax1,ax2,loc1=3,loc2=1,fc="none",ec='k',lw=1)# 放大区域与原位置的连接线# 细节设置ax1.set_xlabel('$t{\mathrm{(s)}}$')# 设置X轴标签ax1.set_ylabel('$y$')# 设置Y轴标签ax1.minorticks_off()# ax1.set_xticks([min(t),(min(t)+max(t))/2,max(t)])# 设置X轴刻度标签,可以手动调节ax1.set_xlim([min(t),max(t)])# 设置X轴显示范围ax2.set_xticks([])# 不显示放大区域X轴刻度,可以手动修改ax2.set_yticks([])# 不显示放大区域Y轴刻度,可以手动修改ax1.legend()# 设置图例plt.savefig('fig10.png',dpi=600,bbox_inches='tight',pad_inches=0.0)# 导出PNG格式图片,600DPI,无白边plt.savefig('fig10.pdf',dpi=600,bbox_inches='tight',pad_inches=0.0)# 导出pdf格式图片,600DPI,无白边plt.show()3.2 组合图
# 引用包importnumpyasnpimportmatplotlib.pyplotaspltimportmatplotlibasmplfrommatplotlibimportrcParamsfromscipy.specialimportjv# 自定义颜色color1=np.divide((91,206,201),255)color2=np.divide((140,215,122),255)color3=np.divide((250,159,66),255)color4=np.divide((243,83,59),255)# 自定义数据,自行修改y_1=(2,2,3,4)y_2=(2,5,6,1)mpl.rcParams['font.sans-serif']='Times New Roman'# 设置字体为新罗马mpl.rcParams['text.usetex']=True# 默认为false,此处设置为TRUEfig1,(ax1,ax2)=plt.subplots(1,2,figsize=(7,2.2))# 设置子图数量及图窗大小x_data=(0,1,2,3)width=0.4# 柱子宽度ax1.bar(x_data,y_1,width=width,label='$y_1$',color=color1,edgecolor='k')ax1.legend()# 显示图例ax1.text(-1,4,'(a)')# x,y的坐标根据图形显示的坐标轴刻度自行调整ax1.set_xlabel('$t{\mathrm{(s)}}$')# 设置X轴标签ax1.set_ylabel('$y_1$')# 设置Y1轴标签ax2.bar(x_data,y_2,width=width,label='$y_2$',color=color3,edgecolor='k')ax2.legend()# 显示图例ax2.text(-1,6,'(b)')# x,y的坐标根据图形显示的坐标轴刻度自行调整ax2.set_xlabel('$t{\mathrm{(s)}}$')# 设置X轴标签ax2.set_ylabel('$y_1$')# 设置Y2轴标签plt.savefig('fig11.png',dpi=600,bbox_inches='tight',pad_inches=0.0)# 导出PNG格式图片,600DPI,无白边plt.savefig('fig11.pdf',dpi=600,bbox_inches='tight',pad_inches=0.0)# 导出pdf格式图片,600DPI,无白边plt.show()版权声明
本文来自网友投稿或网络内容,如有侵犯您的权益请联系我们删除,联系邮箱:wyl860211@qq.com 。
随机文章
-
 10个月宝宝每天需要喝多少奶粉?
- 吃透 Linux 内核 / ARM64 /RISC-V开发,价值10880元的大合集,春节期间只要3099
- 【python学习】11格式化输出方法
- 嵌入式Linux“进程间通信”的“信号丢失”陷阱——英特尔嵌入式面试题
- Python最常见的36种配图代码实现!建议码住
- Linux 内核技术实战课(基础篇):内核启动流程
- Python学习【117】:python爬取有关“猫山王榴莲”销售情况等方面的信息
- Python+CAD自动化:让Excel设计表一键飞进CAD
- 【一起学Python】第18天:迭代器与生成器
- Linux运维-综合架构-nginx 常用模块 (上)
- Linux服务器部署1Panel开源面板管理,从建站到备份的全方位解决方案
